
XY Plot ViewerOpen .xy / .y data files (or a whole folder) in a webview and plot them with Plotly — line plots and overlaid histograms. Runs fully offline. Installation Launch VS Code Quick Open ( Ctrl+P), paste the following command, and press enter.Copied to clipboard |

XY Plot ViewerOpen The parsing and plotting math is a port of a single-file browser app; the
panel itself is not — it's a purpose-built VS Code panel (a thin toolbar +
slide-out inspector, see below) plus a Data Files view in the Activity
Bar for browsing and opening files, not the source app's page layout. VS Code
theme integration, workspace config, commands, and a fully offline Plotly
bundle (no CDN) round it out. The source app's 3D-histogram view is dropped —
it required Plotly's
Getting started
The custom editor is registered with priority Data Files (Activity Bar)The Activity Bar icon opens a tree view, Data Files, listing every
|
| View | What it draws |
|---|---|
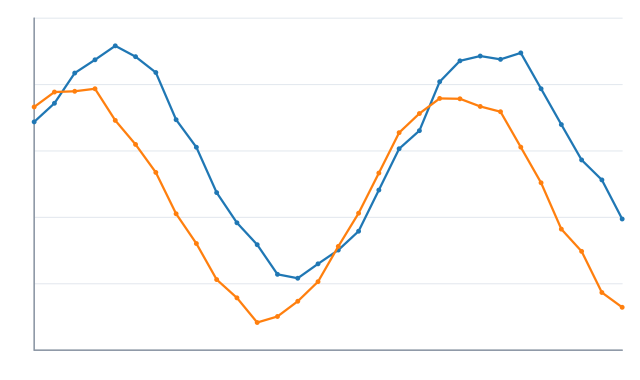
| Line plot | One scatter trace per visible dataset, mode: "lines+markers", marker size 5, line & marker color = the dataset's resolved color. |
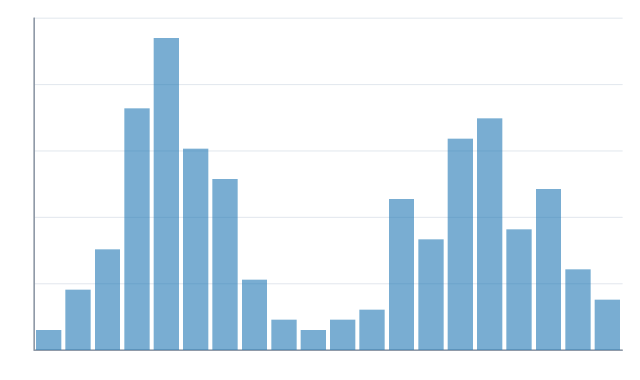
| Histogram | One histogram trace per visible dataset over that dataset's y-values, nbinsx = bins, opacity 0.6, barmode: "overlay". |
Hovering a data point shows its dataset name in full — layout.hoverlabel.namelength
is set to -1, overriding Plotly's default 15-character truncation, so a long
dataset name (Baseline_Control_Sensor_04, say) never gets cut down to
Baseline_Contro… in the tooltip.
Zooming: scroll the mouse wheel over the plot to zoom in/out (scrollZoom: true), in addition to the modebar's zoom / pan tools and click-drag box
zoom, which work the same as any Plotly chart. Double-click resets the view.
Two modebar buttons are removed rather than left looking clickable with no payoff: the camera ("Download plot as a png") button relies on triggering a browser file download, which doesn't work inside a VS Code webview; and Box Select / Lasso Select mark points as "selected" and fire a Plotly event for a page's own code to act on — nothing here listens for it, so dragging one just dimmed the unselected points and did nothing further.
The inspector
The toolbar is deliberately minimal: a Line / Histogram switch and one gear button. Everything else for the currently open file — bins & legend, dataset colors / visibility, and the label fields below — lives in the inspector, a drawer that slides in from the right when you click the gear (and back out when you click it again); the plot fills the rest of the window either way. (Browsing and opening files is the separate Data Files Activity Bar view, not this drawer.)
Inside it, per dataset: a color swatch (<input type=color> override) and a
visibility checkbox, plus a case-insensitive name filter and
Show All / Hide All / Reset Colors.
Title, X-axis label and Y-axis label each have a Set button:
- Title override is stored per original title.
- In line mode, X / Y labels are per-title overrides that fall back to a
file-name match in
xyPlot.namingRules, then to the mode's global label. In histogram mode they set the mode's global label directly — histogram's label is shared by every loaded file, so per-file naming rules don't apply there.
Field defaults: line — xlabel "Run", ylabel "Value"; histogram —
bins 20, xlabel "Value", ylabel "Count".
The status bar reads "<file> — <n> dataset(s) — <mode> view".
Configuration
Three mechanisms, from most to least specific — a more specific one always wins over a less specific one:
| Scope | Lives in | Applies | |
|---|---|---|---|
| 1. Set buttons | one file | xy_plot_config.json, written when you click Save Config |
when xyPlot.autoLoadConfig finds it next to the data |
2. xyPlot.namingRules |
every file matching a pattern | VS Code settings | automatically, live |
| 3. Settings | the whole extension | VS Code settings | defaults for anything not overridden above |
1. Save Config, then let auto-load apply it — step by step
There's a Save Config button but no separate Load Config one — loading is
driven entirely by the xyPlot.autoLoadConfig setting, not by a manual pick-a-
file step:
- Open the inspector (gear icon, top right) and set colors, visibility, and labels the way you want them.
- Click Save Config (or run XY Plot: Save Config). The Save dialog
defaults to
.vscode/xy-plot/xy_plot_config.jsonin the current workspace folder — pick anywhere you like, though it has to sit next to the data files for step 3 to find it. - Turn on
xyPlot.autoLoadConfig(see Settings). Any viewer opened after that loadsxy_plot_config.jsonon its own whenever one sits next to the data files — missing keys fall back to the defaults below;showLegendis treated as!== false.
{
  "colors": {
    "palette": ["#1f77b4", "#ff7f0e", "..."],
    "dataset_colors": { "<dataset name>": "#rrggbb" }
  },
  "plot_settings":      { "overrides": { "<title>": { "displayTitle": "...", "xlabel": "...", "ylabel": "..." } },
                          "xlabel": "Run", "ylabel": "Value", "showLegend": true },
  "histogram_settings": { "overrides": { "<title>": { "displayTitle": "..." } },
                          "bins": 20, "xlabel": "Value", "ylabel": "Count", "showLegend": true },
  "visibility": { "hidden_names": ["<dataset name>", "..."] }
}
plot_settings.overrides is keyed by a file's exact original title (its
name with the extension stripped) — a "match_scan_001" key affects only
match_scan_001.xy, not match_scan_002.xy too. If you want one rule to
cover every file with a shared prefix, that's what xyPlot.namingRules is
for, next.
The default color palette, cycled by dataset index:
#1f77b4 #ff7f0e #2ca02c #d62728 #9467bd #8c564b #e377c2 #7f7f7f #bcbd22 #17becf
A sample is at examples/xy_plot_config.json.
2. xyPlot.namingRules — auto-fill labels by file name
Unlike plot_settings.overrides above, a naming rule's match is a glob
(only * is special), so one rule can apply to a whole family of files —
"match_scan_*" matches match_scan_001, match_scan_002,
match_scan_anything, checked case-insensitively against the file name with
its extension stripped. Both example .xy files
(match_scan_001.xy,
match_scan_002.xy) pick up the same rule this
way — try it:
Command Palette → Preferences: Open Workspace Settings (JSON) (this project only) or …User Settings (JSON) (every workspace).
Add (or copy from
examples/settings.namingRules.jsonc):"xyPlot.namingRules": [ { "match": "match_scan_*", "xlabel": "Scan Position", "ylabel": "Signal Amplitude" }, { "match": "calibration_*", "xlabel": "Calibration Step" }, { "match": "*_noise", "ylabel": "Noise (mV)" } ]Save. Any
match_scan_*.xyfile already open in a viewer relabels immediately — no need to close and reopen it.
A rule's fields are { match, xlabel?, ylabel?, title? }, and only apply in
line mode (histogram's label is one field shared by every loaded file, so
per-file rules have nothing to attach to there). Rules are checked in array
order; when more than one matches, later rules override earlier ones
field-by-field, not as a whole, so a broad rule can set a default and a
narrower one can override just one field.
Set it in User settings for a rule that should apply everywhere, or in
this workspace's .vscode/settings.json for project-specific rules —
unlike a normal VS Code setting, the two are merged here (User rules first,
Workspace rules appended and taking precedence on conflict), not one
replacing the other.
A label set through the inspector's Set buttons and saved to
xy_plot_config.json always wins over a naming rule — naming rules only fill
in a default, they never override something you typed.
3. Other settings
| Setting | Default | Meaning |
|---|---|---|
xyPlot.defaultBins |
20 |
Initial bin count for the histogram view. |
xyPlot.defaultView |
auto |
auto (line for .xy, histogram for .y), or force line / histogram. |
xyPlot.palette |
10-color default | Palette cycled by dataset index. |
xyPlot.autoLoadConfig |
false |
If an xy_plot_config.json sits next to the data files, load it when the viewer opens. |
xyPlot.importFolder |
"data" |
Where Open Folder copies files to when the folder you pick is outside the workspace — see below. |
xyPlot.ignoreFolders |
[] |
Hide files under a directory whose name contains one of these terms from the Data Files view — see above. |
Per-file UI state (view mode, inspector open, selected file) is remembered in
workspaceState, keyed by the file URI.
Importing from outside the workspace
XY Plot: Open Folder in XY Plot Viewer treats "inside" and "outside" the
workspace differently:
- Inside the workspace (including every use from the explorer right-click, since that folder is by definition already part of it) — opens in place, same as always. Nothing is copied.
- Outside the workspace — the folder's
.xy/.yfiles are copied (never moved; the originals are left exactly where they were) intoxyPlot.importFolderunder the first workspace folder, creating it if needed, and it's those copies that open. A file already present at the destination is left as-is, not overwritten, so re-importing the same source folder only pulls in what's new. - No workspace open at all → there's nowhere to import into, so it falls back to opening the original folder in place (with a warning).
Offline & safety
- No network at runtime. Plotly is bundled into
media/webview.jsas a partial build — only thescatterandhistogramtrace modules are registered (~1.1 MB instead of ~3.5 MB). The webview CSP setsdefault-src 'none'andconnect-src 'none', scripts load only from a nonce'd tag, andlocalResourceRootsis limited tomedia/. (script-srcadditionally allows'unsafe-eval', which the bundled Plotly needs; no data or config file is ever routed through an eval path.) - No code execution from data or config files — plain text parsing and
JSON.parseonly. - Read-only with respect to the data: the extension never rewrites
.xy/.yfiles.
Theming
All chrome and the Plotly layout are driven by VS Code theme variables
(--vscode-editor-background, --vscode-foreground, --vscode-panel-border,
--vscode-focusBorder, …), so the viewer works in light, dark and
high-contrast themes and re-renders when you switch themes.
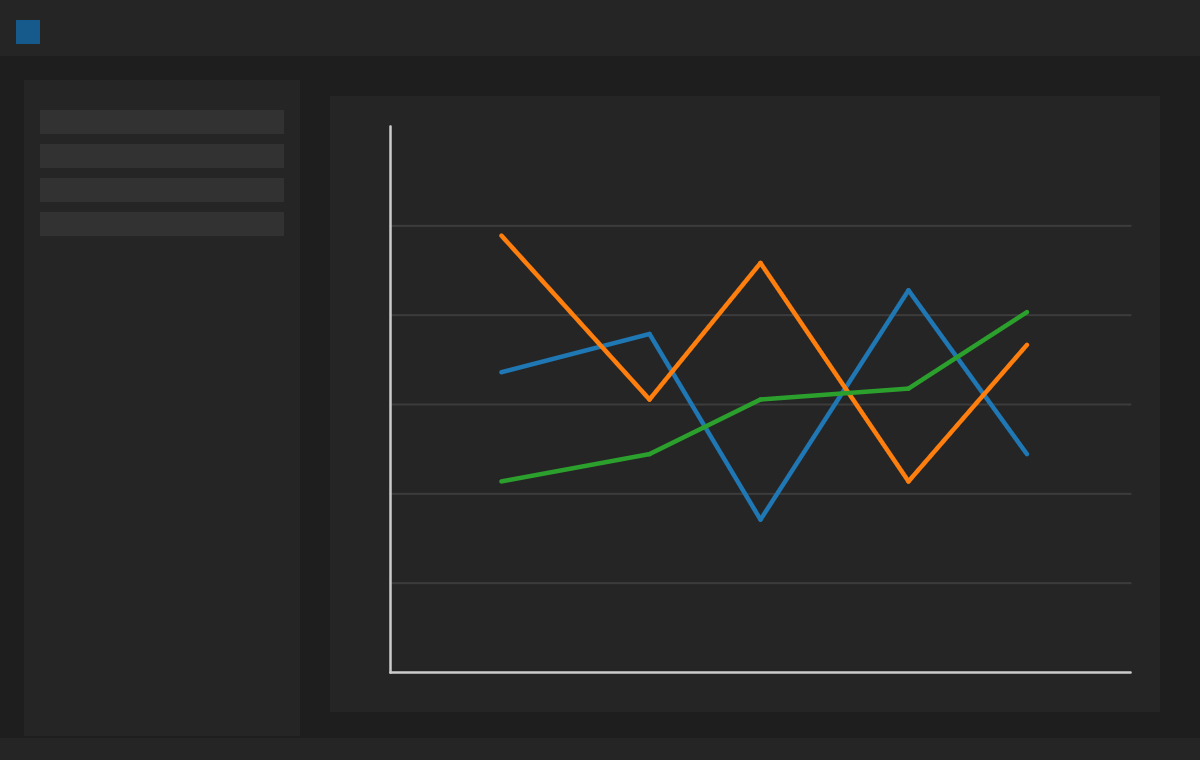
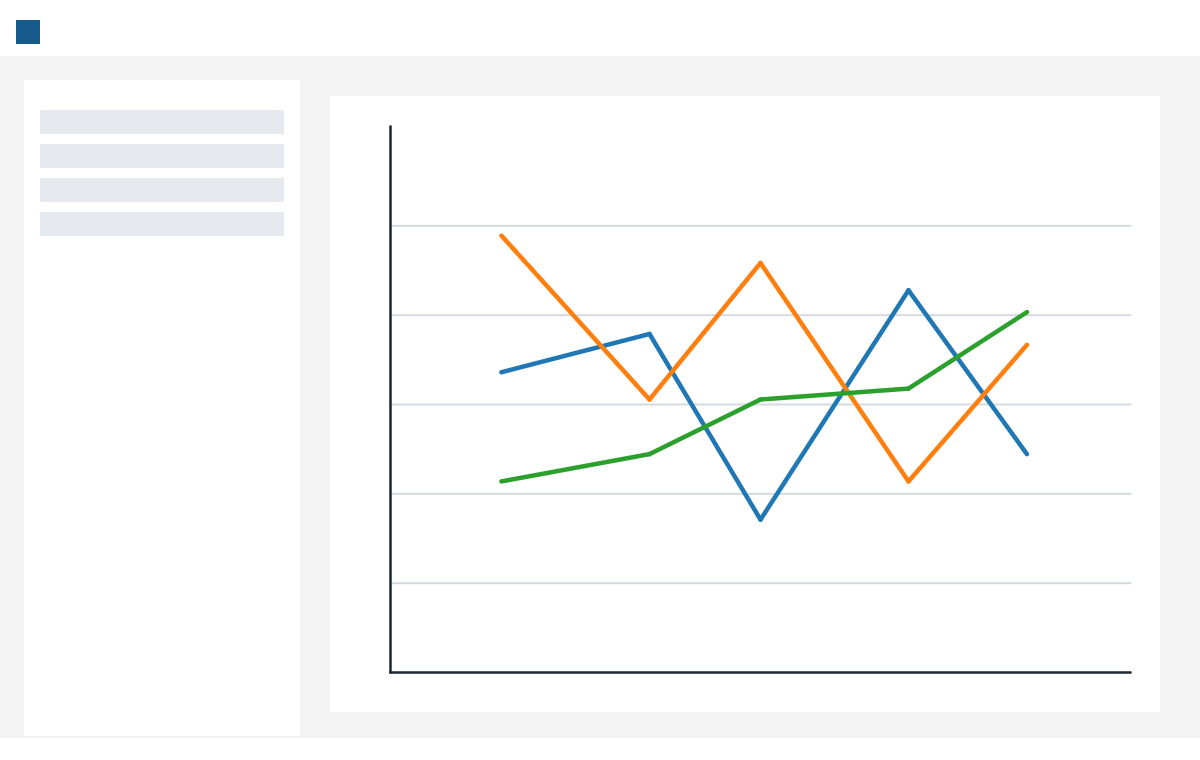
Capturing screenshots
images/screenshot-light.png and images/screenshot-dark.png ship as
placeholders (generated by node scripts/make-screenshots.mjs). To replace
them with real captures:
- F5 to launch the Extension Development Host.
- Open
examples/match_scan_001.xy; click the gear icon to open the inspector. - Set the color theme to a light theme (e.g. Light Modern), then
Developer: Capture Screenshot (or your OS tool) → save as
images/screenshot-light.png. - Switch to a dark theme (e.g. Dark Modern) and repeat →
images/screenshot-dark.png.
Architecture
src/core/     pure — no vscode, no DOM. parseXY / parseY / parseDataFile,
              color config, title/label overrides, visibility, naming-rule
              matching (namingRules.ts), ignore-folder matching
              (ignoreFolders.ts), config serialize/deserialize. Ported from
              the source app (parsing/plotting math) and unit-tested (test/);
              namingRules.ts, ignoreFolders.ts and the panel chrome are new,
              not ported.
src/webview/  panel UI + Plotly wiring: renderLine / renderHistogram /
              baseLayout / plotlyConfig, the DOM & event glue (toolbar, the
              inspector drawer), theme resolution, the partial Plotly bundle.
src/editor/   the CustomTextEditorProvider (webview HTML + CSP + nonce,
              sibling-folder scan, workspaceState, config auto-load, naming-rule
              scope merging, message pump) and the HTML template.
src/commands/ open, openFolder, saveConfig.
src/views/    DataFilesProvider — the "Data Files" Activity Bar tree view:
              groups files by folder, applies xyPlot.ignoreFolders, refreshes
              on a FileSystemWatcher or a config change. Independent of the
              webview / custom editor.
src/protocol.ts   typed host <-> webview messages.
Build: esbuild.mjs emits a Node/CJS bundle for the extension host and a
browser/IIFE bundle (with Plotly) for the webview, and copies ui.css
alongside Plotly's webview.css.
Versions
| Version | Highlights |
|---|---|
| 0.4.0 | Data Files grouped by folder (no more identical-name confusion); new xyPlot.ignoreFolders setting. |
| 0.3.0 | Data Files moved to an Activity Bar view; full dataset names on hover; mouse-wheel zoom; the broken "download png" button removed; Load Config removed in favor of xyPlot.autoLoadConfig; live-updating xyPlot.namingRules; README Configuration walkthrough. |
| 0.2.0 | Native-inspector redesign (toolbar + slide-out drawer, replacing the ported page layout); xyPlot.namingRules — auto-fill axis labels/title by file name. |
| 0.1.0 | Initial release: line + histogram views, Datasets & Labels panel, config save/load, offline Plotly bundle. |
Full details in CHANGELOG.md.
License
MIT — see LICENSE.