Claude Stats
View your Claude Code usage statistics directly inside VS Code. Local by default — no API key, no account, no network access. Optional end-to-end-encrypted backup & sync to a cloud folder you already control.
Features
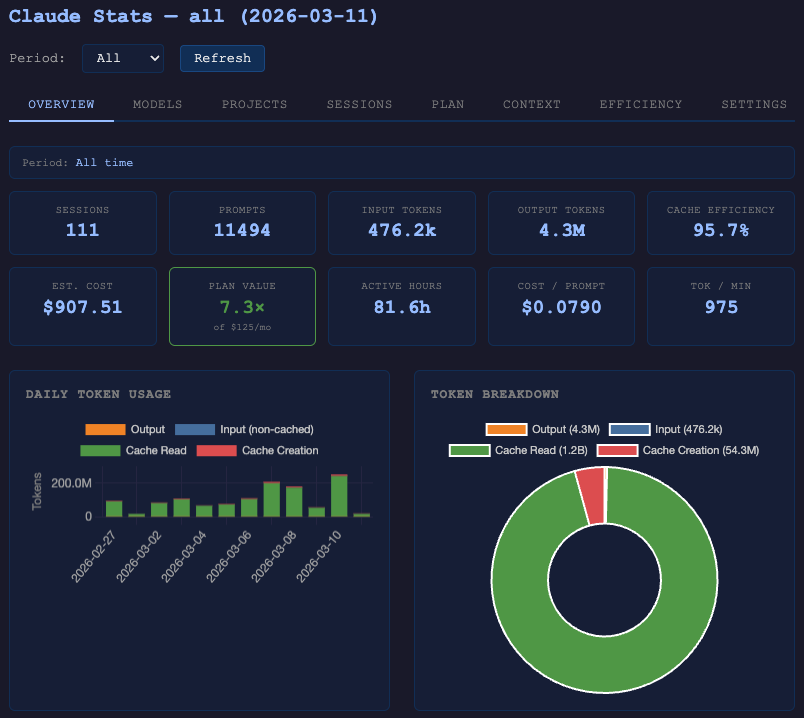
- Dashboard webview in the activity bar with tokens, cost, sessions, cache efficiency, and streaks
- Per-project breakdown showing where your tokens and dollars are going
- Spending view with model, session, tool, and MCP-server cost attribution
- Environmental context translating token usage into energy, CO₂, and comparable everyday figures
- Work profile — distribution of the nature of your work across projects
- Auto-registers a local MCP server so your AI agent can query stats directly ("how many tokens did I use this week?")
- Daily-recap digests with on-device semantic clustering — bundled MiniLM-L6-v2 model runs locally, no data leaves your machine
- Cost per successful task — outcome-cost per model (dollars per shipped/confirmed task, not per token), with per-task
success/partial/fail labelling right in the dashboard
- Optional backup & cross-device sync — end-to-end encrypted, via a cloud folder you already use (Dropbox, iCloud Drive, Google Drive, OneDrive); set up from the dashboard's Settings tab or the command palette, no new account and no claude-stats server
Requirements
- Node.js 22.5+ on your PATH (uses the built-in
node:sqlite module)
- Claude Code installed and used at least once — the extension reads from
~/.claude/projects/
Getting started
- Install the extension
- Click the Claude Stats icon in the activity bar, or run Claude Stats: Open Dashboard from the command palette
- Restart Claude Code so it picks up the MCP server the extension auto-registers in
~/.claude.json
That's it. The extension reads Claude Code's local JSONL session files, aggregates them into a local SQLite database at ~/.claude-stats/stats.db, and renders the dashboard on demand.
Once installed, ask your AI agent things like:
- "How many tokens have I used this week?"
- "What were my most expensive sessions today?"
- "Which projects am I spending the most on?"
- "How much CO₂ did my Claude usage cause last week?"
| Tool |
Purpose |
get_stats |
Usage summary — tokens, cost, sessions, cache efficiency, streaks |
list_sessions |
Recent sessions with token counts and estimated cost |
get_session_detail |
Messages and token usage for a specific session |
list_projects |
Per-project usage breakdown |
get_status |
Database health, session count, last collection time |
search_history |
Search prompt history by keyword |
get_cost_per_task |
Cost per successful task — outcome-cost overall and per model (read-only) |
summarize_day |
Structured daily-recap digest with semantic clustering — "what did I get done today?" |
Settings
| Setting |
Default |
Description |
claude-stats.port |
9120 |
Port for the standalone web dashboard (CLI serve command) |
claude-stats.autoRefreshSeconds |
30 |
Auto-refresh interval for the dashboard panel. 0 disables. |
claude-stats.recap.embeddings |
auto |
Semantic clustering for daily-recap. auto uses the bundled local embedding model; off falls back to lexical clustering. All inference runs on-device. |
Privacy
- Local by default. All data stays under
~/.claude-stats/; nothing leaves your machine unless you explicitly enable backup & sync — and that copy is end-to-end encrypted, so your cloud provider only ever stores opaque ciphertext.
- Incremental. Only new JSONL lines are read on each refresh.
- Non-destructive. The extension never modifies Claude Code's own files.
- No API scraping. Reads only the local JSONL files Claude Code already writes to disk.
- Embedding model bundled, not downloaded. The
MiniLM-L6-v2 int8 ONNX model used by daily-recap ships inside this extension (Apache-2.0; see media/embed-model/LICENSE and MODEL-CARD.md). It is SHA-256-verified against a pinned hash on every activation; a mismatch falls back to lexical clustering and surfaces a warning.
Issues and source
License
MIT
| |