
Beads Dashboard for VS Code
Kanban, roadmap and epic tracking for the Beads git-native issue tracker — inside your editor.


English | Tiếng Việt | 中文
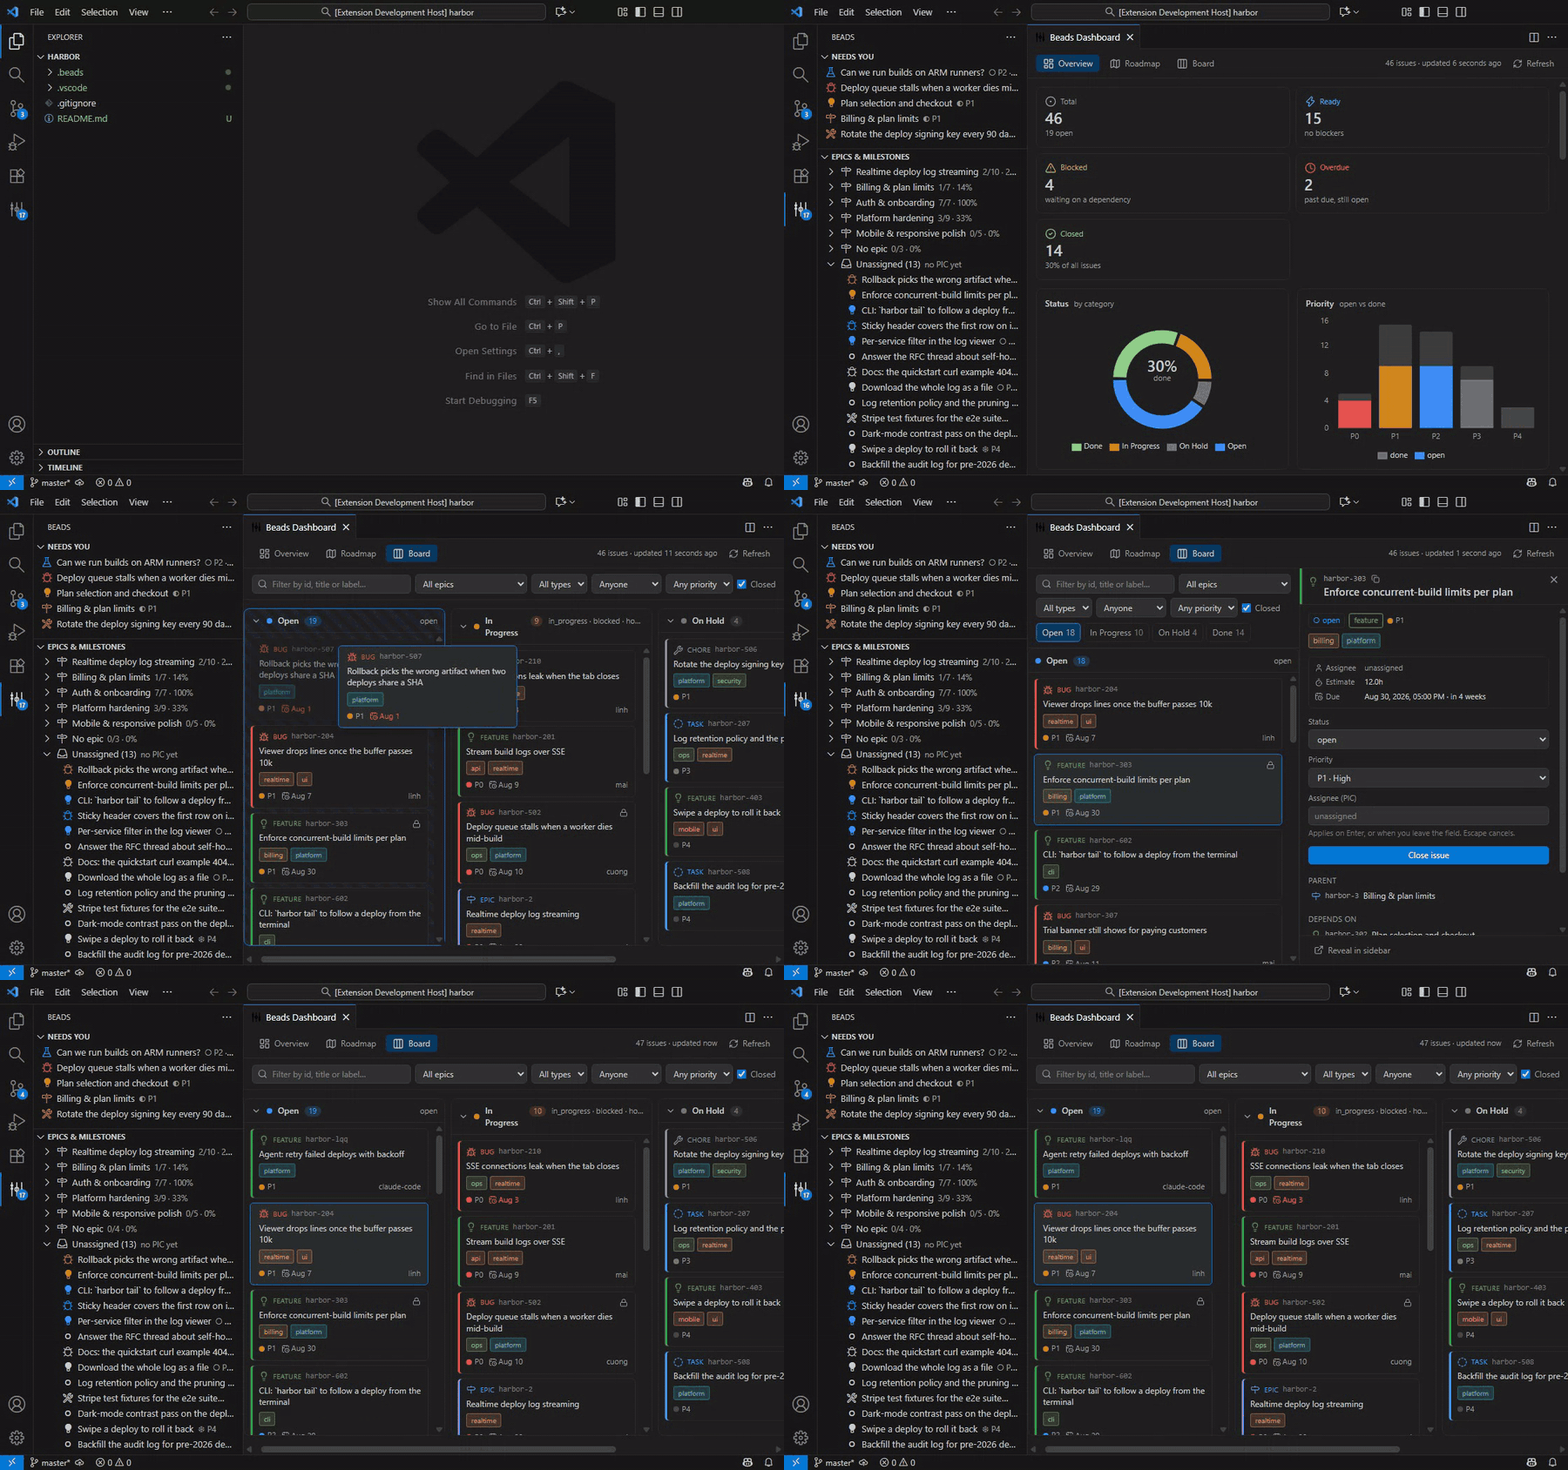
The last few seconds are the point: nothing is clicked. An agent runs bd create
and bd update outside the editor, and the board follows on its own.
What it does
Beads Dashboard reads your local beads database through the bd CLI and renders it six ways:
- Overview — totals, a status breakdown, epic progress, the two lists that matter on
arrival (what is ready to start, and what is blocked), and an on-demand Project health
drawer: press "Run checks" for stale/orphaned/lint/dependency-cycle tiles, each degrading on
its own instead of blanking the other three, with a drill-down into each check's findings.
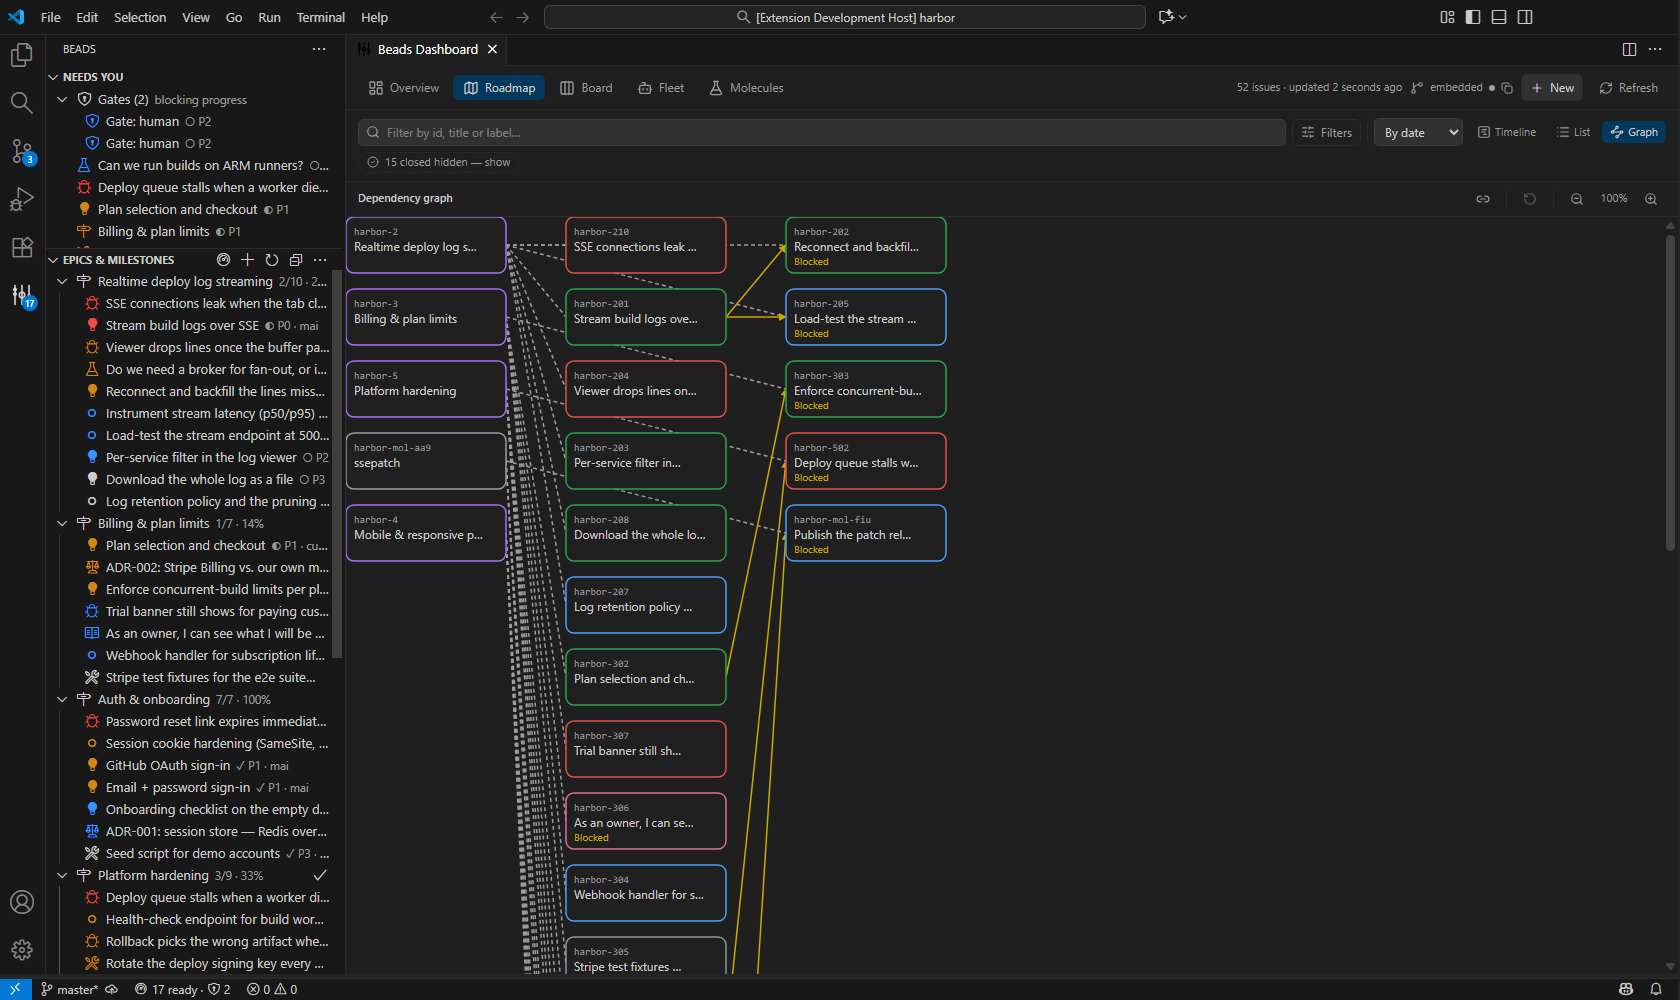
- Roadmap — Epic → Task drill-down with progress bars and per-epic counts. A shape toggle
swaps the same data into Graph view: an issue's blocked-by dependencies as a dependency
DAG, auto-laid-out, draggable node by node, and — in Link mode — click two nodes to add a
dependency edge between them (a rejected cycle surfaces as a toast, never a crash).
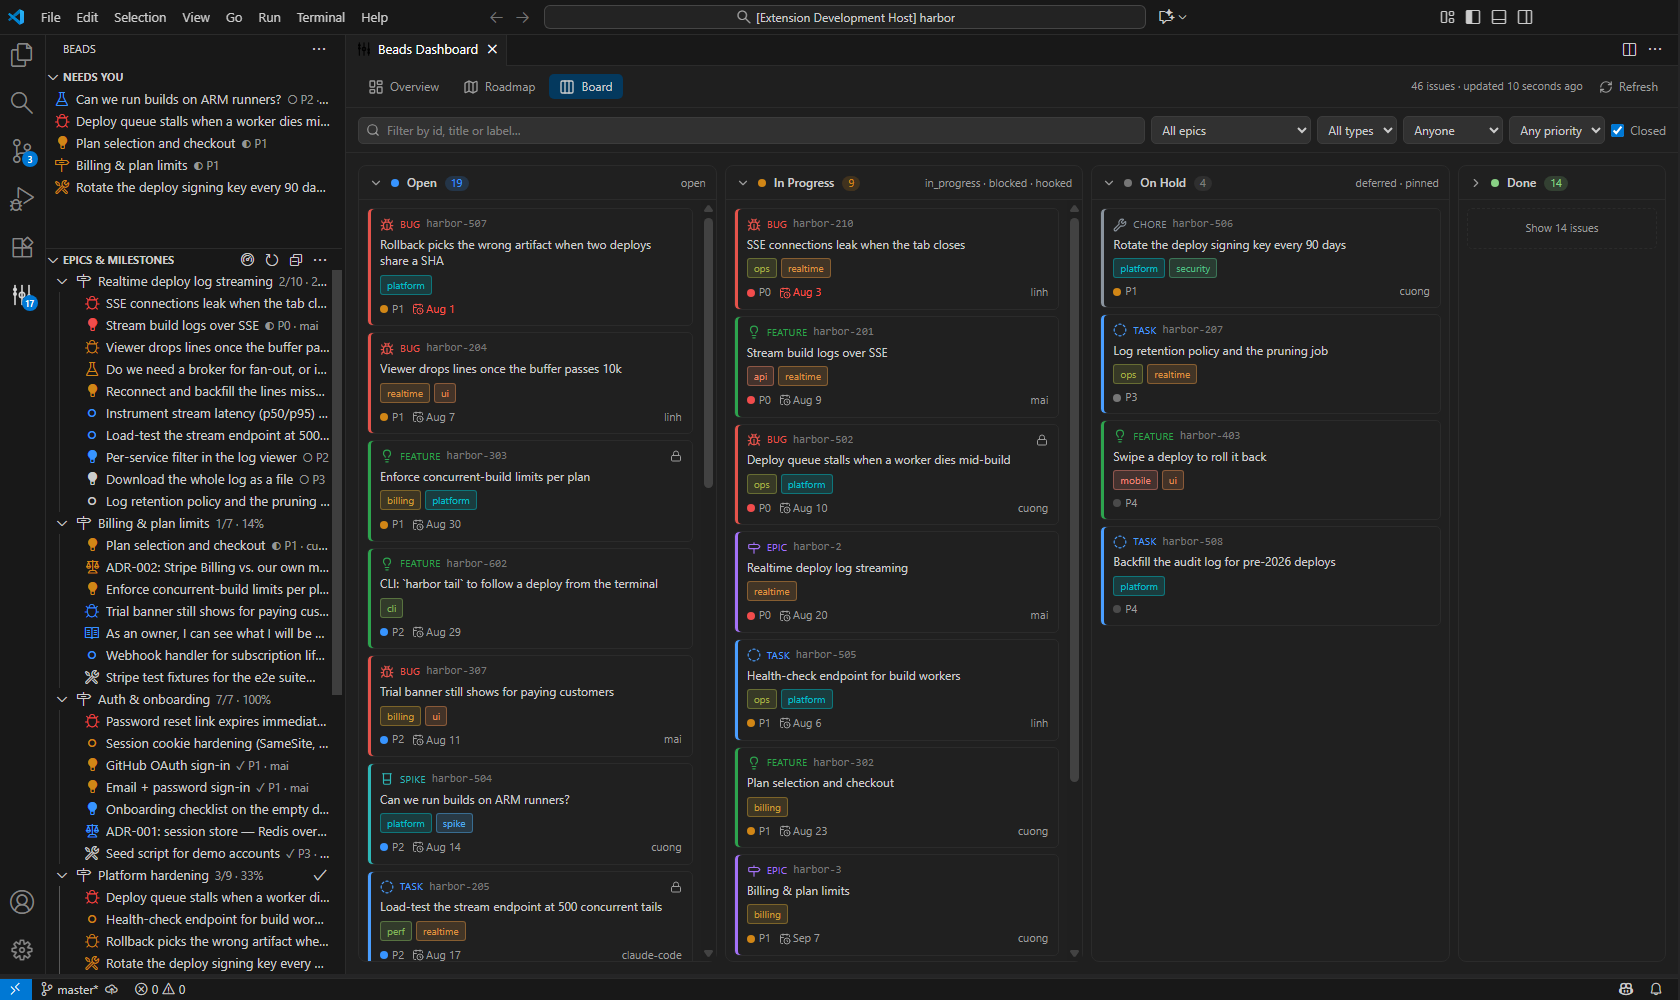
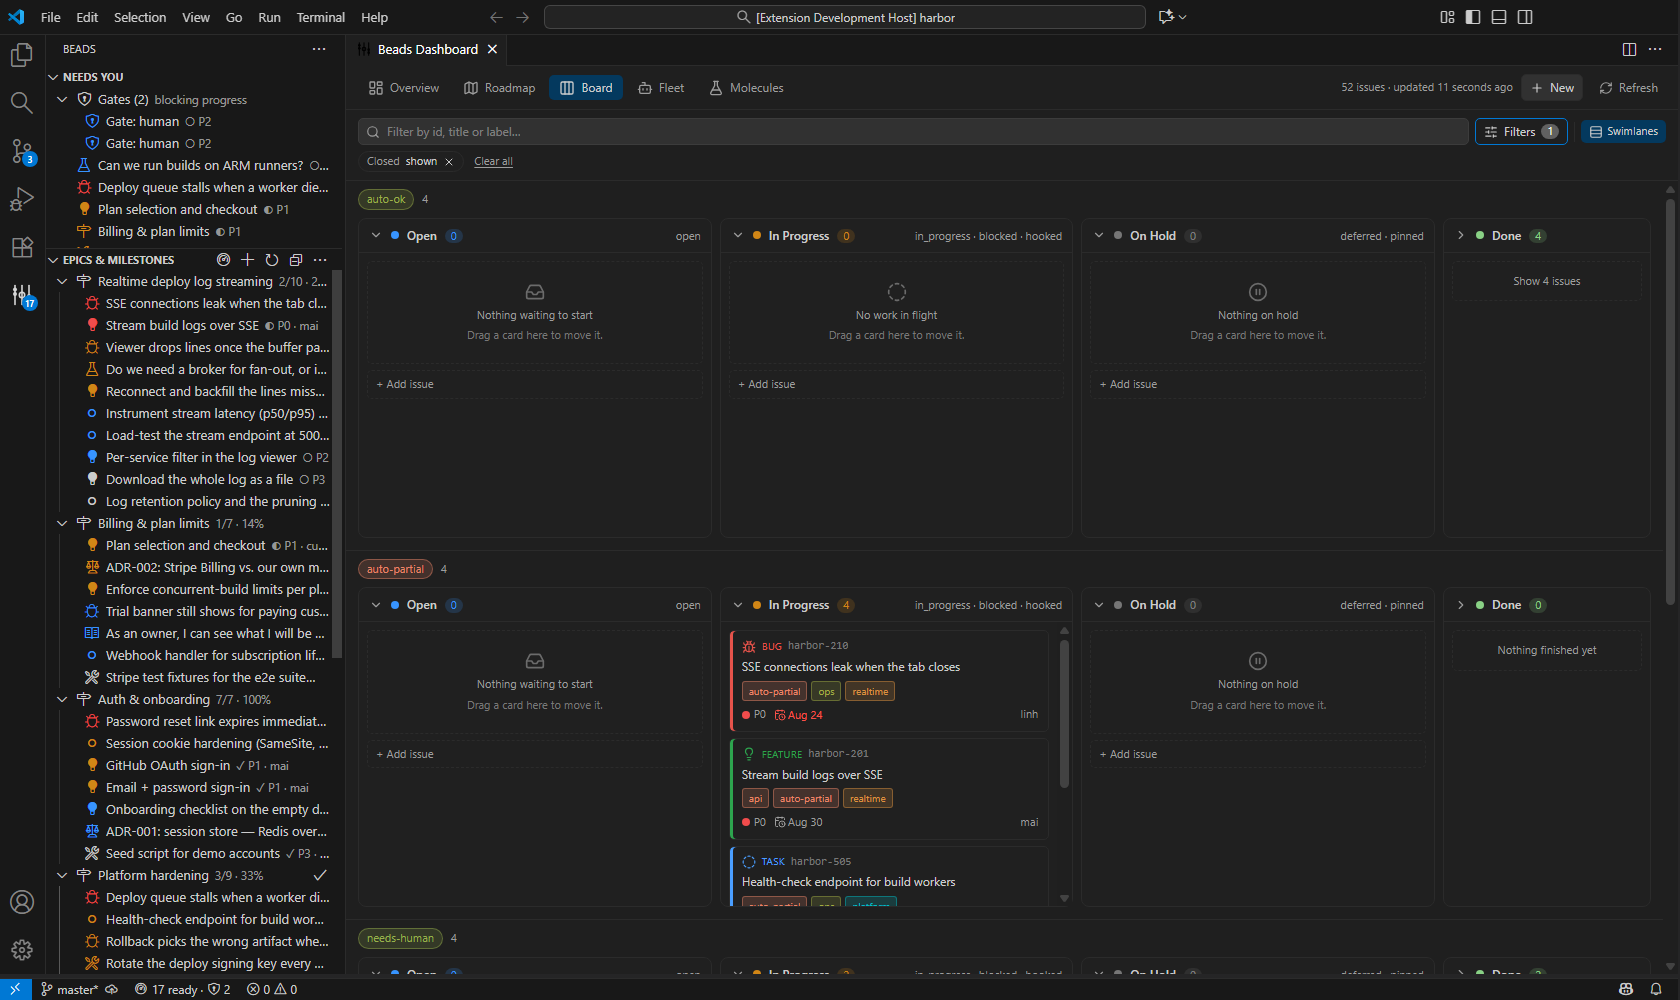
- Board — a kanban board whose columns are derived from your project's status categories at
runtime. Drag a card to change its status, toggle swimlanes to group the columns by taxonomy
label (
auto-ok / auto-partial / needs-human), or use a column's "+ Add issue" row to
create one directly in that status.
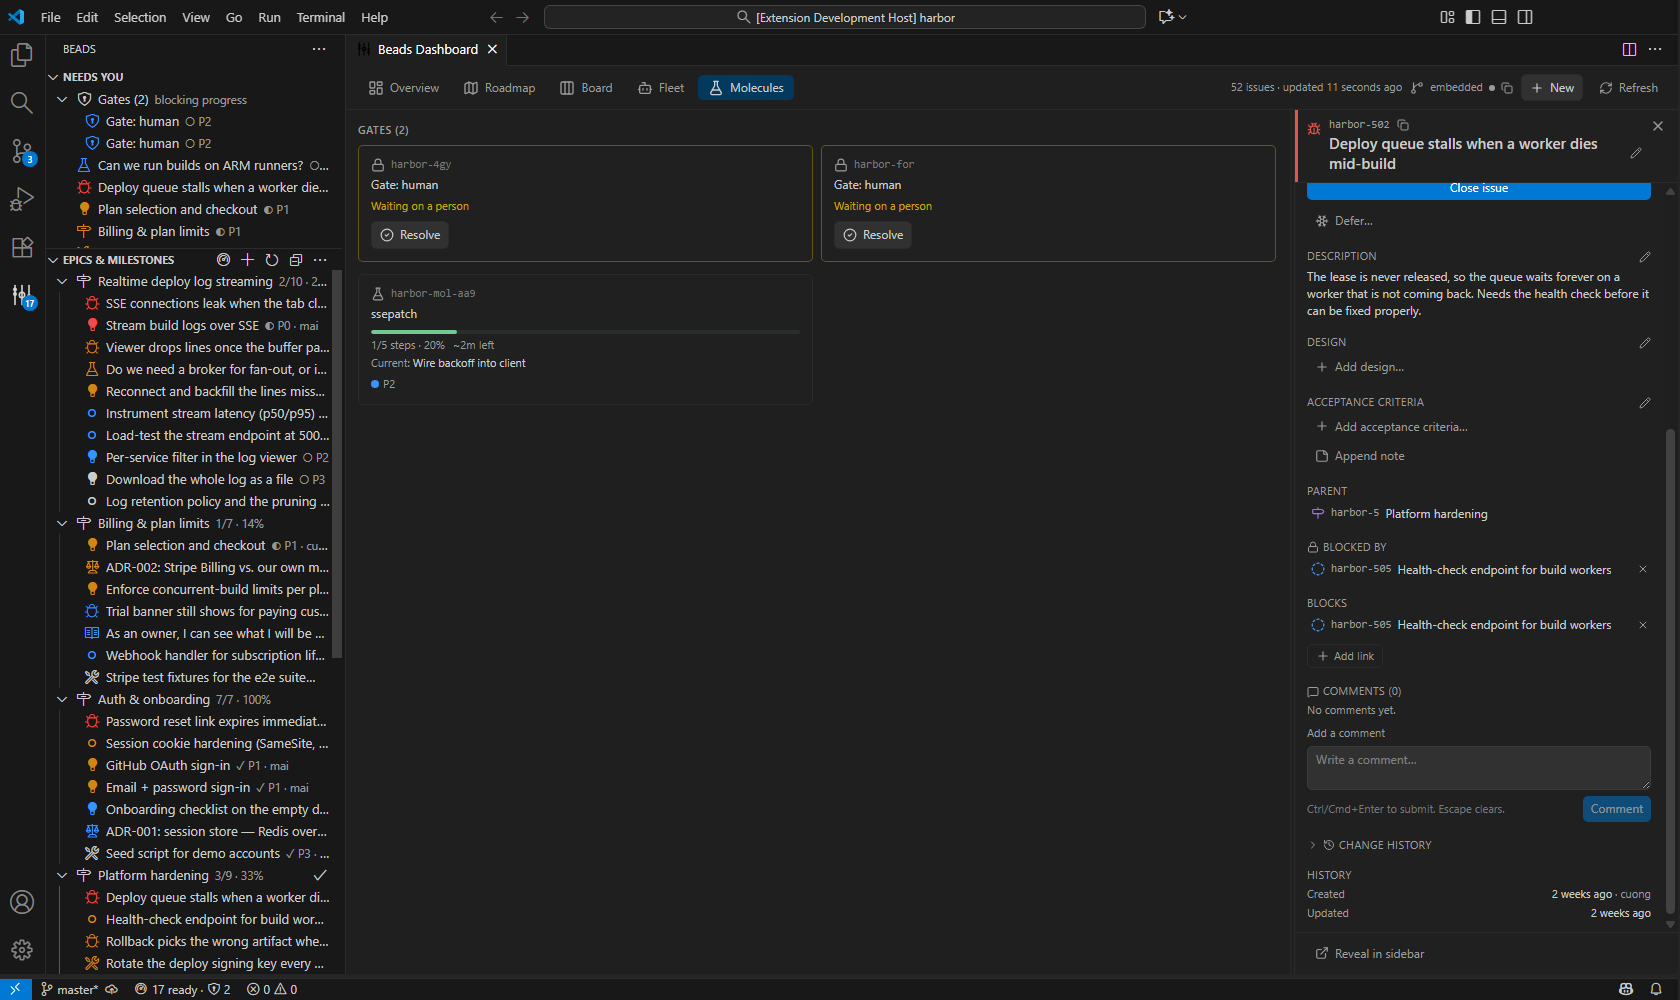
- Molecules — a viewer onto
bd mol: the running molecules as cards, a detail view with its
step list, parallel groups and gate badges, a wisp strip with a heuristic TTL countdown, and
gate cards with an inline Resolve action for gates a human can clear. View-only by design — no
pour/wisp/burn/squash/bond from the UI.
- Fleet — which Claude Code sessions are running as orchestrators/workers against this
workspace, the git worktrees they left behind, and (click a worker) its live transcript. See
Fleet monitor below.
Every issue can be created, edited and linked without leaving the editor: a Create Issue…
command (palette or the sidebar's plus-button), a full create form in the detail-pane slot, and
board quick-add all produce a real issue; the detail pane's title, description and other text
fields edit inline with a save/cancel affordance; labels add and remove as chips; dependencies
add and remove from an issue picker or from Graph link mode; and Defer / Undefer / Close /
Reopen cover the rest of an issue's lifecycle.
Plus an Epics & Tasks sidebar with a "Needs You" section — open gates alongside your assigned
issues, each with an inline Resolve action — and quick actions (status, priority, assignee, claim,
close, reopen) available from the tree, the board and the detail pane, all three converging on the
same result. A board card and a Fleet worker row both carry a lease/claim liveness badge (live /
stale heartbeat / expired) whenever bd reports lease data for a claim, and render nothing on the
common case where it does not. A detail pane also shows a blocker inspector (the full
transitive "Blocked by" chain, not just direct blockers) and a Change history timeline built by
diffing consecutive bd history commits. Once a workspace grows past beadsDashboard.issueLimit,
the board's search box falls back to a server-side bd search so issues outside the loaded window
are still findable.
A read-only sync status chip on the Overview header reports bd dolt status (mode, and
ahead/behind counts when bd provides them) and offers a "copy suggested sync command" button —
it copies the command to your clipboard and never runs bd dolt push/pull itself. An opt-in
notifications setting can toast when a gate opens ("N gate(s) need you.") or, one step further,
when an issue assigned to you becomes blocked — off by default, and each gate/issue notifies at
most once per window session.
Everything is read and written through bd --json. The extension never reads .beads/issues.jsonl
or the Dolt files directly — that export has auto-refresh off by default, and upstream declares
direct readers incompatible.
See it in action
Every shot below is a real editor against the same mid-flight demo project — five
epics, 54 issues, four people and an agent. It is generated, not curated: npm run capture:demo seeds it and re-takes every image.
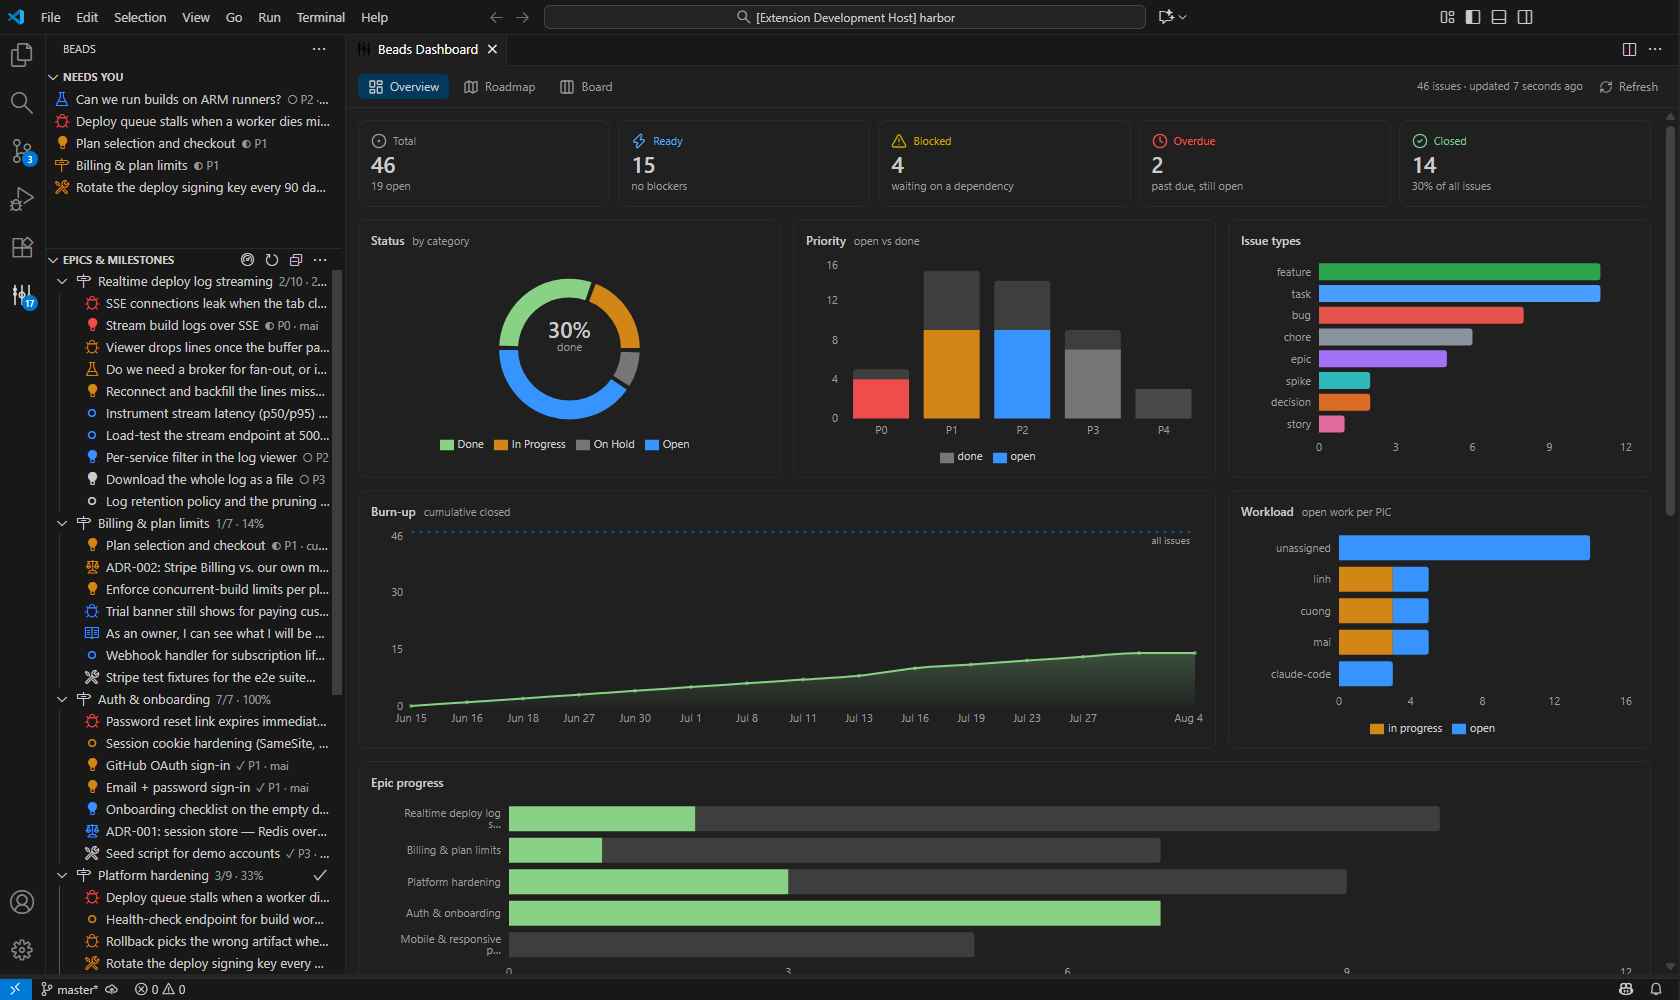
Overview — totals, status split, priority mix, workload per person, and a
burn-up of everything closed so far:
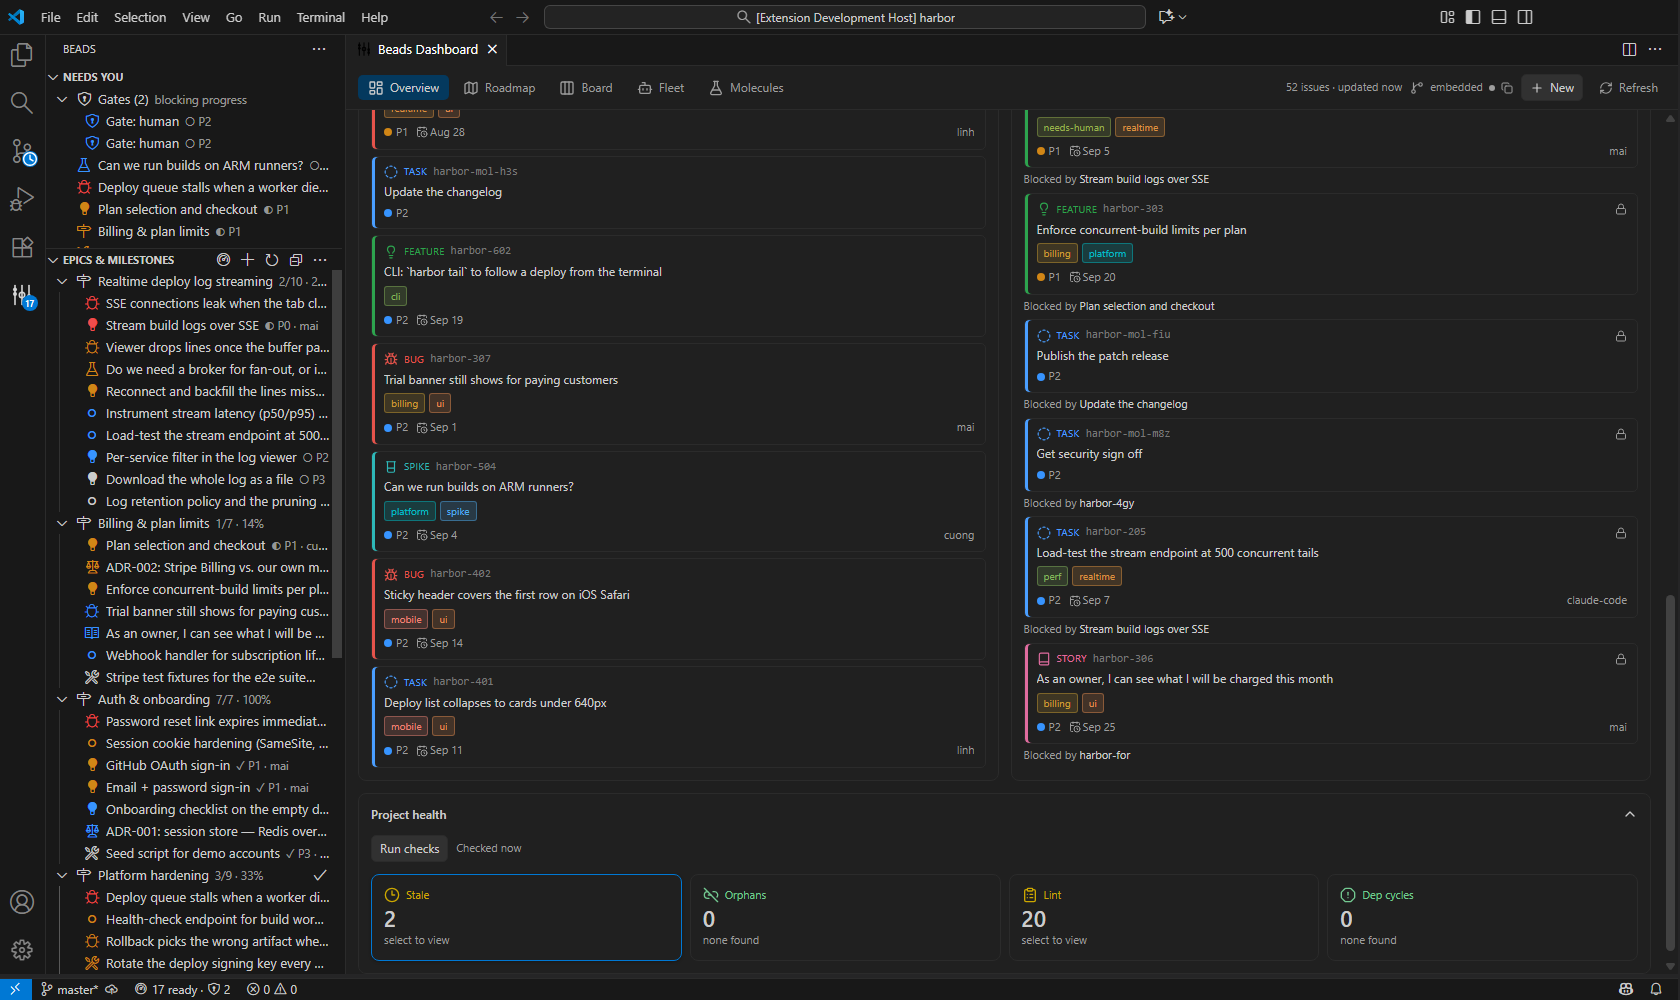
Overview, sync status and health checks — both the header's sync-status chip
and the Project health drawer fetch nothing until you act: this is the chip
right after a manual Refresh, and the drawer right after Run checks, not
either one's default empty state:
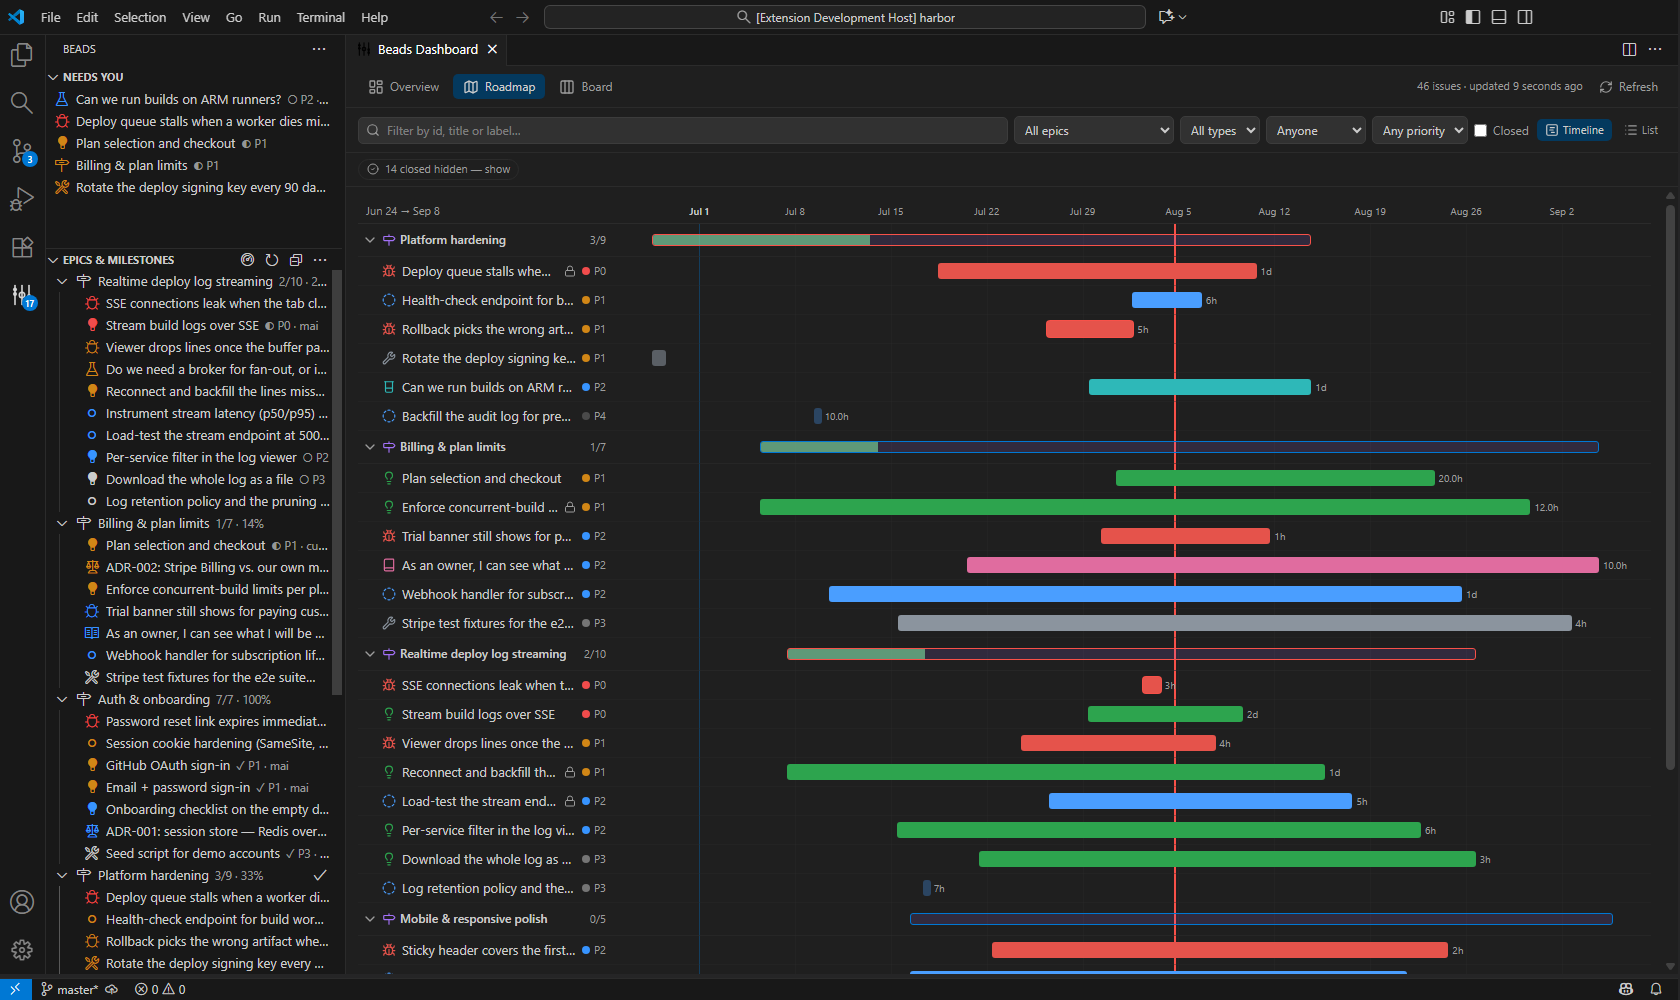
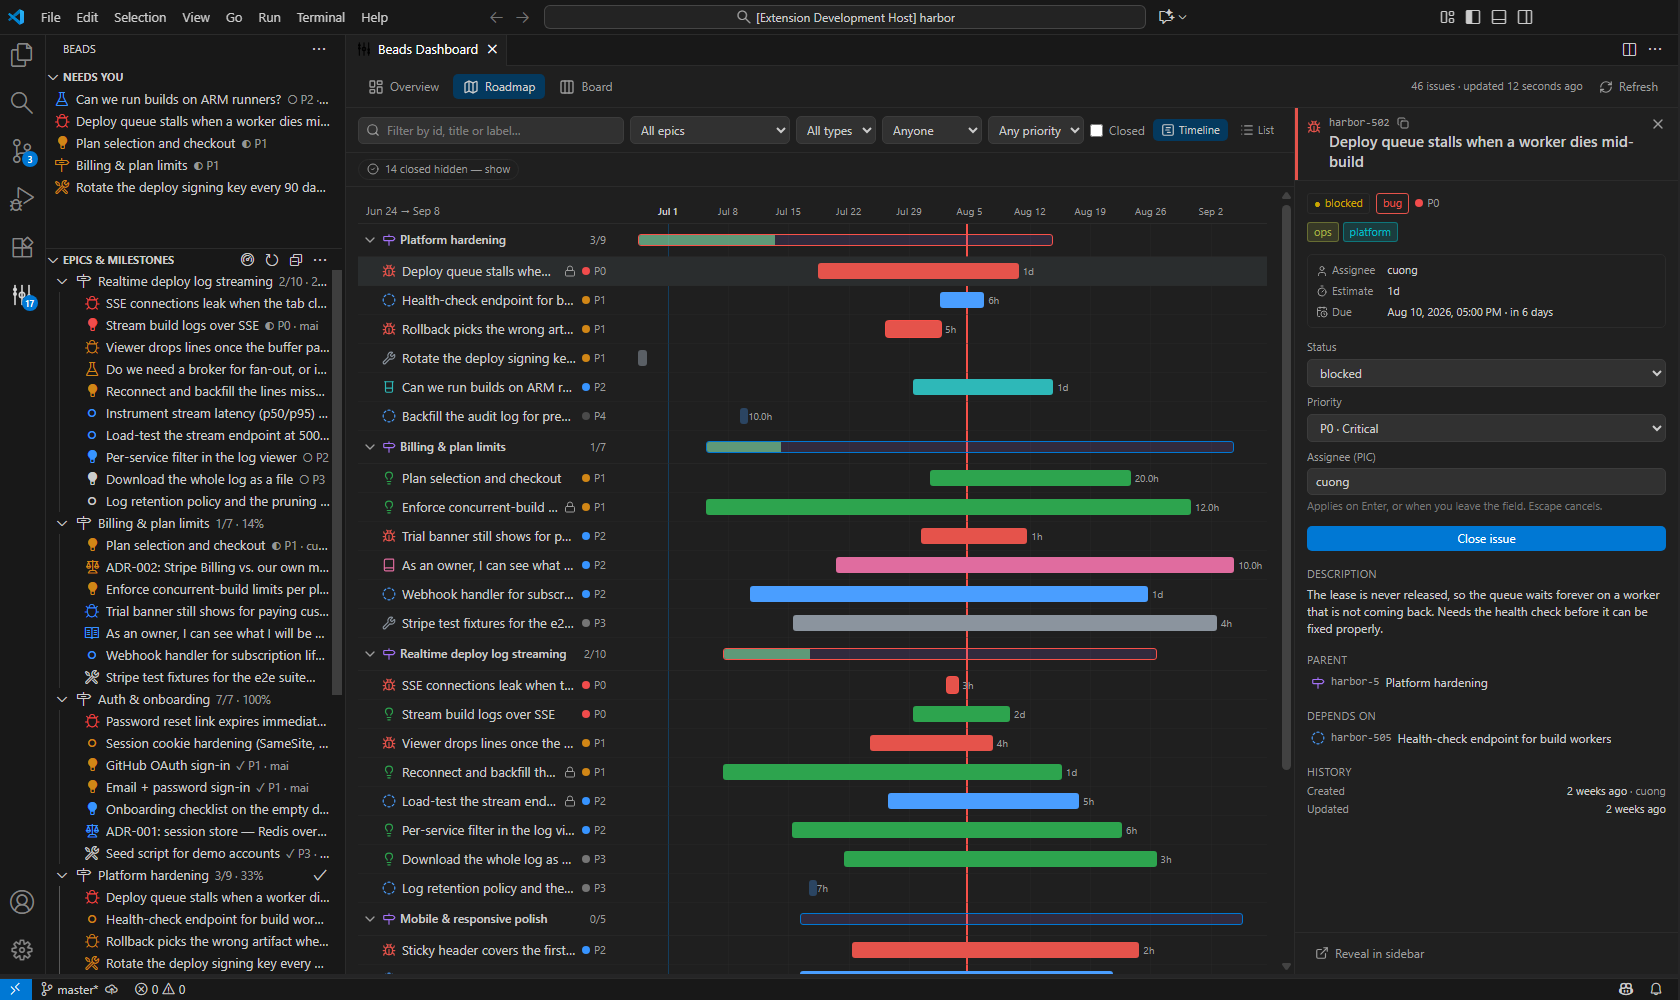
Roadmap — a real timeline with today marked, each epic carrying its own
progress count. Closed work is folded away behind a count you can click:
Board — columns derived from your status categories at runtime, so a custom
status lands in the right column. Done starts folded:
Board, swimlanes on — the same board, one toggle away from grouped by taxonomy
label instead of one long column: auto-ok, auto-partial and needs-human, four
issues apiece in this project:
Graph — an issue's blocked-by dependencies as a DAG. Nodes are dragged to a
preferred spot, nudged with the arrow keys, or sent back with Reset layout; blocked
issues are flagged red wherever they sit in the layout:
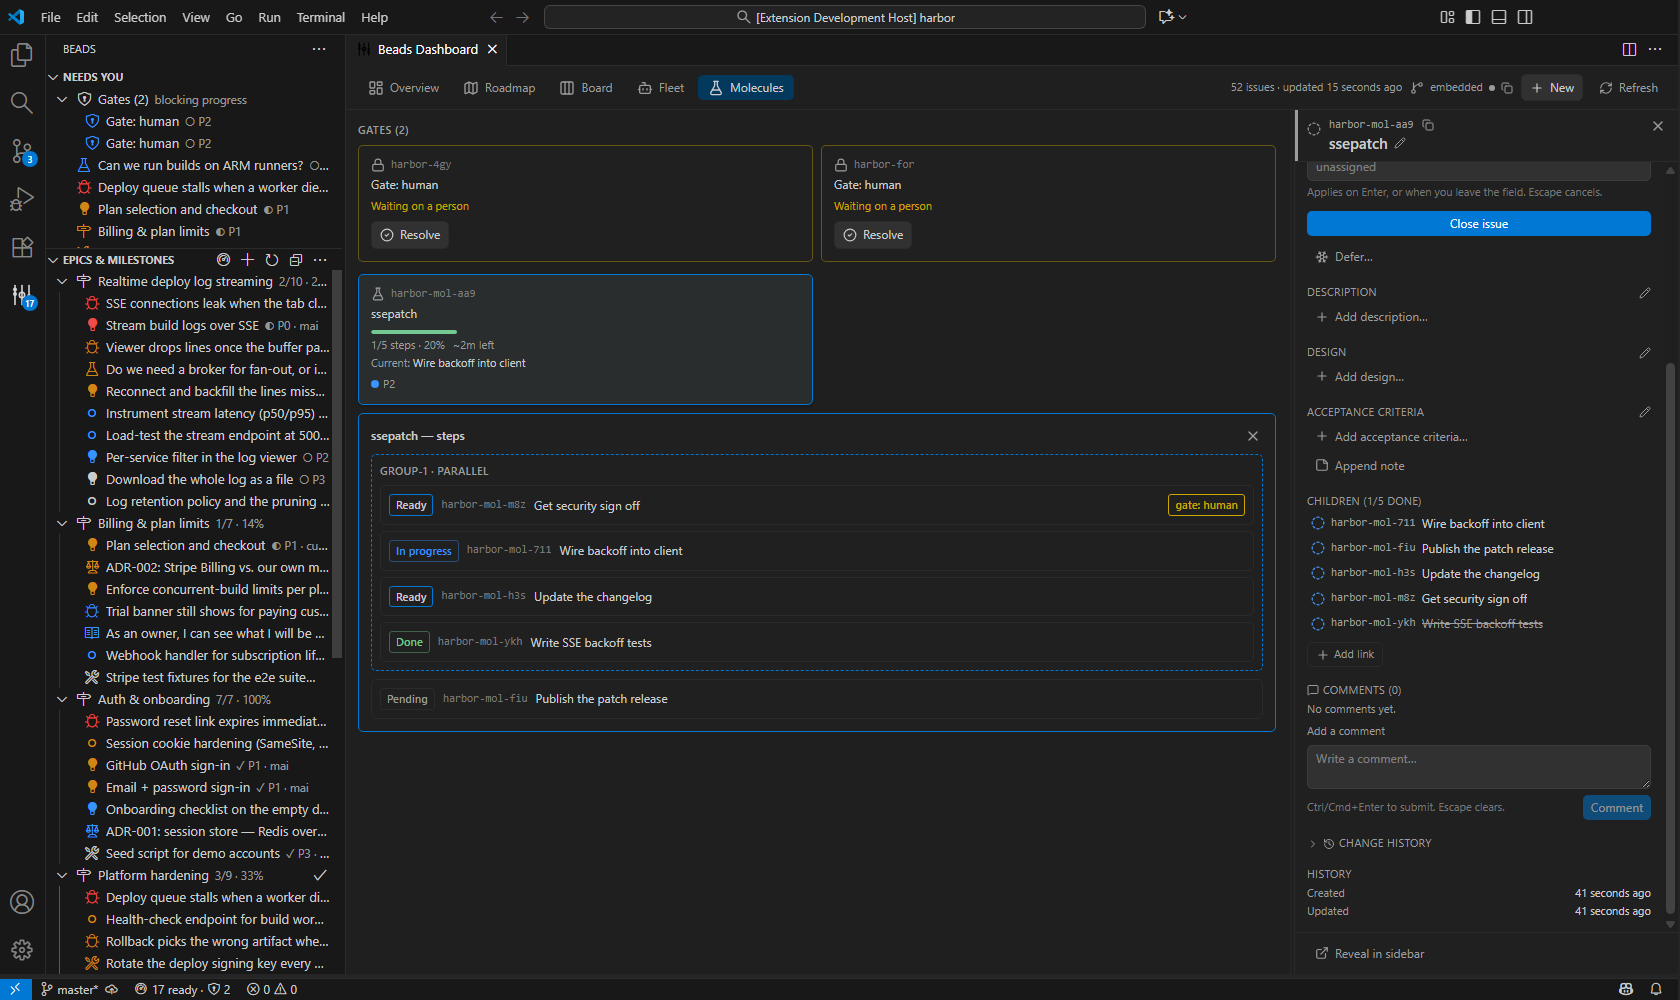
Molecules — bd mol molecules as cards with live progress, and open gates
surfaced right alongside them:
Molecules, a step list expanded — one molecule, five visually distinct step
states: done, current, ready, pending and gated:
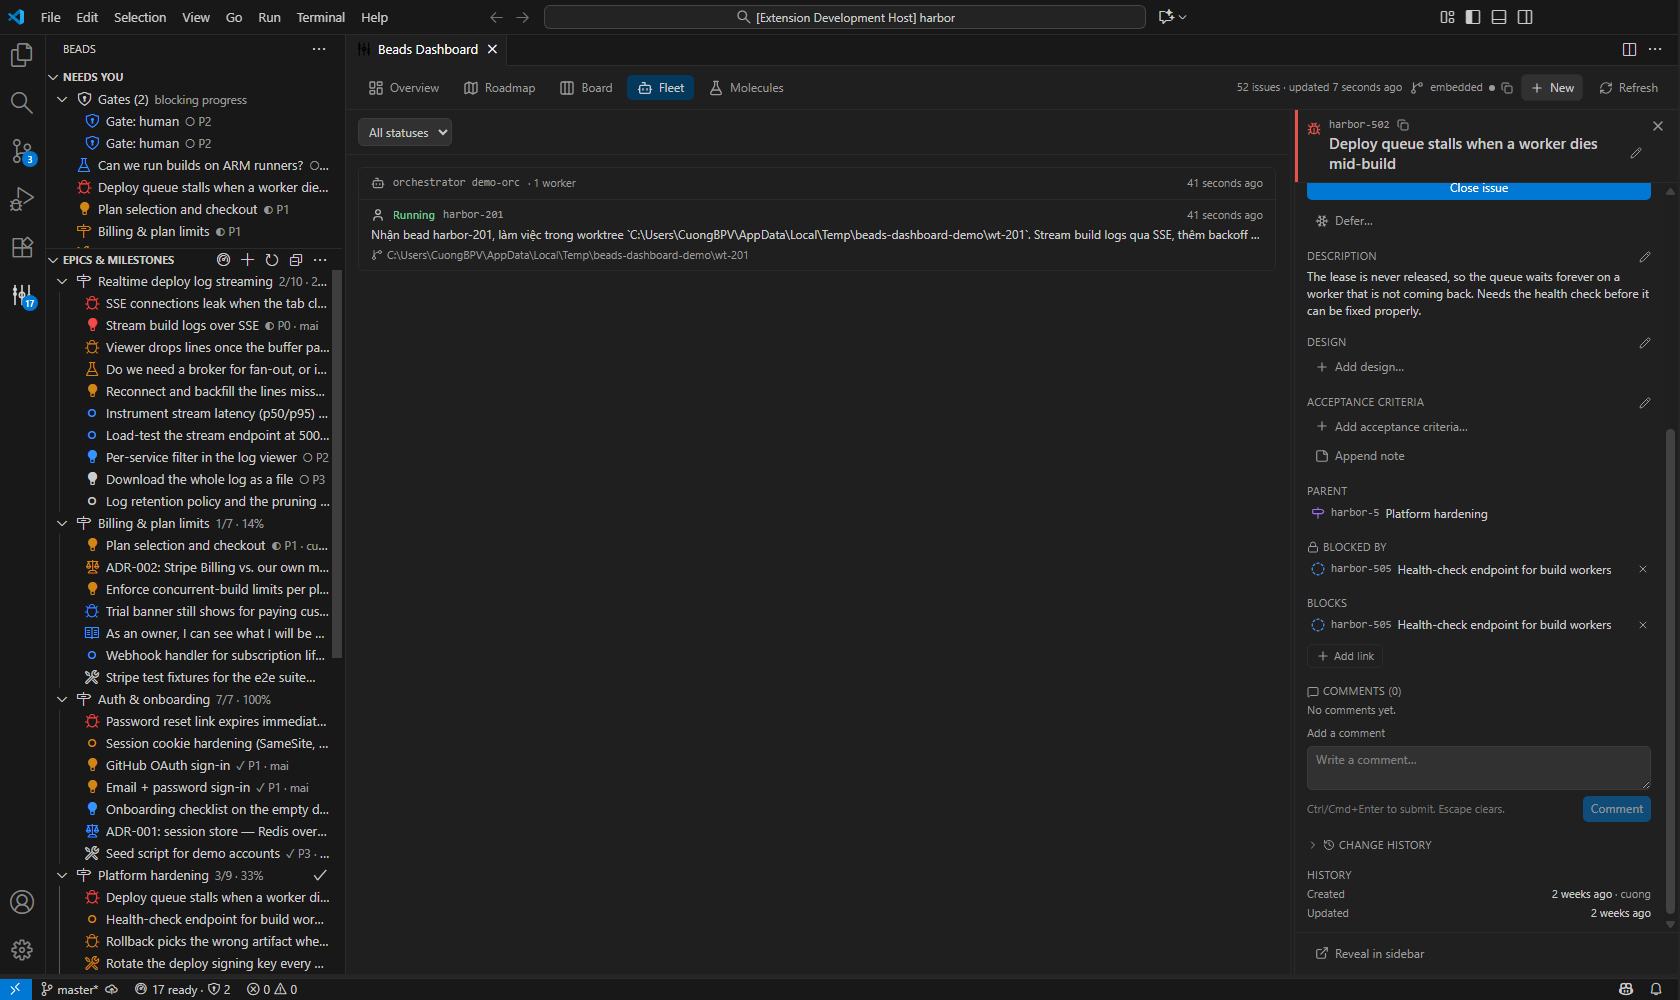
Fleet — one orchestrator, one worker running against a real wt-* git
worktree, streamed straight from the same JSONL transcript Claude Code itself
writes. See Fleet monitor below:
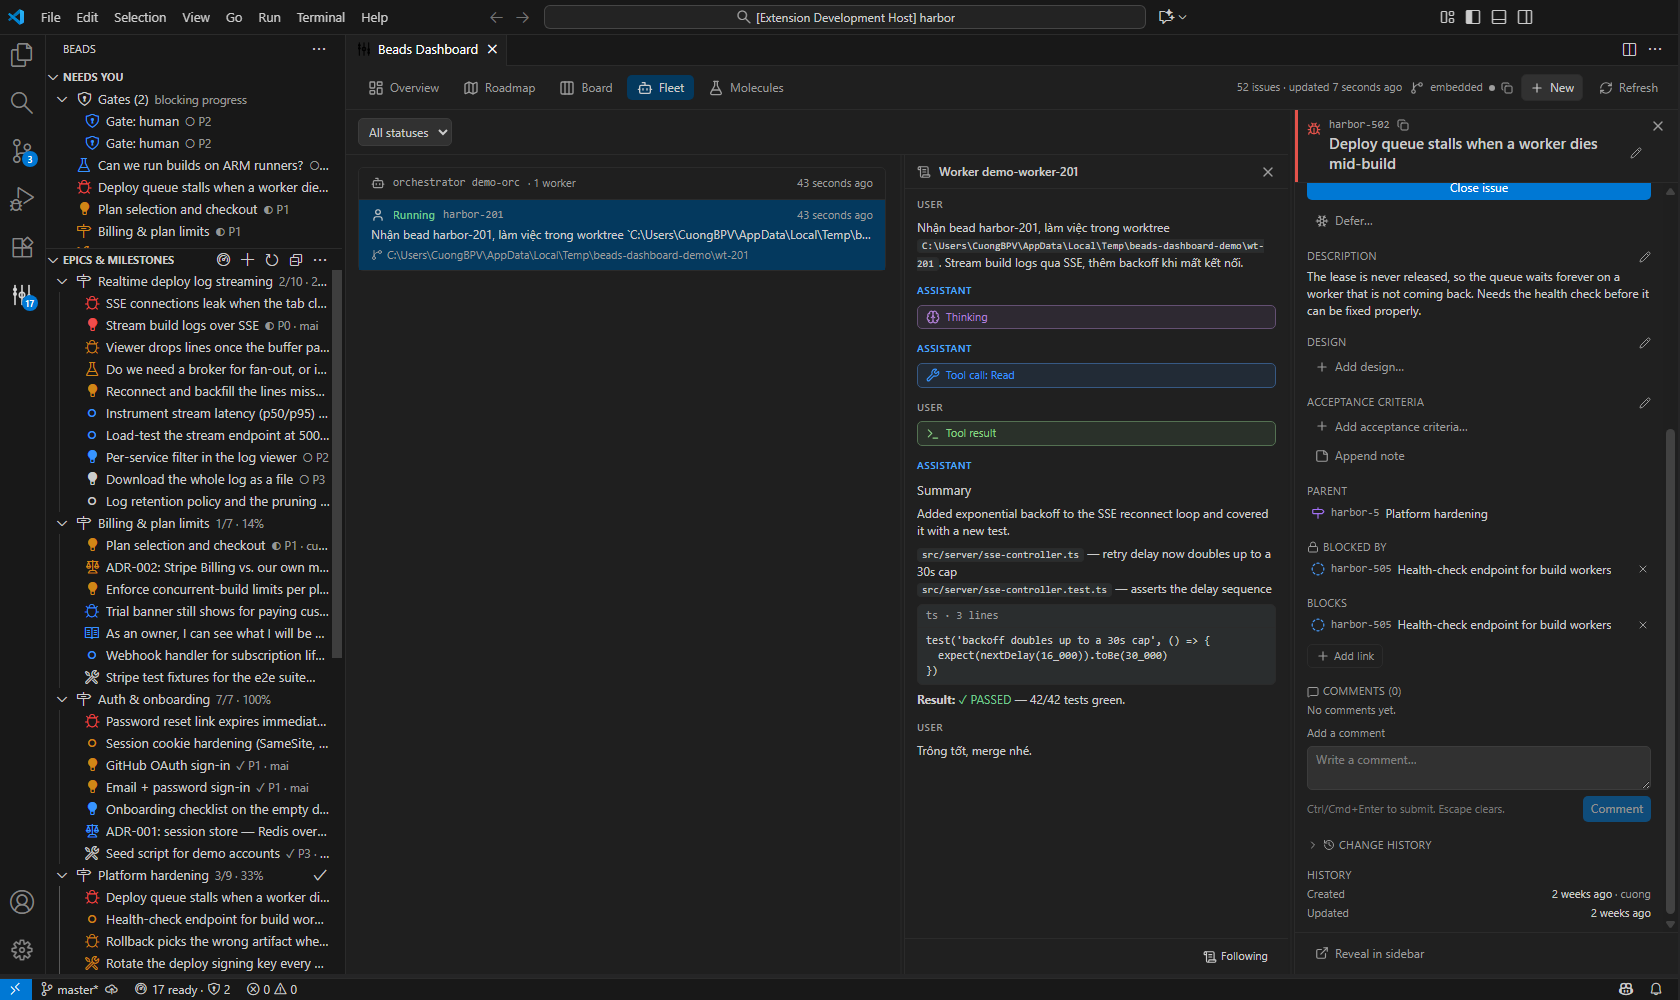
Fleet, a worker's transcript — text and thinking blocks rendered through
the hand-rolled markdown renderer: headings, bold, inline code, a fenced code
block, and a ✓ PASSED result, drawn as React elements, never
dangerouslySetInnerHTML:
Detail pane — the full issue without leaving the board. Status, priority and
assignee apply as you set them, and comments plus an append-only notes composer sit
below the fields, present even with zero comments so far:
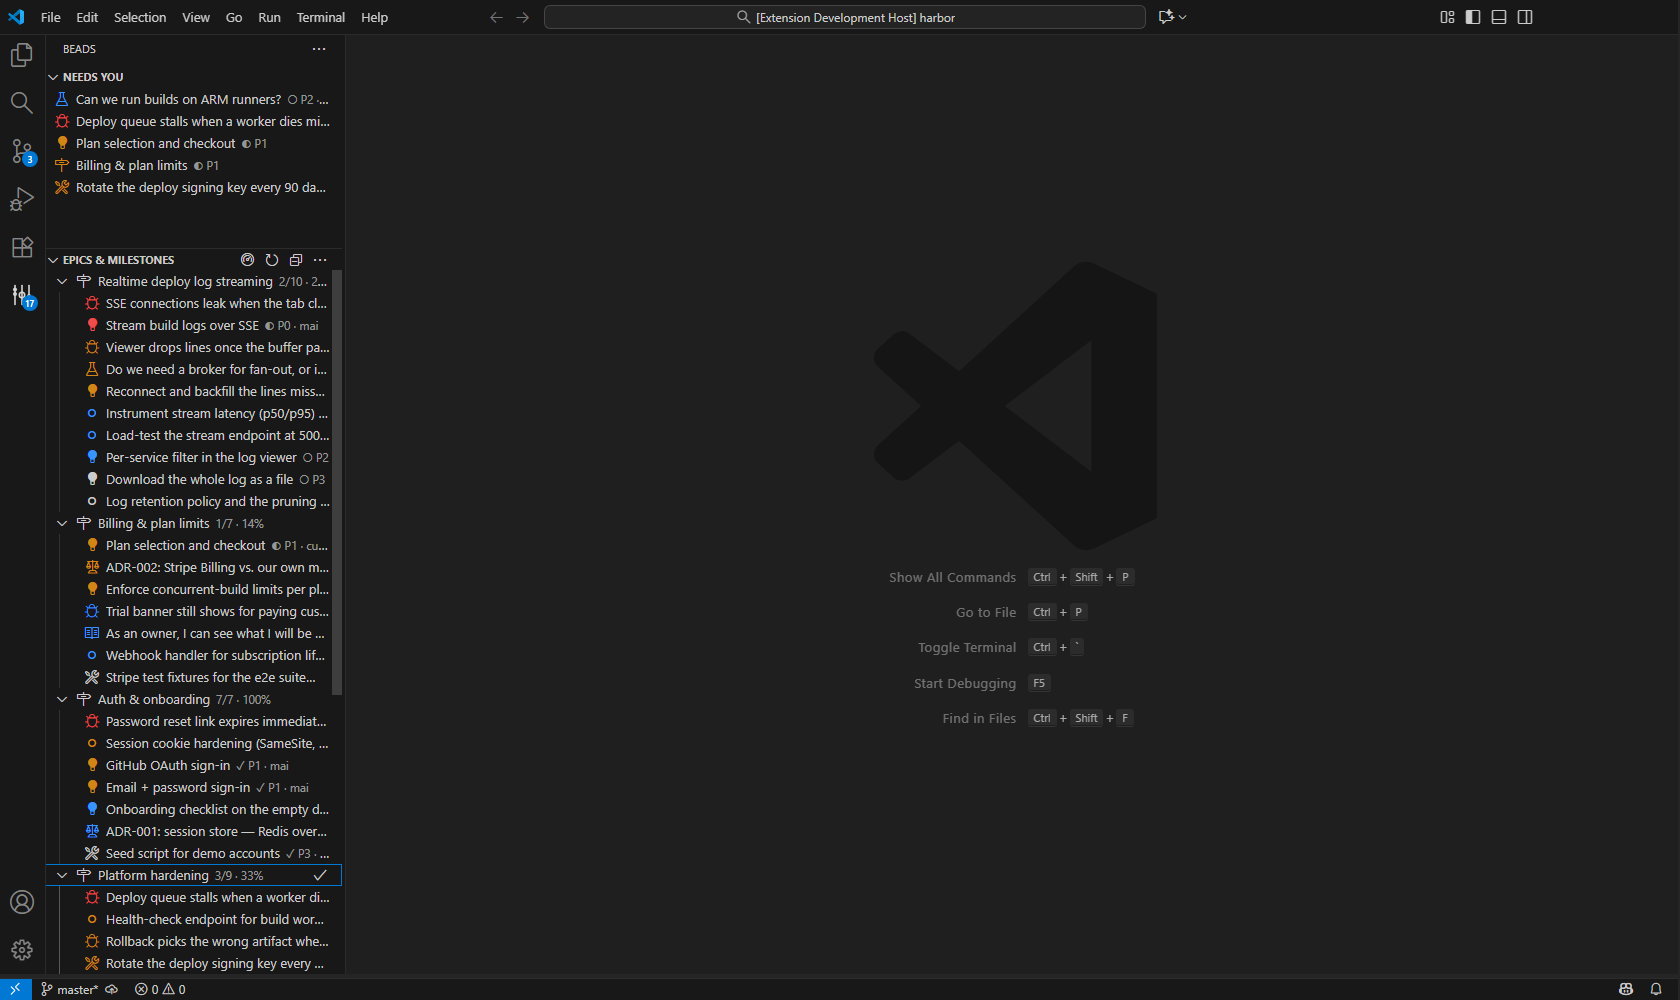
Sidebar — what needs you on top, then the plan. An open gate now outranks even
your own assigned issues, since it blocks real work until someone clears it:
Requirements
- The
bd CLI on your PATH (or set beadsDashboard.bdPath).
- A workspace folder containing a
.beads directory. The extension activates only when it finds one.
Something not behaving? docs/TROUBLESHOOTING.md covers the four degraded states the
extension handles on purpose — no workspace folder, no .beads directory, no bd on your PATH,
and a bd that runs but refuses — what each one shows, why it happens, and how to clear it.
Install
Search Beads Dashboard in the Extensions view, or:
code --install-extension cuongbphv.beads-dashboard
Using Cursor, Windsurf or VSCodium? Those cannot reach Microsoft's Marketplace, so the
same build is published to Open VSX and their own Extensions view finds it.
Every release also carries a .vsix on the
Releases page for offline install.
Build and install from source instead
npm install
npm run install:local     # build → package → install; then reload the window
install:local auto-detects code, code-insiders, cursor, windsurf or codium. Force one
with npm run install:local -- --cli cursor, or set VSCODE_CLI. To produce a .vsix without
installing it, pass -- --skip-install.
After it finishes: Ctrl+Shift+P → "Developer: Reload Window", then open the Beads icon in the
Activity Bar.
Settings
| Setting |
Default |
What it does |
beadsDashboard.bdPath |
bd |
Path to the bd executable. |
beadsDashboard.defaultTab |
overview |
Tab the dashboard opens on: overview, roadmap, board, fleet or molecules. |
beadsDashboard.issueLimit |
2000 |
Issues loaded per refresh. |
beadsDashboard.pollIntervalSeconds |
5 |
How often to check for changes made outside the editor. 0 disables it. |
beadsDashboard.showClosed |
true |
Include closed issues in the board and tree. |
beadsDashboard.assignee |
"" |
Who you are, for Needs You. Empty means the identity bd itself would use. |
beadsDashboard.notifications |
off |
Toast when a gate opens or (one step further) when your own issue becomes blocked: off, gates or gates-and-blocked. Opt-in — it only evaluates snapshots the dashboard already fetched, never spawns bd on its own. |
Changes made outside the editor — by an agent, a teammate, or your own terminal — show up on
their own within a few seconds. That check is one bd list --limit 1, and the full reload only
runs when something actually changed; nothing is checked at all while every Beads view is hidden
or the window is in the background. Set pollIntervalSeconds to 0 if you would rather the
extension spawn nothing you did not ask for.
Commands
| Command |
Where |
Beads: Open Dashboard |
Palette, view title |
Beads: Create Issue… |
Palette, view title (the tree's plus-button) |
Beads: Refresh |
Palette, view title |
Beads: Show bd Output Log |
Palette — every argv and every failure lands here |
| Change status / priority / assignee, Claim, Close, Reopen, Copy ID |
Tree context menu, detail pane |
Beads: Resolve Gate… |
Inline on a "Needs You" gate row (the Molecules tab's gate cards resolve the same way from inside the webview, not through this command) |
Fleet monitor
The Fleet tab answers "what is my agent fleet doing to this workspace right now?" — which
Claude Code sessions are running as orchestrators, which workers they spawned, which git worktrees
those workers left on disk, and whether a worktree is stale (no worker still claims it, so it is
either leftover or waiting for review). Click a worker or an orchestrator row to follow its
transcript live, streamed from the same JSONL file Claude Code itself writes. Text and thinking
render through a small hand-rolled markdown renderer — headings, lists, code fences, tables,
bold/italic, no third-party dependency — parsed to a plain-data AST and drawn as React elements
directly, never dangerouslySetInnerHTML; a transcript is an agent/tool-controlled channel, so
that renderer is the security boundary, not an afterthought.
Where the data comes from:
- Sessions and workers — read from
~/.claude/projects/<mangled-cwd>, Claude Code's own
transcript store, matched to this workspace the same way Claude Code itself does. A session
counts as an orchestrator only once it has spawned at least one worker (a subagents/agent-*.jsonl
file); an ordinary chat session is not part of the fleet.
- Worktrees and their git status —
git worktree list --porcelain, then git status /
git diff --numstat per worktree, matched to a bead id from the worker's own spawn brief. A
worktree with no worker still claiming it renders under "Stale worktrees" — the answer to
#11's original question of what a
stale worktree even means.
- Discovery cadence — a 5-second poll is the always-on baseline; a
FileSystemWatcher on
~/.claude/projects is layered on top as a fast path when the OS reports a change sooner. The
poll never goes away: a watcher is inherently best-effort (a fresh watcher can miss an event in
the moment right after it starts watching — measured, not assumed, against a real Extension
Development Host), so the worst case is exactly as fast as polling alone, never slower or silently
stuck.
- Degraded, not broken — no
~/.claude/projects on this machine, an empty one, a git that
fails, or one bad worktree all render a clear empty state or an inline error instead of a crash or
a blank panel.
Nothing here is bd data, so none of it goes through BdService — src/extension/fleet/ is a
third, deliberate place outside BdService that spawns a process (after actor.ts's read-only
git config user.name probe): every spawn here is read-only, bounded by a timeout, and a single
worktree's failure never blanks the rest of the snapshot. It is its own module rather than folded
into actor.ts or BdService because it answers a different question (what is on disk and in
Claude Code's own transcript store) than either of those — see the doc comments atop
src/extension/fleet/FleetService.ts and src/extension/fleet/worktree-git.ts for the reasoning.
Roadmap
No dates, and nothing below is a promise. What the list is for: every planned item is an open
issue, so "where would I even start?" has an answer.
Shipped — done, and in the extension today:
- Keyboard-movable cards — space picks a card up, the arrow keys move it column by column and
swimlane by swimlane, space drops it and escape puts it back. A screen reader hears the column
name rather than the droppable id. (#7)
- Fleet monitor — the worktrees and
work/bead-* branches on disk, lined up against the beads
they are carrying, so a stale one is visible, plus live transcript following per worker. See
Fleet monitor above. (#11)
- Molecule progress — a Molecules tab:
bd mol molecules as cards, a step-list detail
view, a wisp strip with a TTL countdown, and gate cards you can resolve inline — see
What it does above. (#10)
Planned — designed against the architecture that already exists:
- A workflow that runs on pull requests — nothing does today, because part of the suite drives
a real
bd binary. (#9)
- Windows, confirmed by someone on Windows — the
.cmd shim fallback and the Git-Bash paths are
written but never verified on a real box. (#12)
Exploring — a direction, not a commitment. Nothing is designed and no issue is open yet.
A human gate in beads is already a "wait for a person" primitive, which makes remote approval
possible without changing beads core: an agent fleet stops on a gate, and whoever is on the hook
sees it, reads the context, and resolves it — not necessarily at their desk. The opt-in
beadsDashboard.notifications toast (see Settings) already covers "sees it" while the
editor is open; the still-unbuilt half of this direction is resolving from outside the editor
entirely — a phone notification, a Slack message — with no desk required at all. Arguing with that
direction is useful; open an issue and say so.
Not planned: orchestrating work. This is a viewer with quick actions — it shows what bd knows
and writes back through bd. What runs next is bd's business, and that of whatever drives it.
Contributing
CONTRIBUTING.md has the setup, the three rules a PR has to respect,
and how to run each suite. The short version: npm install, npm run watch, F5 — then
npm run demo:seed for something to point the dev host at, because this repo's own .beads/ is
gitignored and cloning gets you no database.
Unclaimed work is tagged help wanted; the entries scoped to one file or one workflow are
good first issue. Bugs want the output of Beads: Show bd Output Log and your
bd --version — the issue template asks for exactly that.
Development
npm run watch        # rebuild both bundles on change
npm run verify       # lint + typecheck + test + build + npm audit
npm test             # vitest
npm run demo:seed    # build the throwaway "Harbor" demo workspace
npm run capture:demo # seed it, then refresh docs/screenshots/ from a real editor
npm run gif          # seed it, then record docs/screenshots/demo.gif
npm run preview      # render the dashboard in Chromium at 420/900/1440px
Every image in this README comes from capture:demo / gif, never from a hand-posed editor.
The demo project is a fixture in scripts/lib/demo-project.mjs,
seeded through bd import into a throwaway workspace in your temp directory — the extension's own
tracker is nearly all closed, and screenshots taken against it make a live tool look finished. The
unit suite asserts the fixture stays mid-flight rather than drifting back into a graveyard.
These, capture and preview all drive live bd --json output, so they need the bd CLI
locally. That is why they do not run in CI. gif also needs ffmpeg on your PATH.
Releasing
Tag a commit and push it — .github/workflows/release.yml builds the
.vsix, attaches it to a GitHub Release, then publishes that exact file to the VS Code Marketplace
and to Open VSX. The tag must match version in package.json or the workflow fails before
building.
npm run verify       # the workflow cannot run the bd-backed tests; do it here
git tag v0.1.0
git push origin v0.1.0
Publishing needs two repository secrets. Each publish step is skipped with a warning when its token
is missing, so a fork still gets a working .vsix release:
| Secret |
Where it comes from |
VSCE_PAT |
An Azure DevOps PAT with the Marketplace: Manage scope. The publisher in package.json must exist first at Manage Publishers. |
OVSX_PAT |
An Open VSX access token. Create the namespace once with npx ovsx create-namespace cuongbphv -p <token>. |
The call chain is one-directional, and no layer may be skipped:
view → hook → bridge/rpc.ts → [postMessage] → panel router → bd/queries|mutations → BdService → bd
src/extension/   Extension host — the only place that spawns bd or imports `vscode`
  bd/            BdService (spawn), queries (reads), mutations (writes)
  panel/         DashboardPanel (CSP + nonce) and the RPC router
  tree/          Epic → Task sidebar
src/shared/      Framework-free: types, RPC protocol, and the model derivations
src/webview/     React UI. Never touches child_process, fs, or the network
  bridge/rpc.ts  The single caller of acquireVsCodeApi()
media/           Extension icon and activity-bar glyph
src/shared/ is the only code both sides import, so "what counts as done" means the same thing in
the sidebar and on the board.
Design system
Design decisions are not ad-hoc — read design-system/MASTER.md before
touching UI code. The rules that most often get violated:
- No remote fonts or CDN assets. The webview CSP blocks external hosts; use
var(--vscode-font-family).
- No hardcoded hex colors. The user's theme is the source of truth; map to
--vscode-*.
- Container queries, not media queries. A panel can be 400px wide in a 2560px window.
- Card content budget — a card shows exactly four things: id, truncated title, type icon,
priority dot. Status is the column it sits in, not a badge.
- Never color alone for status or priority — always color plus icon or text.
- Icons from
lucide-react only. No emoji as icons.
Tech stack
VS Code Extension API · TypeScript 6 · React 19 · Tailwind CSS 4 (CSS-first @theme) · dnd-kit ·
lucide-react · esbuild (dual bundle) · vitest
- Beads CLI — the git-native issue tracker this UI wraps
License
MIT — see LICENSE. Copyright (c) 2026 Bùi Phan Viết Cường.

