XDC for VS Code
Debug z/OS programs from the comfort of Visual Studio Code. XDC brings Cole
Software's Z/XDC to VS Code, letting you attach to live debug sessions on the mainframe and step through HLASM applications with a modern, source-aware UI.
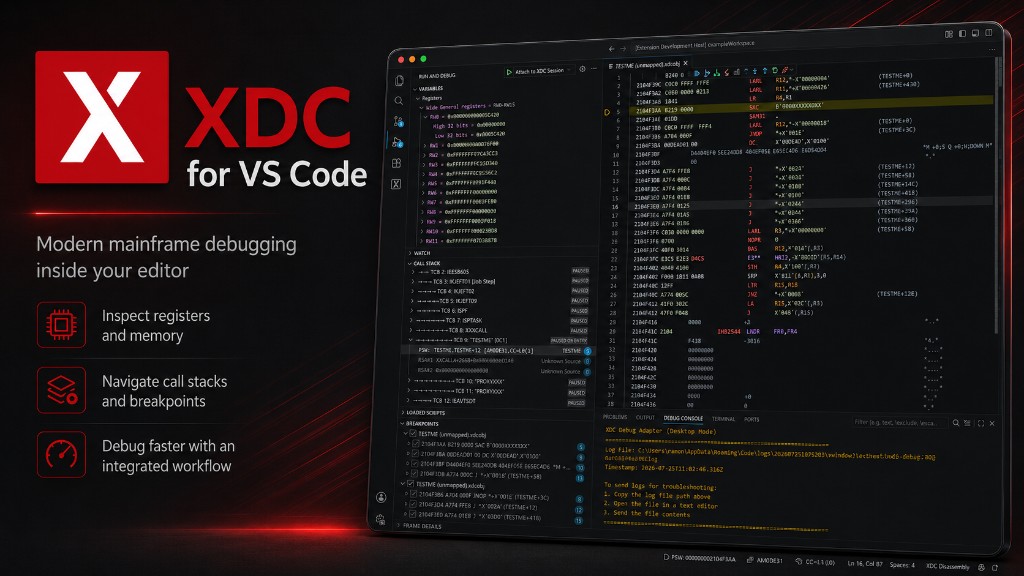
With XDC you can:
- Attach to a live cdf/XDC debug session on z/OS from the VS Code debugger.
- Set breakpoints and step through HLASM programs using the standard VS Code debugging experience.
- Resolve running code back to real source through ADATA and SYMDATA, with syntax highlighting for assembler, symbol and disassembly.
- Inspect general, control, access, floating-point and vector register sets, plus the PSW, save areas, and subpool storage.
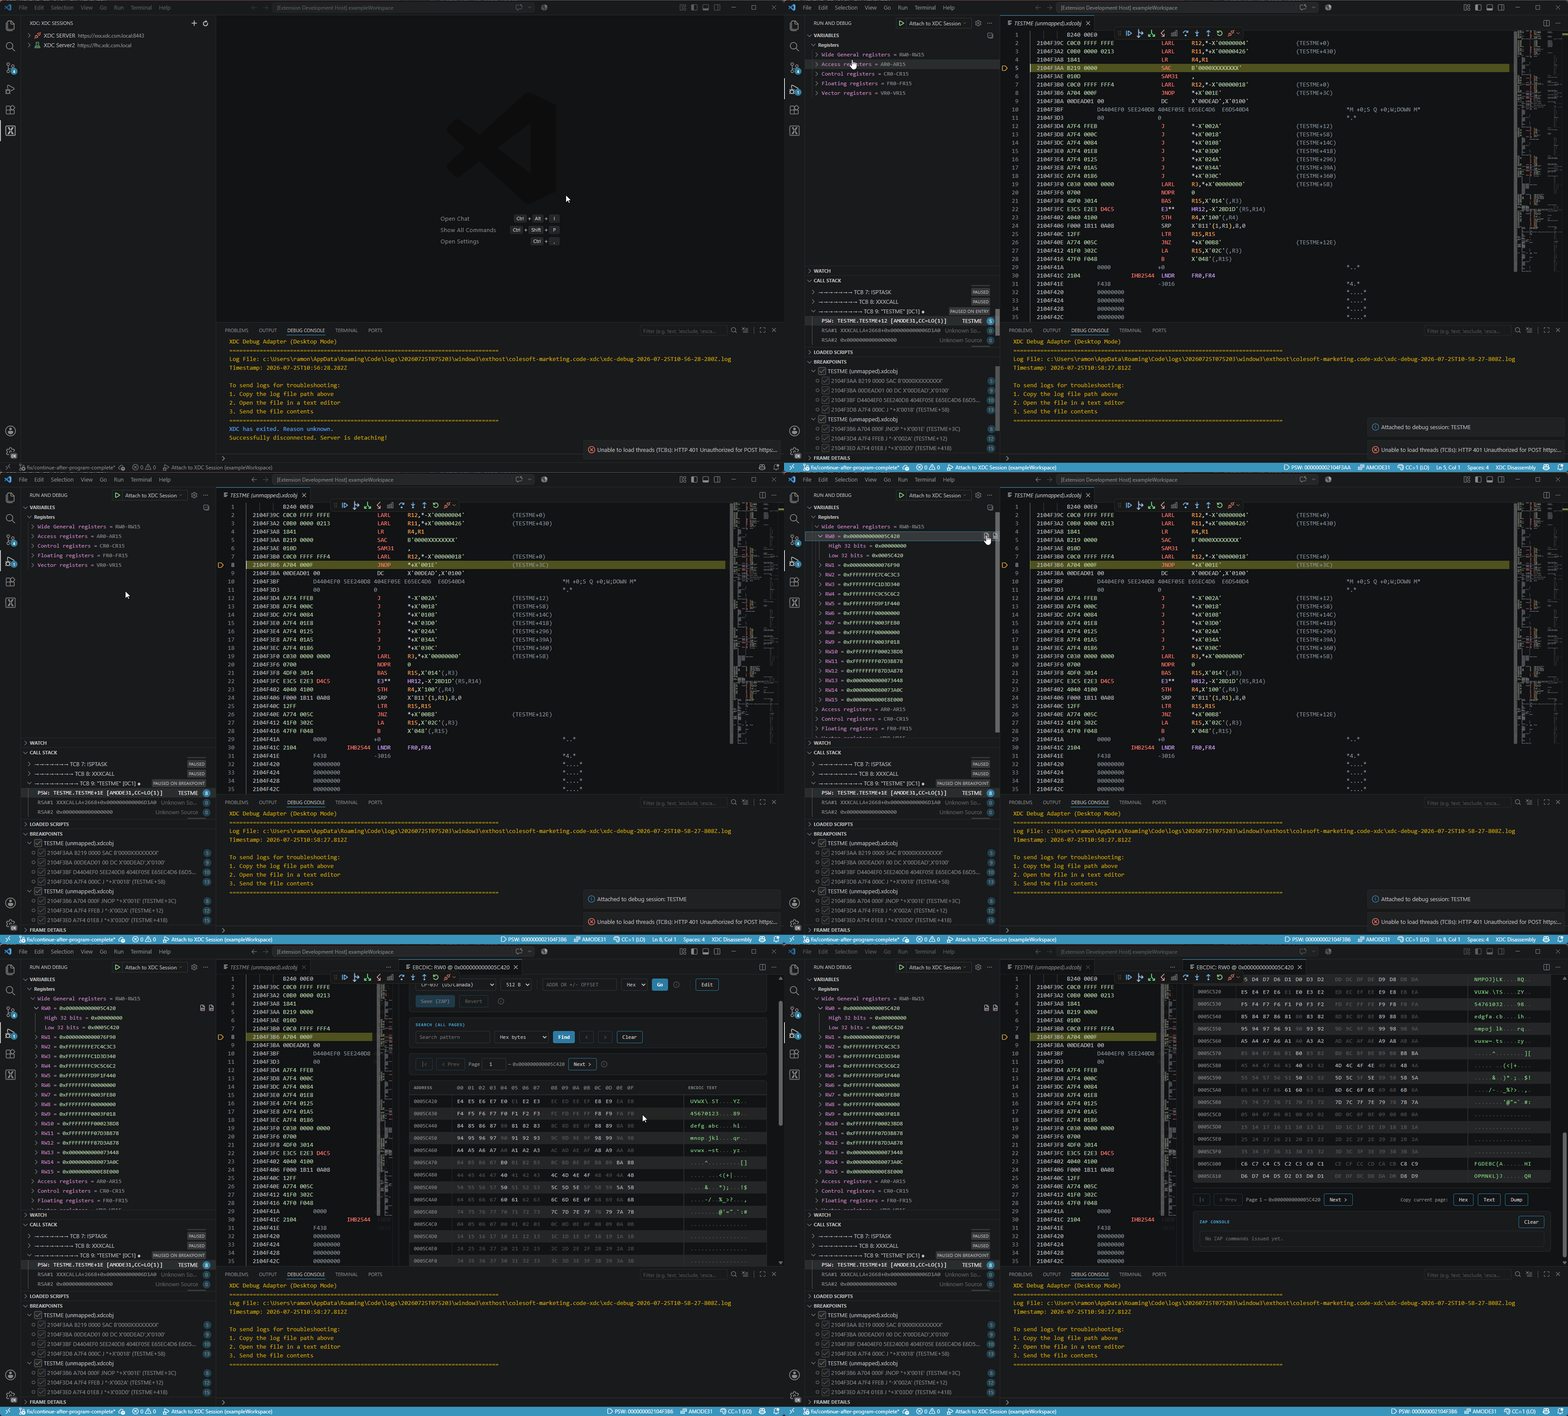
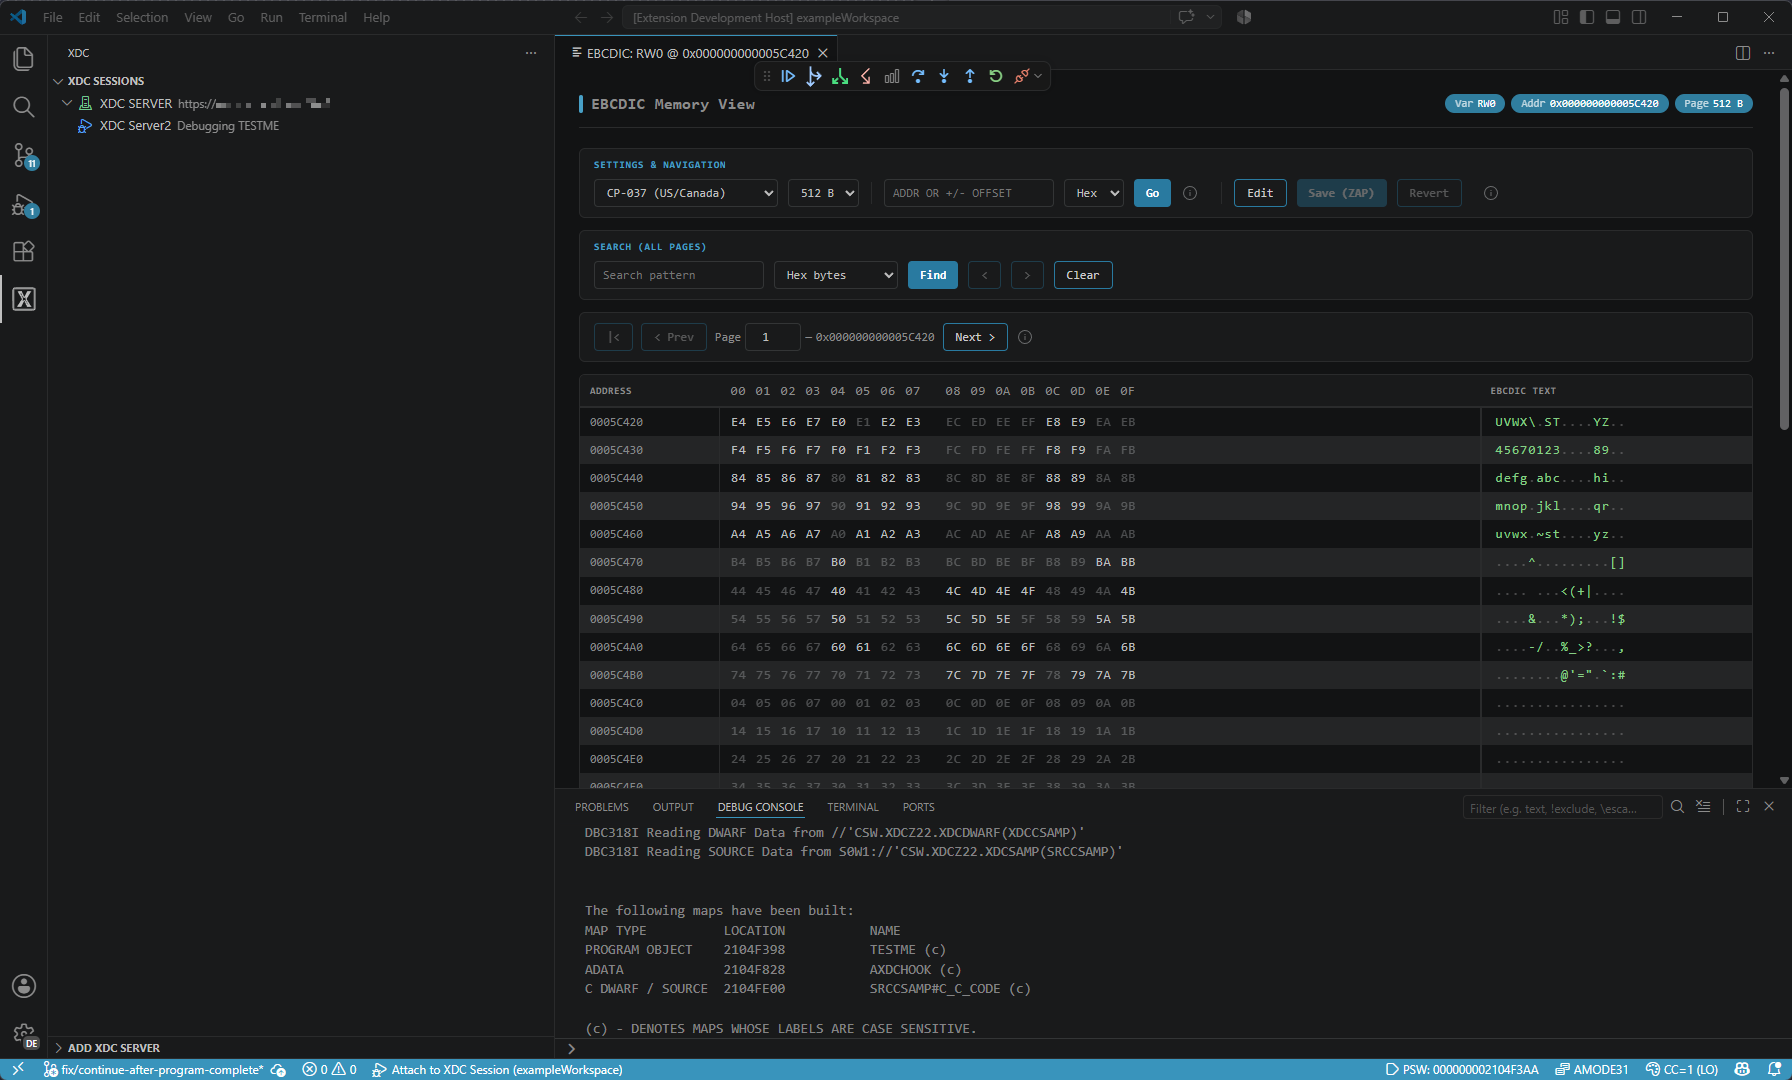
- Display storage in a formatted hex/EBCDIC viewer.
⚠️ Preview. This extension is under active development. Features and behavior may change between releases.
Features
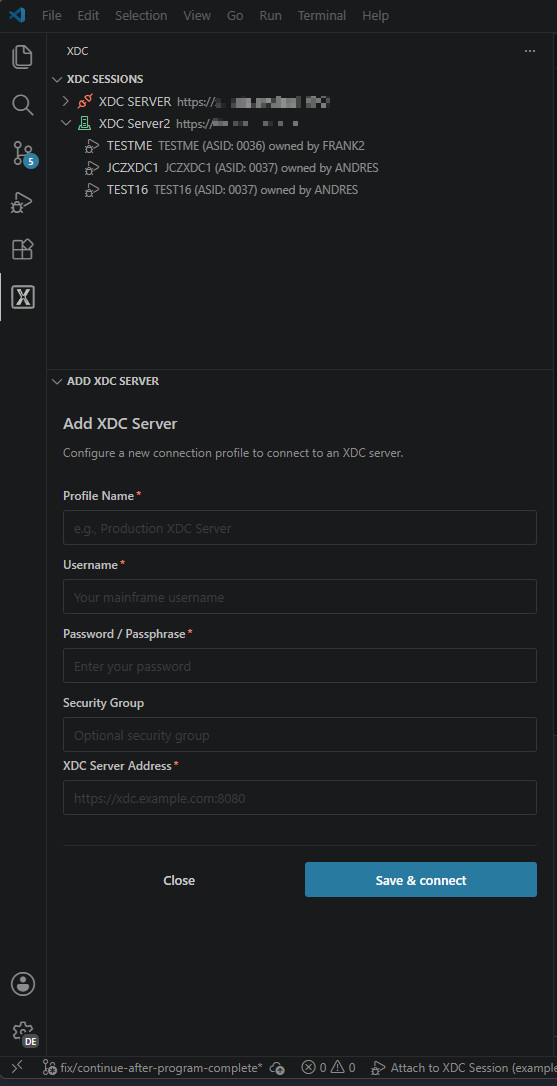
Connect to Z/XDC servers
Manage one or more Z/XDC GUI Server connection profiles and browse their active
debug sessions from a dedicated XDC view in the Activity Bar. Profiles store
your host, port, and username and passwords locally and are handled securely and never synced.
Attach to live debug sessions
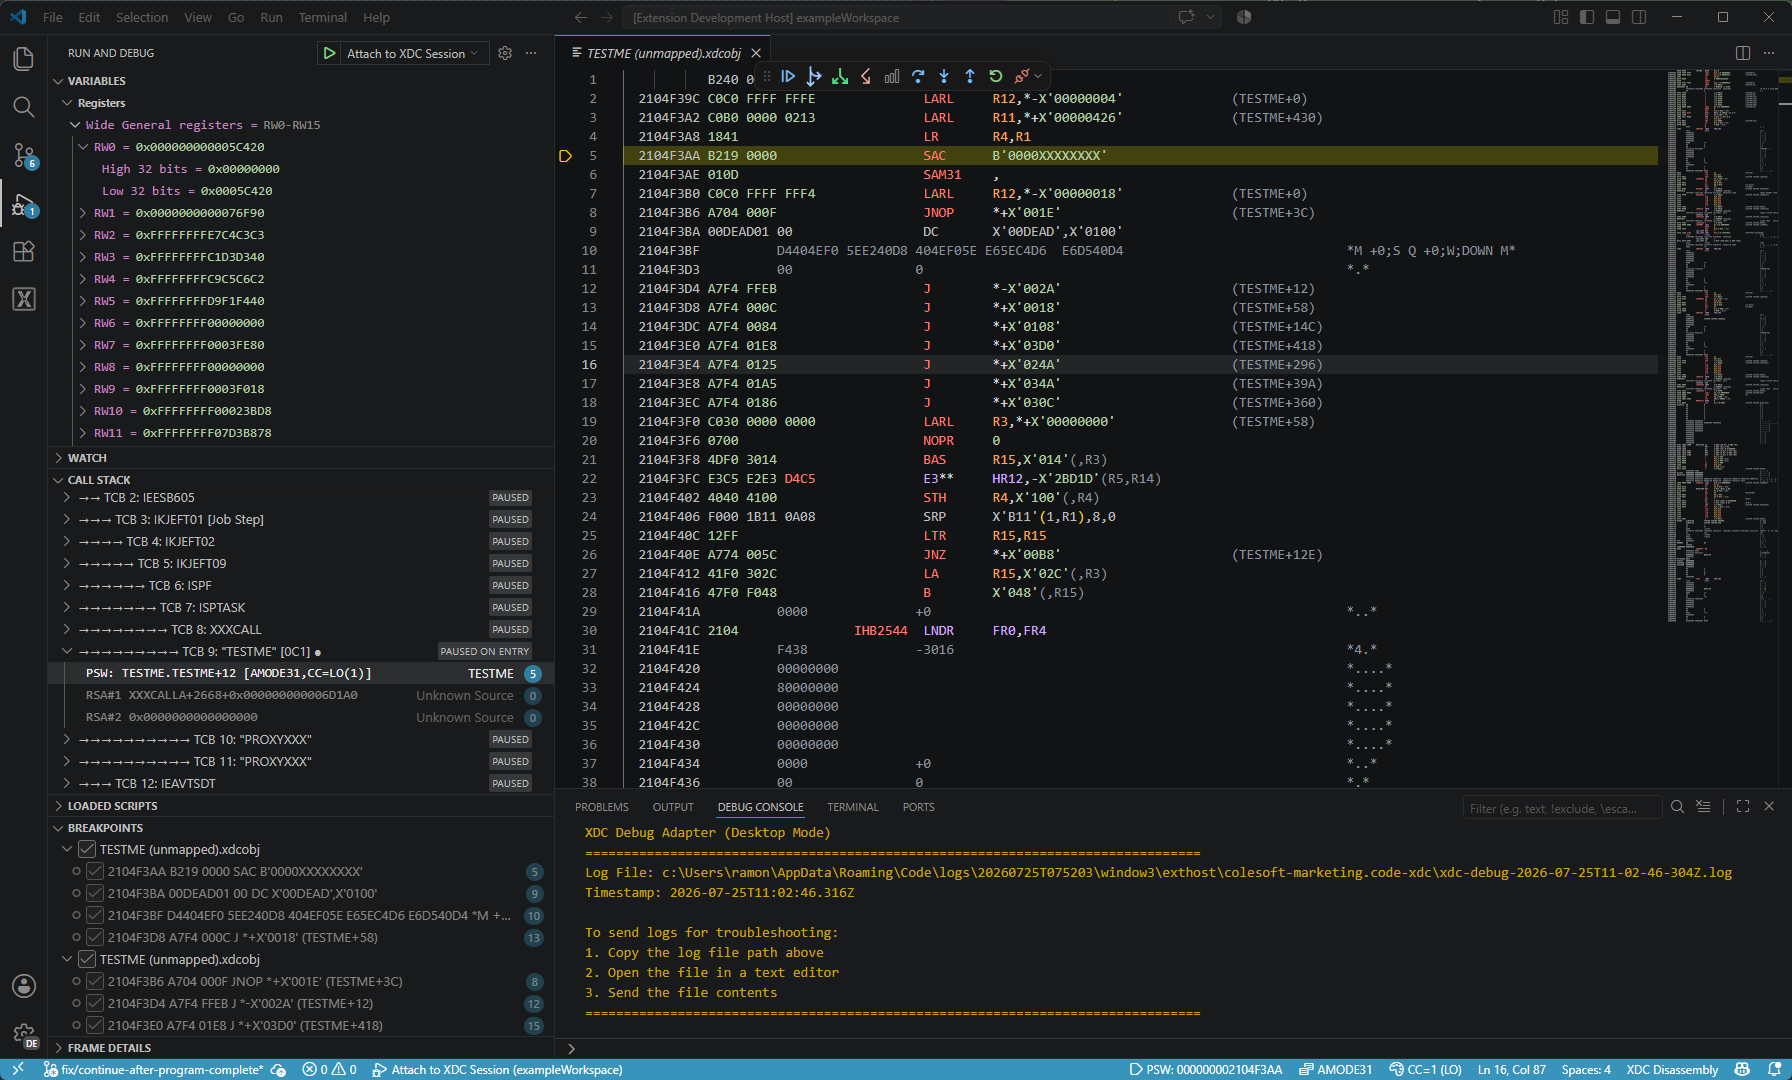
Attach to an existing CDF/XDC session on z/OS directly from VS Code. Pick a
session from the tree, or launch from a launch.json configuration. Set
breakpoints, step through code, and inspect the call stack using the standard
VS Code debugging experience.
Source-aware debugging for HLASM
XDC resolves your running program back to source using your ADATA or SYMDATA maps, providing statement labels and source images with robust syntax highlighting.
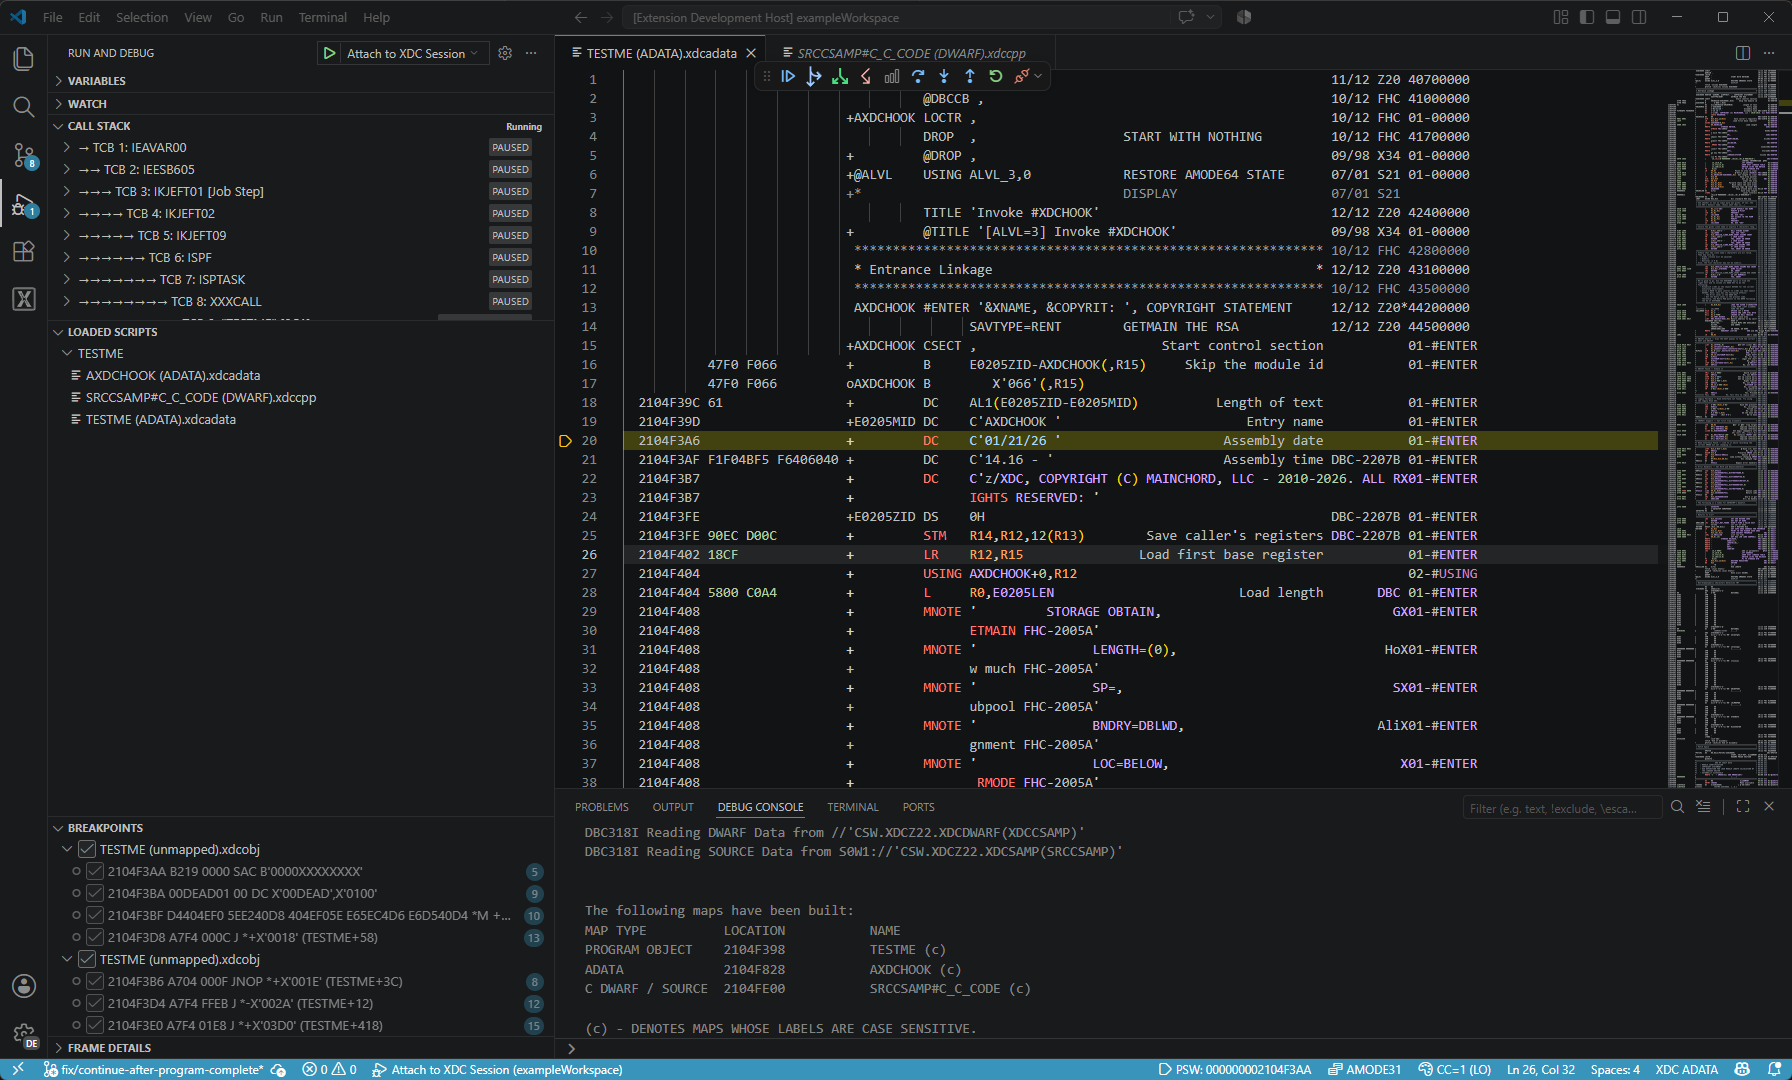
Registers, TCBs, and the PSW
Inspect general, control, access, floating-point, and vector register
sets while stopped. Registers are recognized on-hover using configurable equate
aliases (for example R1, GR1, WR1), and the FRAME Details view breaks
down your RSA chain, as well as the Request Block chain of the current TCB.

- View EBCDIC Data — open a formatted hex/EBCDIC viewer for any storage location or variable.
- Show Full Addresses / Offsets — toggle between absolute addresses and offsets when viewing memory.
- Show Mapped Source / Unmapped Object Code — switch between mapped source and raw object code.
- Map helper — quickly load maps for any CSECT.
- LIST SUBPOOL — visualize subpool storage.
One-click TRACE controls
Common Z/XDC trace operations are available as toolbar buttons and keyboard
shortcuts while stopped:
| Action |
Command |
Shortcut |
| Step or Trace |
ST/T |
F10 |
| Trace Branch |
T B |
Ctrl+F10 |
| Trace Branch Yes |
T BY |
Ctrl+Shift+F10 |
| Trace Branch No-Call |
T BNC |
Ctrl+Alt+F10 |

MAP helper and MAPLIBS
Build module/CSECT maps with guided helper forms.
Point XDC at your ADATA datasets (PDS, PDSE, or sequential) via the xdc.maplibs
setting or the Add MAPLIB to Active Session command so source can be resolved
automatically on attach.
Requirements
- Visual Studio Code
1.110.0 or newer.
- Network access to a running Z/XDC GUI Server on your z/OS system.
Getting started
- Open the XDC view from the Activity Bar.
- Click Add XDC GUI server and enter your host, port, and username.
- Expand the profile to see its active debug sessions and Connect to one,
or press
F5 with an XDC attach configuration in your launch.json.
A minimal launch.json configuration looks like this:
{
  "type": "xdc",
  "request": "attach",
  "name": "Attach to cdf/XDC Session",
  "sessionName": "my-session",
  "profileName": "my-profile"
}
Troubleshooting
If you run into issues while debugging, enable verbose logging on your attach
configuration:
{
  "type": "xdc",
  "request": "attach",
  "name": "Attach with verbose logging",
  "sessionName": "my-session",
  "profileName": "my-profile",
  "logTrace": true,
  "logVerbose": true
}
You can also open the log files directly from the Command Palette:
- XDC: Show Extension Log File
- XDC: Show Debug Adapter Log File
Known issues
- This is a preview release; expect rough edges and incomplete features.

