CodeAtlas — Architecture Diagrams and AI Code Review for Any Codebase
A zoomable structural map of your codebase — like Google Maps for code.
Auto-generated architecture diagrams, API sequence flows, dependency graphs, and AI code review for 30+ frameworks across 14 languages.
Navigate from service topology down to a single function. Live differential rendering highlights exactly what changed and where it ripples — across every layer, automatically.
New in v6.0 — AI code review built on the same six-layer structure. Every route, job, and background task gets reviewed individually. Findings appear on the exact layer they belong to. Bring your own LLM (OpenRouter, OpenAI, Anthropic, or Ollama for fully local) or use the MCP server to drive it from your AI coding assistant.
Works with: Express, NestJS, Next.js, React, Django, FastAPI, Flask, Spring Boot, Laravel, Rails, Gin, Actix, ASP.NET, and 20+ more frameworks. Supports JavaScript, TypeScript, Python, Java, Kotlin, Go, Rust, C#, PHP, Ruby, Swift, C/C++.
How It Works
Install the extension. CodeAtlas auto-scans your workspace on launch and builds interactive architecture diagrams — no setup required.
View diagrams in your browser at http://localhost:7742 for the best experience — full screen, multi-monitor, DevTools access.
Getting Started
- Install from the VS Code Marketplace
- Diagrams build automatically on extension launch — no manual step needed
- Click "Open in Browser" in the welcome panel or run
CodeAtlas: Open in Browser
- Sign in (free account) to view diagrams in the browser UI
- Navigate: click any node to drill deeper through all 6 layers
Diagrams are built and synced without authentication. Sign-in is only required to view them.
Browser UI
CodeAtlas runs a local server at http://localhost:7742 that serves the full diagram viewer:
- Home page — workspace stats, quick-nav buttons, commands, sign-in
- Floating explorer sidebar — Services, Feature Areas, APIs, Files, Functions (toggle with ☰)
- Live updates — save a file in VS Code, browser updates in real time
- Auto-reconnect — if VS Code reloads, browser reconnects automatically
The port is configurable via codeatlas.browserPort setting (default: 7742).
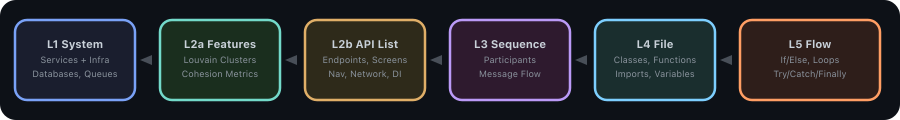
The 6 Diagram Layers
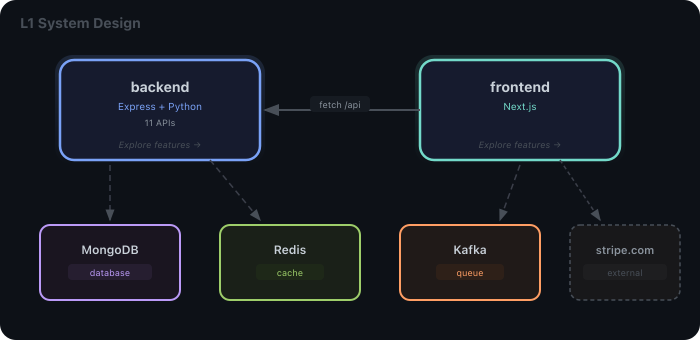
L1 — System Design
See all your services and infrastructure at a glance. Services connect to databases, caches, queues, and each other. Polyglot services show all detected technologies.
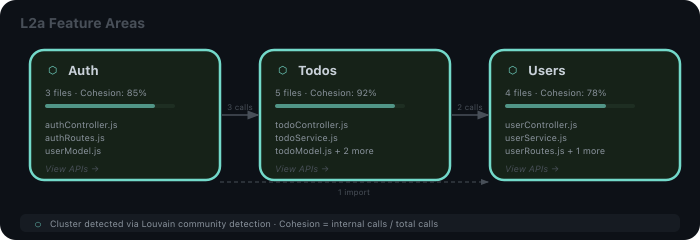
L2a — Feature Areas
Zoom into a service to see its domain clusters — automatically detected using Louvain community detection with Jaccard stability matching.
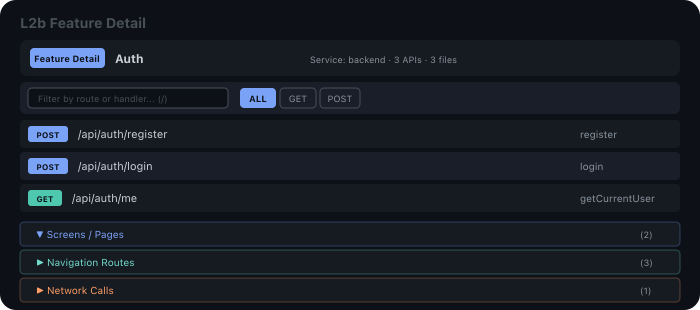
L2b — API & Screen List
Browse every API endpoint, screen, navigation route, network call, and DI binding in a cluster. Filter by method, search by route or handler. Press / to search.
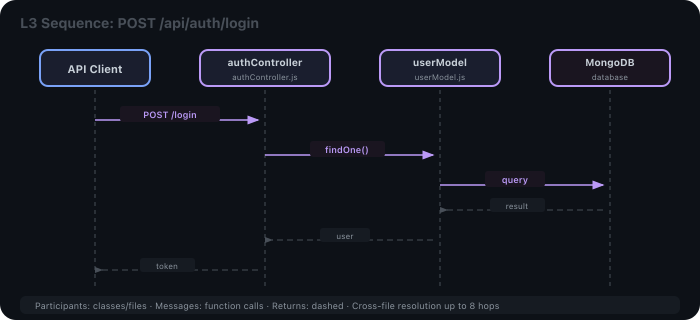
L3 — Sequence Diagram
See the full interaction flow for any API call — classes or files as participants, functions as messages. Cross-file resolution traces up to 8 hops deep.
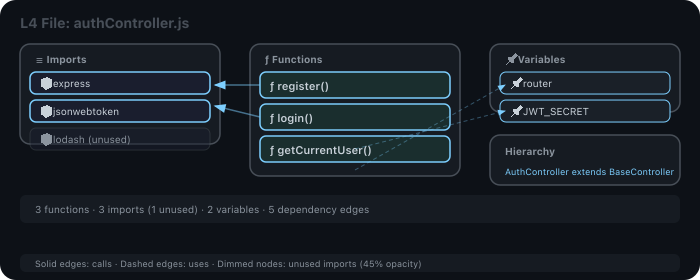
L4 — File / Class Diagram
See a file's structure: imports, classes, functions, variables, and their dependency edges. Unused imports are dimmed (45% opacity). Class hierarchy shown.
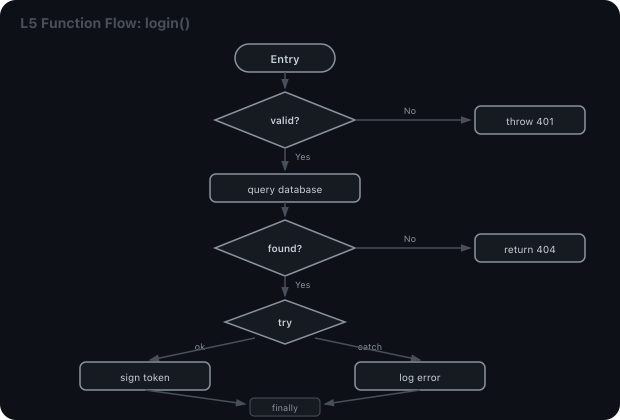
L5 — Function Flow
Control flow inside a single function: if/else as diamonds, loops with dashed back-edges, try/catch/finally as three-way splits. Every branch gets diff highlighting.
Health Dashboard
Run Show Health Report to see dead functions, god files, cyclic dependencies, high coupling, and orphaned clusters — sorted by severity with color-coded borders.
Code Review
📖 Full guide: docs/code-review-guide.md — writing good guidelines, what the evidence gate does, reading severity, driving the feature from an external MCP agent.
CodeAtlas reviews your code using the same six layers it draws. The Code Review card on the home page has the controls:
- Start review — every route, job, and background task gets reviewed individually.
- Changed only — review just the entry points whose code differs from baseline (handy for PR-sized loops).
- Specific review — opens a textarea so you can tell the AI exactly what to focus on ("audit input validation in POST handlers", "check for stale auth checks").
- Cancel — stops the in-flight LLM call immediately.
- Clear — wipes findings and resets the dedup signature so the next run starts fresh.
Findings show up where they belong:
- Auth issues appear on the API list row that's missing the guard.
- N+1 query patterns appear on the sequence diagram at the exact message that loops.
- Dead code or god files appear on the file view.
- Hardcoded secrets, leaky error handlers, and missing security setup appear on the system view (these come from a separate project-level pass).
A Findings popover on the home page opens with a top-down summary that names the dominant pattern across your findings (auth gaps, validation risks, secret leakage, N+1 queries…), then breaks down per layer (which clusters, which routes, which files) and finishes with a "Top concerns (focus here first)" shortlist. Below the summary you see each individual finding with Resolve / Ignore / Comment / Copy buttons on every row, plus a top "Copy ▾" dropdown to copy all findings — or just errors / warnings / info — as Markdown ready to paste into a PR or ticket. Each finding shows the commit SHA (or content-hash for non-git workspaces) it was reviewed against, so you can tell new findings from stale ones.
Inside every diagram layer, entities that have findings get a colored count marker. Click the marker to open the same popover (with the same actions) right where the problem lives. Status changes propagate to every open view immediately.
If you re-run Start review without editing any code or guidelines, you'll get a "Nothing changed since last review" badge instead of a fresh LLM round-trip.
How findings stay honest
Every finding the AI emits must quote the actual source code that justifies it. Anything that doesn't appear in your real file gets dropped before you see it — no invented "you should fix X" when X isn't even in the codebase. There's a DEBUG toggle on the home page if you want to compare what gets dropped vs. what the model first said.
The system also catches common false alarms:
- "Auth required on writes" won't appear on GET routes.
- "Webhook signature missing" won't appear on routes that aren't webhooks.
- Known-bad patterns (
JWT_SECRET || "default", eval(), async-in-.map()) get bumped to error severity automatically.
Your own review rules
The home page has a Review Guidelines section where you can write your team's rules in plain text — "flag missing auth on POST routes", "prefer Result types over thrown exceptions", anything. Up to 8 KB of free text. The AI reads them on every review.
Findings on every layer
Each diagram header shows a count of open findings, color-coded by severity. Click the count to open the Code Review panel scoped to that view. Entities that own findings also get a colored count marker — click it to open the finding popover with Resolve / Ignore / Comment / Copy / Open-in-panel actions, all id-linked across views.
Search findings in plain English
Type "what's wrong with auth?" or "anything fishy in the article create flow?" and you get the matching findings, scoped to the right entry point or cluster, ranked by relevance.
Bring your own AI
Configure once from the home page or with an environment variable:
| Provider |
Env var |
Notes |
| OpenRouter (default) |
OPENROUTER_API_KEY |
Hundreds of models including free tiers |
| OpenAI |
OPENAI_API_KEY |
GPT-4o, GPT-4, GPT-3.5 |
| Anthropic |
ANTHROPIC_API_KEY |
Claude 3.5 Sonnet, Claude 3 Opus |
| Ollama (local) |
— |
No API key needed |
| Custom endpoint |
— |
Any OpenAI-compatible URL |
Want to drive AI review from your AI coding assistant instead of the UI? The MCP server bundled with the extension (dist/mcp-server.js) exposes 57 tools for that — see the MCP section below.
Live Change Tracking
CodeAtlas watches your files. When you save, every diagram updates instantly — in both VS Code webview panels and the browser UI. Changes propagate upward through all 6 layers:
Diff Propagation Example
| Layer |
What Changes |
Visual |
| L5 Flow |
Changed function body highlighted |
~ login() dotted border |
| L4 File |
Function node shows modified |
~ authController.js |
| L3 Sequence |
Affected participants + messages |
~ POST /login orange swimlane |
| L2b API List |
Changed endpoints show badge |
~ login endpoint |
| L2a Features |
Cluster border turns orange |
~ Auth cluster |
| L1 System |
Service node shows badge |
~ backend |
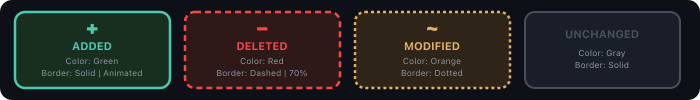
Colorblind-Safe Diff Indicators (WCAG 1.4.1)
Every change shows three independent visual channels — not just color:
Git Diff Mode
Compare any two commits visually across all diagram layers.
- Click Compare Commits in the diagram header (or browser home page)
- Pick a base and head commit
- Navigate all layers with full diff coloring
- Click Reset to return to live mode
Works with branches, tags, and pull requests.
Supported Languages & Frameworks
14 languages: JavaScript, TypeScript, Python, Java, Kotlin, Go, Rust, C, C++, C#, PHP, Ruby, Swift, Dart
| Category |
Frameworks |
| Node.js |
Express, Koa, Fastify, NestJS, Hono |
| Meta-frameworks |
Next.js (App + Pages), Nuxt, Remix, SvelteKit |
| API protocols |
tRPC, GraphQL, gRPC |
| Python |
Django, Django REST Framework, FastAPI, Flask, Starlette |
| Java/Kotlin |
Spring Boot, Micronaut, JAX-RS, Ktor |
| Go |
Gin, Echo, Chi, Fiber |
| PHP |
Laravel, Symfony |
| Ruby |
Rails, Sinatra |
| Rust |
Actix, Axum, Rocket |
| C# |
ASP.NET Core, Minimal API |
| Swift |
Vapor |
| Dart |
Flutter (StatelessWidget, StatefulWidget, GoRouter, Dio, GetIt, Riverpod) |
Mobile & UI Frameworks
| Platform |
Detection |
| Android |
Activities, Fragments, Jetpack Compose, Navigation Component, Retrofit, Room DAO, Hilt/Dagger/Koin |
| iOS |
UIViewController, SwiftUI Views, NavigationStack, URLSession/Alamofire, CoreData/SwiftData, Combine |
| React / Next.js |
Pages, react-router, useSWR/useQuery/useMutation/useInfiniteQuery, Redux/Context/Zustand/Jotai |
| React Native |
Screen components, Stack/Tab navigators, navigation routes |
| Expo Router |
Stack.Screen, Tabs.Screen, router.push/replace, Redirect, (group) route stripping |
| Flutter |
StatelessWidget/StatefulWidget, Navigator/GoRouter, Dio/http, GetIt/Provider/Riverpod |
| KMP |
commonMain/androidMain/iosMain source sets, expect/actual declarations |
Mobile items appear in 4 sections: Screens, Navigation, Network, Dependencies — each with a platform badge.
Infrastructure auto-detected: PostgreSQL, MySQL, MongoDB, Redis, RabbitMQ, Kafka, Celery, Sidekiq, Entity Framework, Eloquent, Room, CoreData, Realm, Firebase, and more.
Blast Radius Analysis
Right-click any function or run Impact Analysis from the sidebar/command palette to see:
- Will Break — direct callers that will fail
- Likely Affected — transitive callers up to 4 hops
- Review Required — modules that import your code but may not call it
Know what breaks before you ship.
AI Query Engine
Ask questions about your codebase in plain English. CodeAtlas highlights matching entities in blue across all 6 diagram layers.
How to use:
- Click the Ask AI button (sparkle icon) in the toolbar, or press
Cmd+Shift+Q
- Type a question: "Show me the authentication flow", "How does payment connect to the database?", "What are the service controllers?"
- Matching services, clusters, APIs, files, classes, and functions light up in blue
- Navigate freely — highlights persist as you drill through layers
- Hover any highlighted node to see WHY it matched (e.g., "API handler: POST /auth/login")
- Click Clear or press
Esc to remove all highlights
What gets highlighted:
- Services, feature clusters, and sub-cluster pills at L1/L2
- API endpoints with blue left-border at L2b
- Sequence diagram participants AND message arrows between them at L3
- File/function nodes AND connecting edges at L4/L5
- Config files and type definitions (even without functions)
Smart features:
- Zero results show suggested query examples to help you get started
- Progress indicators for long-running queries ("Analyzing codebase...", "Still working...")
- Results cached for 5 minutes — repeated queries return instantly
- Concurrent queries handled safely — only the latest result is displayed
- Works in both VS Code webview and standalone browser mode
- Set your API key inline from the browser (no VS Code command palette needed)
Setup: Enable LLM features in settings (codeatlas.llmNaming: true), then run CodeAtlas: Set LLM API Key to enter your OpenRouter, OpenAI, or Anthropic key. Free tier available via OpenRouter.
Commit Timeline Replay
Watch your codebase evolve commit-by-commit with a cinematic visual replay.
- Click Timeline Replay (⏯) in the toolbar
- Select a branch from the dropdown — commits load automatically
- The merge-base with main/master is auto-detected and marked with a yellow badge
- Click the start and end commits — the range highlights in blue
- Click Start Replay — CodeAtlas builds diffs on-demand and auto-navigates:
- L5 Flow — each changed function's control flow
- L4 File — changed file dependency graphs
- L3 Sequence — affected API interaction diagrams
- L2a Feature — impacted feature clusters
- L1 System — full system design with propagated diff colors
Playback controls:
- ⏸ Pause / ▶ Resume — freeze on any diagram to explore
- ⏭ Skip — jump to the next commit
- ■ Stop — end replay and return to live mode
- Speed slider — adjust from 0.5s to 5s per step
All diagrams use the full 3-channel WCAG diff colors (green/added, orange/modified, red/deleted) so you can see exactly what each commit changed.
Right-click any node in any diagram to add a comment. Comments are exported to comments.md in your workspace root with full architectural context — service, cluster, API, file, and function — so LLM agents can pick them up and understand exactly where to make changes.
Keyboard Shortcuts
| Shortcut |
Action |
Cmd+Shift+D |
Open System Design |
Cmd+Shift+A |
Search APIs |
Cmd+Shift+I |
Initialize Visuals |
Cmd+Shift+Q |
Ask AI — natural language query |
Cmd+Shift+F5 |
Global Search |
/ |
Focus search in API List |
Esc |
Close panels / clear AI query |
Export
| Format |
How |
| SVG |
Click Export in diagram header (copies to clipboard) |
| Markdown |
CodeAtlas: Export Architecture Docs — Mermaid diagrams for L1-L3 + API tables + health |
| JSON |
CodeAtlas: Export Diagrams JSON |
AI Assistant Integration (MCP)
CodeAtlas ships a standalone Model Context Protocol server that any MCP-compatible LLM client can consume. Pointing your agent at a workspace gives the model live structural answers — routes, sequences, diffs, impact analysis, architecture violations, full SQL access — without it reading the source files.
Why it matters: token economics
Measured against the test project, every query returns 5×–200× fewer tokens than the equivalent file-walking approach:
| Query |
Naive file-walk |
MCP context pack |
Reduction |
| List every entry point |
14,088 tokens |
1,794 tokens |
7.9× |
| One route's full context |
5,647 tokens |
703 tokens |
8.0× |
| Impact-of-change for a function |
~20-30 files of grepping |
254 tokens |
~50× |
| Diff summary |
several KB of git output |
28 tokens |
>200× |
A 2.7B-class model with a 16K context window can now answer "what handles this route?" or "what breaks if I change X?" on a 1k-file codebase using one MCP call instead of dozens of file reads. The retrieval problem moves from the LLM to the framework.
Context packs: list_entrypoints, list_entrypoints_paged, get_entrypoint_pack, get_feature_pack, pre_edit_brief, get_function_source, trace_call_path, get_tour
Diff & impact: get_diff_summary, get_api_surface_diff, get_impact_of_change, get_impact_analysis, get_function_dependencies, get_regression_scope
Search & query: search_workspace (weighted reverse index), query_snapshot (read-only SQL), describe_snapshot_schema
Health & rules: get_health_report, list_architecture_violations, get_coverage_overlay, list_overlays, get_overlay
Workspace: get_workspace_status, find_similar_entities, list_saved_views, compare_workspaces, list_repos
Interop: export_openapi_spec, export_function_calling_spec, summarise_payload, import_api_collection
API Testing: run_api_chain, stream_sse, connect_websocket, oauth2_token, oauth2_authorize_url, generate_request_body, generate_chain, generate_test_cases
AI Code Review: list_ai_findings, get_ai_finding, get_ai_finding_counts, update_ai_finding_status, clear_findings, get_review_guidelines, set_review_guidelines, search_ai_findings, summarise_findings, list_findings_by_guideline, get_review_summary, score_findings, review_diff_with_baseline, review_and_fix_pack, propose_guideline_from_finding
Plus eight MCP resources: codeatlas://workspace/{microservices, apis, features, entrypoints, diff-summary, ai-findings, review-guidelines, review-summary}.
Quick setup — five clients
The binary lives inside the installed extension at ~/.vscode/extensions/codeatlaslive.codeatlas-live-<version>/dist/mcp-server.js. Point your client at it with the workspace path as the single argument.
Claude Code — claude mcp add codeatlas -s user -- node ~/.vscode/extensions/codeatlaslive.codeatlas-live-<version>/dist/mcp-server.js /absolute/path/to/your/repo (or edit ~/.claude.json directly).
Cursor — Cursor → Settings → MCP → Add Server:
{
  "mcpServers": {
    "codeatlas": {
      "command": "node",
      "args": [
        "/Users/<you>/.vscode/extensions/codeatlaslive.codeatlas-live-<version>/dist/mcp-server.js",
        "/absolute/path/to/your/repo"
      ]
    }
  }
}
VS Code (1.103+, with Copilot Chat agent mode) — drop into .vscode/mcp.json at the workspace root:
{
  "servers": {
    "codeatlas": {
      "type": "stdio",
      "command": "node",
      "args": [
        "${userHome}/.vscode/extensions/codeatlaslive.codeatlas-live-<version>/dist/mcp-server.js",
        "${workspaceFolder}"
      ]
    }
  }
}
Codex CLI — append to ~/.codex/config.toml:
[mcp_servers.codeatlas]
command = "node"
args = [
  "/Users/<you>/.vscode/extensions/codeatlaslive.codeatlas-live-<version>/dist/mcp-server.js",
  "/absolute/path/to/your/repo",
]
Gemini CLI / Antigravity — ~/.gemini/settings.json (or .gemini/settings.json in the project root):
{
  "mcpServers": {
    "codeatlas": {
      "command": "node",
      "args": [
        "/Users/<you>/.vscode/extensions/codeatlaslive.codeatlas-live-<version>/dist/mcp-server.js",
        "/absolute/path/to/your/repo"
      ]
    }
  }
}
After registering, reload your client and the 57 tools appear alongside its built-ins.
A wrapper for any-workspace use
If you want one config that works in any project (so you don't have to update the workspace path each time), drop this onto your $PATH:
#!/usr/bin/env bash
# /usr/local/bin/codeatlas-mcp
exec node ~/.vscode/extensions/codeatlaslive.codeatlas-live-<version>/dist/mcp-server.js "$PWD"
Then your client configs become command: codeatlas-mcp with no args — workspace is wherever you launched the client.
Self-init: no VS Code required
The MCP server bootstraps the snapshot itself when launched against a workspace that has no .codeatlas/state.db yet — scans the workspace, classifies it as a codebase (or returns status: 'not_a_codebase' for docs-only / empty dirs), runs the full indexing pipeline, and starts a file watcher to keep state current. You can register the MCP server against a brand-new repo and the LLM gets working answers within seconds — no VS Code launch required.
Concurrent VS Code + MCP
When both run on the same workspace, MCP wins write ownership. The extension watches for .codeatlas/.mcp-preempt, yields its lock when an MCP process requests it, disables auto-update for the session, and shows a recovery toast. Close+reopen the workspace once the MCP process exits to reclaim writes. No silent races on state.db.
Commands
| Command |
Description |
| Open in Browser |
View diagrams at localhost:7742 |
| Initialize Visuals |
Scan workspace and build all diagrams |
| Re-sync Everything |
Full rebuild + reset baseline |
| Search |
Find APIs, files, clusters, services |
| Show Health Report |
Code quality dashboard |
| Impact Analysis |
Blast radius for selected file/function |
| Compare Commits |
Git diff across all layers |
| Compare Pull Request |
PR diff across all layers |
| Load Test Coverage |
Import lcov/Istanbul coverage data |
| Export Architecture Docs |
Markdown + Mermaid export |
| Copy API Route |
Copy METHOD /route to clipboard |
| Toggle Auto Update |
Enable/disable live updates |
Settings
| Setting |
Default |
Description |
| Auto Update on Save |
On |
Refresh diagrams when you save |
| Browser Port |
7742 |
Port for standalone browser UI (localhost) |
| Ignore Patterns |
node_modules, dist, build |
Glob patterns to skip |
| LSP Fallback |
Off |
Better type resolution for complex TypeScript |
| LLM Naming |
Off |
AI-powered cluster naming via OpenRouter |
| God File Threshold |
15 |
Symbols count to flag large files |
| High Coupling Threshold |
10 |
Cross-file edges to flag tight coupling |
Privacy & Security
- Your code stays local. All analysis runs on your machine.
- Browser UI is localhost-only. Server binds to 127.0.0.1 with WebSocket origin validation.
- LLM features are opt-in. Only short snippets are sent, and sensitive values are filtered before transmission.
- Sensitive data never persisted. Passwords, tokens, and connection strings are scrubbed from the state file.
- CSP enforced. Webview uses a nonce-based Content Security Policy.
- Atomic writes. State file is written with a tmp-file-and-rename pattern; a schema-version header lets the extension cleanly rebuild after upgrades.
Telemetry
CodeAtlas sends anonymous product-usage events so we can understand which features
are used and debug issues across editors and platforms.
What we collect:
- Lifecycle events — first install, update, launch (extension version,
days-since-install).
- Interaction events — which features are used: Code Review, Ask AI, Timeline
Replay, Git Diff, Initialize, Resync, Sign-In.
- Editor context — editor name (e.g. Visual Studio Code, Cursor, VSCodium),
uri scheme, distribution channel (Marketplace vs Open VSX), platform, architecture,
remote-mode kind (WSL / SSH / dev-container).
- Anonymous device ID — a per-device hash provided by VS Code
(
vscode.env.machineId). Not tied to your real identity unless you sign in.
- User account when signed in — your email and a generated user identifier,
only after explicit sign-in. Used to associate device events with your account.
- Error and notification events — feature failures, parse errors, and warning
toasts shown.
What we do NOT collect:
- Your source code or any file content
- File names or directory structure
- Git history, commit messages, branch names, or repository URLs
- Search queries or natural-language prompts (only their length is recorded)
- LLM responses or Code Review findings text
- Any value entered into a password field, API key, or secret
How to opt out:
- Stay signed out — events are then attributed only to an anonymous device hash
with no email or user identifier attached.
- Block
api2.amplitude.com at the firewall (or disable network access for the
VS Code extension host) for a complete opt-out.
Why CodeAtlas?
| Feature |
CodeAtlas |
Other tools |
| Layers |
6 zoomable layers (system → function) |
Usually 1-2 static views |
| Frameworks |
30+ auto-detected |
Manual configuration |
| Diff visualization |
3-channel colorblind-safe across all layers |
Basic or none |
| AI Code Review |
LLM-powered review on diffs with severity bubbles |
Separate tool |
| Timeline Replay |
Cinematic commit walkthrough through all layers |
Not available |
| Health Report |
Dead code, cycles, coupling, god files |
Separate linter |
| Browser mode |
Full UI at localhost:7742 |
Editor only |
| Offline |
Code analysis fully local; anonymous usage telemetry only — see Privacy section |
Often cloud-dependent |
| MCP Server |
AI assistants can query your architecture |
Not available |
Supported Frameworks & Languages
JavaScript/TypeScript: Express, NestJS, Next.js (App + Pages Router), Nuxt, Remix, SvelteKit, Hono, tRPC, GraphQL, gRPC
Python: Django, Django REST Framework, FastAPI, Flask, Starlette
Java/Kotlin: Spring Boot, Spring WebFlux, Micronaut, JAX-RS, Ktor
Go: Gin, Echo, Chi, Fiber, net/http
Rust: Actix, Axum, Rocket
C#: ASP.NET Core, Minimal API
PHP: Laravel, Symfony
Ruby: Rails, Sinatra
Swift: Vapor
Mobile: Android (Jetpack Compose, Hilt, Room), iOS (SwiftUI, UIKit), React Native, Flutter/Dart, Expo Router
Infrastructure detection: MongoDB, PostgreSQL, MySQL, Redis, RabbitMQ, Kafka, Celery, Sidekiq, Prisma, Sequelize, and more.
Quality
Every release is validated against 29 real-world framework repos covering Express, NestJS, Fastify, Next.js, Nuxt, Remix, SvelteKit, tRPC, Apollo, Django, FastAPI, Flask, Spring, Ktor, Gin, Echo, Chi, Fiber, Laravel, Symfony, Rails, Sinatra, Actix, Axum, Rocket, ASP.NET, Vapor, plus mobile (React Native, Flutter, Jetpack Compose, SwiftUI). The suite asserts diagram correctness layer-by-layer (L1–L5), output stability across runs, and a per-repo performance budget — so an upgrade never silently regresses detection on your stack.
Feedback & Support
License
See LICENSE.md