CloudCostTree for VS Code
Question and experiment with what your infrastructure will cost, right
inside the editor, before you apply. A cost tree, what-if simulator,
FinOps recommendations, and policy checks, backed by real AWS rates.
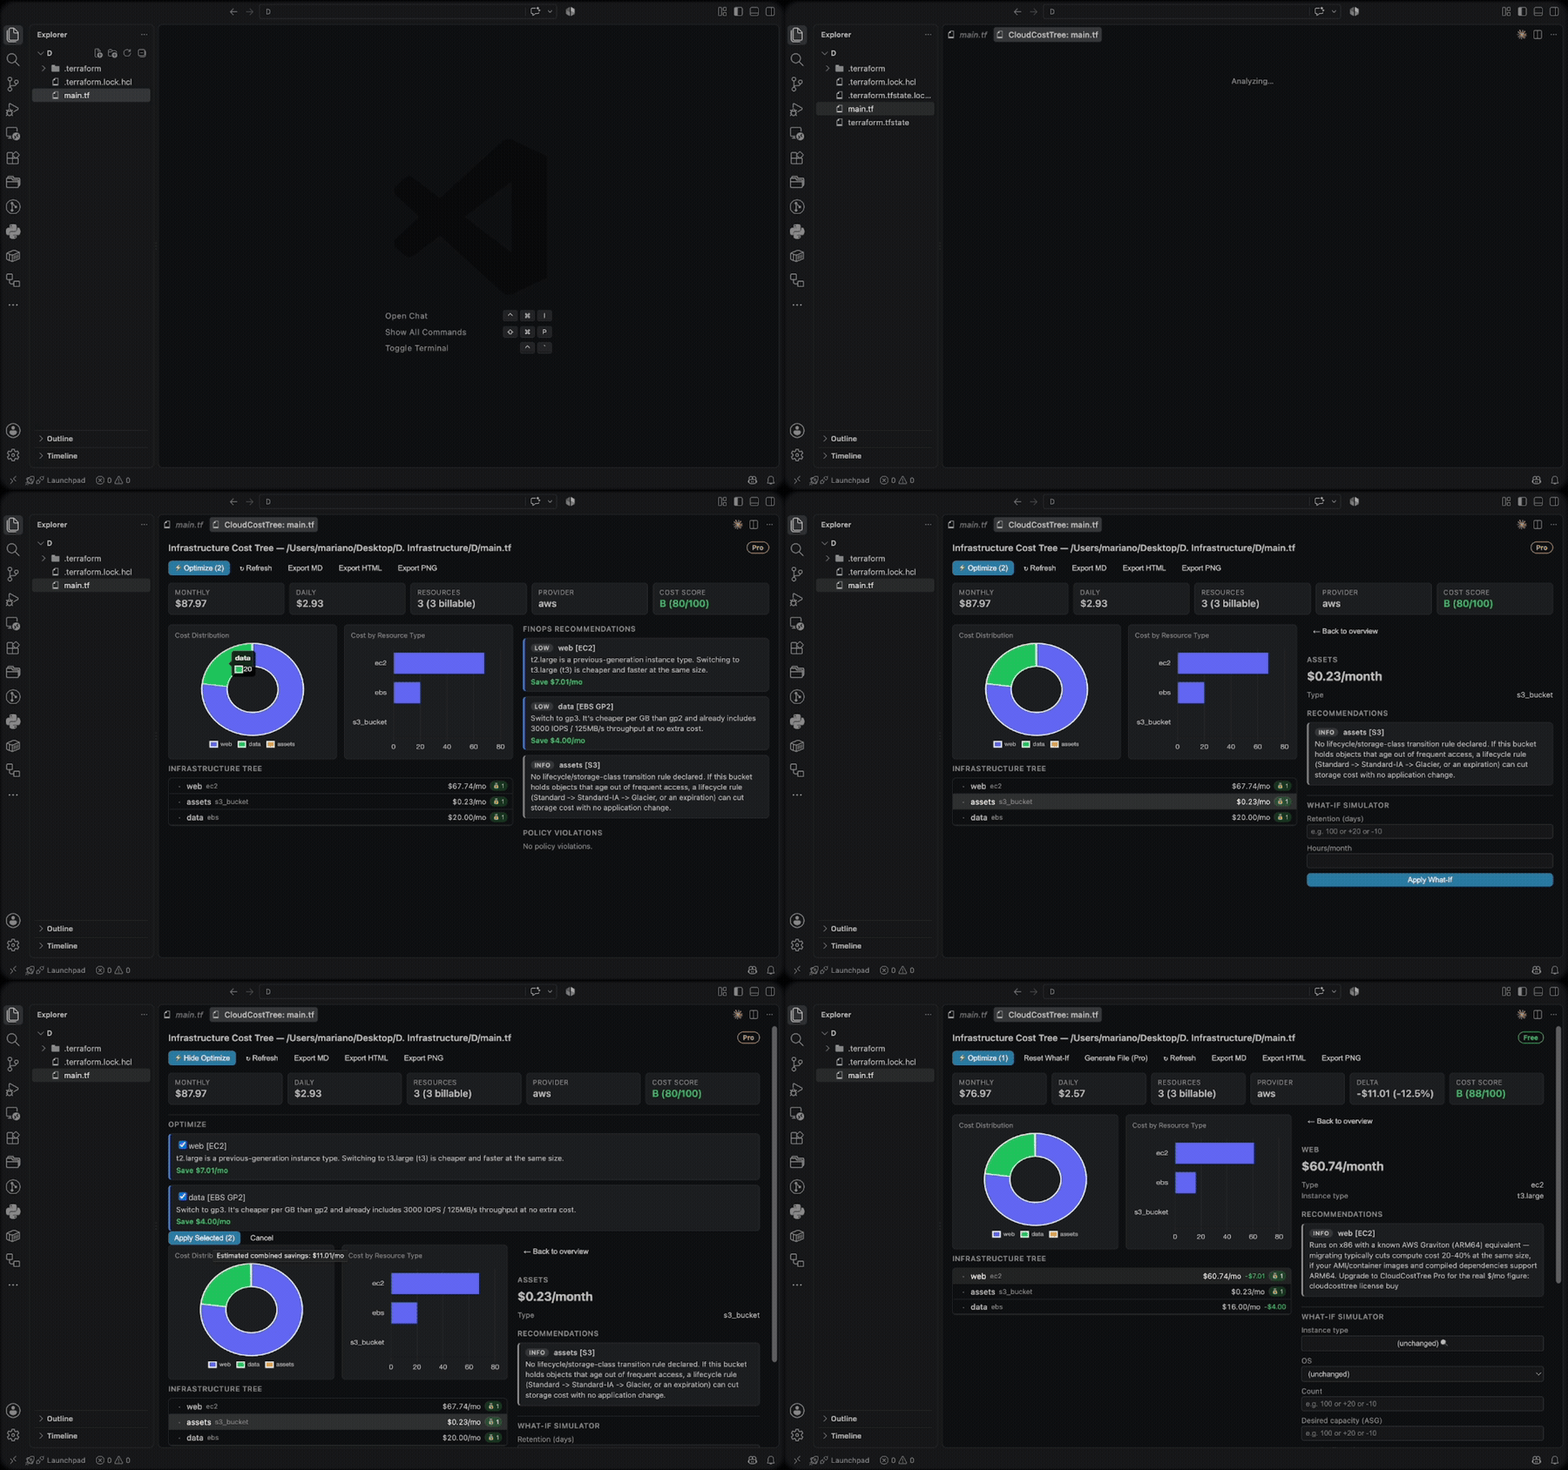
This extension is a thin UI layer over the
cloudcosttree CLI: every
number you see comes from a real cloudcosttree analyze --export json:-
call, not a reimplementation. No pricing/parsing logic is duplicated here.
Requirements
None: the extension downloads the matching cloudcosttree CLI binary for
your OS/CPU automatically the first time you run an analysis (shown as a
one-time "downloading the cloudcosttree CLI" notification). If you already
have cloudcosttree on your PATH (e.g. installed via
curl -fsSL https://cloudcosttree.com/install.sh | sh, or built from
source), the extension uses that instead of downloading its own copy. To
pin a specific binary yourself, set the cloudcosttree.binaryPath setting.
Privacy
No file contents, file names, paths, project/workspace names, cloud
resource data, credentials, tags, or cost figures are ever transmitted
anywhere: all analysis runs locally through the cloudcosttree CLI on your
own machine.
The only thing this extension ever sends is an anonymous usage event when
you run a CloudCostTree command, so we know which features get used and can
catch regressions. Each event carries the extension version, VS Code
version, OS, and a random non-identifying id, plus — depending on the
action — which action ran (analyze / what-if / compare / IAM policy),
whether optional flags like --with-usage were on, the cloud provider
name, the input kind (Terraform / CloudFormation / YAML …), a coarse
bucket for how many resources or changes were involved (e.g. 6-20,
never an exact count), a coarse run-duration bucket, and whether the run
succeeded. Never anything about what you analyzed, and never a dollar
amount.
This respects VS Code's own telemetry setting; set
"telemetry.telemetryLevel": "off" to disable it like any other
extension's telemetry.
Features
- Analyze: right-click a
.tf/.tfstate/.json/.yaml infrastructure
file (or run the command with one open), or right-click a folder
(a Terragrunt root or an Atmos stack directory) to open an interactive
report. CloudFormation templates, CDK-synthesized output
(cdk.out/<StackName>.template.json), and Pulumi stack exports are all
plain .json/.yaml, so they're covered by the same file-based analysis.
- Compare: right-click a file → "Select as Baseline for Compare", then
right-click a second file → "Compare with Baseline" to see the cost delta
between them: added/modified/removed resources, per-resource deltas, and
the current-state tree with delta badges. Mirrors VS Code's own native
"Select for Compare" / "Compare with Selected" two-step flow. File-based
only for now: a Terragrunt/Atmos directory can be analyzed but not yet
selected as a Compare baseline/target.
- Collapsible tree grouped by module/stack, with cost, policy-violation
coloring, and a savings badge per resource.
- Pie + bar charts (cost distribution, cost by resource type).
- Click any resource for its full details, its own FinOps recommendations,
its policy violations, and a What-If Simulator form scoped to fields
that actually apply to it (instance type, IOPS, Multi-AZ, ...): powered
entirely by the CLI's existing
--whatif flags. EC2 instance type and
RDS instance class fields open a native, type-to-filter picker over the
real, currently-priced catalog (1,300+ EC2 types, 250+ RDS classes)
instead of a plain dropdown.
- Export the current view as Markdown, HTML (via the CLI), or PNG (a
snapshot of the whole panel).
- Save Snapshot: save the current analysis as a
history snapshot with
one click — no naming needed (<file>-<date>-cct, auto-generated). Asks
whether to include real AWS usage data first (CloudCostTree Pro; Free
still saves, just without it). Snapshots land in the same
~/.cloudcosttree/history the CLI's own history save uses, so
history list/compare/trend from a terminal see them too.
- Compare History Snapshots: pick any two saved snapshots (a QuickPick
lists every one, with its cost and save date) to see the cost delta
between them — by resource type, plus added/removed/changed resources
with their cause (config, price, or usage change) — right in the panel,
no terminal needed. Optionally group the same comparison by a tag key
(e.g.
team) to see cost allocation shift between tag values instead of
between individual resources; the tag picker suggests real keys found on
either snapshot. See the main project README's Cost delta
attribution
section for what a saved usage snapshot unlocks in compare.
- Follows the VS Code color theme automatically (styled with
--vscode-*
CSS variables, no separate dark/light code path).
- Generate IAM Policy: right-click a
.tf/CloudFormation/Pulumi file or
folder (or the "🛡️ Generate IAM Policy" toolbar button, once an analysis
is open) to get the least-privilege IAM policy that deployment needs,
worked out statically — no AWS account, no cost analysis required first.
Writes <name>_cct-iam-policy.json next to the input and opens it. Free.
If the policy's actions enable a documented privilege-escalation
technique (iam:PassRole to compute, direct principal mutation, …), a
warning offers to open the privilege-escalation review the CLI wrote
beside the policy (<name>_cct-iam-policy.privesc.txt). See the main
project README's
IAM policy generator
section for what it does and doesn't cover yet (every policy currently
uses "Resource": "*", not scoped to specific resource ARNs).
- Usage-aware FinOps (Pro): turn on the
cloudcosttree.withUsage
setting to enrich Analyze/Compare with real AWS data: the same
--with-usage the CLI has always had (real CPU-based right-sizing, live
Spot pricing, confirmed orphaned EBS volumes/snapshots, unassociated
Elastic IPs, empty-target-group load balancers, real Lambda cost/memory
correction, mixed_instances_policy resolution, and a fleet-size-outlier
check: see the main project README's
Usage-aware FinOps section
for the full list). Turning it on for the first time shows a one-time
confirmation dialog, since this is the one feature that calls your own
AWS account: it uses the exact same default credential chain the CLI
already does (environment variables, a shared profile, SSO, or an
instance role), inherited from however VS Code itself was launched, so
make sure it can see the credentials you want it to use. This is
independent of any profile argument on a .tf file's own provider "aws" block, which only Terraform itself reads, to point this feature
at a named profile, export AWS_PROFILE=<name> in the shell VS Code was
launched from (or set it as the default profile) before opening it.
Decline the dialog and the setting reverts itself to off. Real network calls across
several AWS services/regions make this run noticeably slower than a
normal analysis (the loading overlay says so); non-fatal issues (missing
credentials, an unresolvable region, and on Free, an upgrade nudge instead
of a failure) show up as a dismissible banner in the panel instead of
being silently swallowed. The resulting recommendations need no special
UI: they show up in the existing FinOps Recommendations panel like any
other finding. The panel header always shows a small plan pill (amber
"Pro" or green "Free") inferred from the CLI's own stderr notes (there's
no dedicated license-tier field on the report), so it stays accurate
whether or not this particular run happened to include real usage data.
A resource with a real measured confidence range (see the main README's
own section above) shows a small ± marker next to its monthly cost in
the tree — hover it for the real range. In Analyze mode, clicking the
resource also shows the full range in the detail panel; Compare's tree
is read-only (no detail panel), so there the marker's tooltip is the
only place the range appears.
Settings
| Setting |
Description |
cloudcosttree.binaryPath |
Path to the CLI binary (default: cloudcosttree on PATH) |
cloudcosttree.pricesPath |
Price catalog JSON (default: the CLI's own default) |
cloudcosttree.policiesPath |
policies.yaml path (default: CLI auto-detection) |
cloudcosttree.includeGovernance |
Also show governance-only FinOps recommendations |
cloudcosttree.withUsage |
CloudCostTree Pro: enrich with real AWS data (--with-usage); see above |
| |

