ClaudeSense
Make sense of every Claude Code session.
A VS Code extension that reads your local Claude Code session logs and turns them into a dashboard: per-session health score, coaching tips, token/cost tracking, tool-usage breakdown, 90-day activity heatmap, and live context-window telemetry in the status bar.
Screenshots
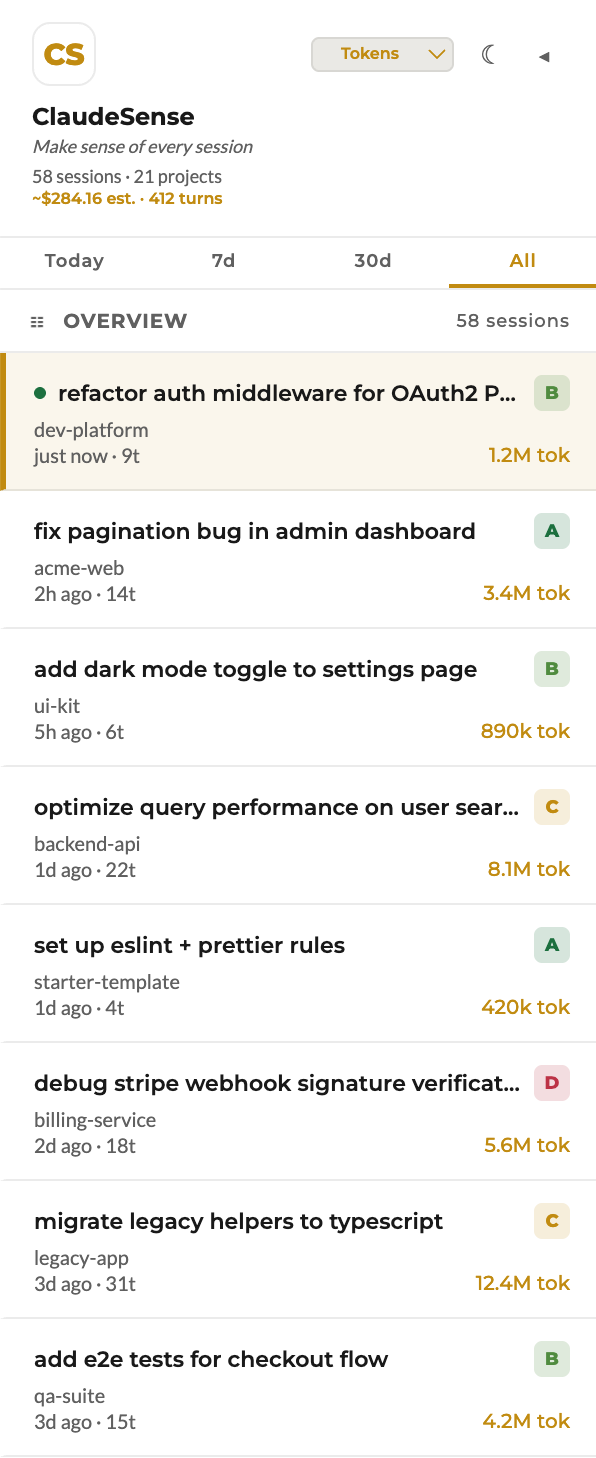
Session list + health scores
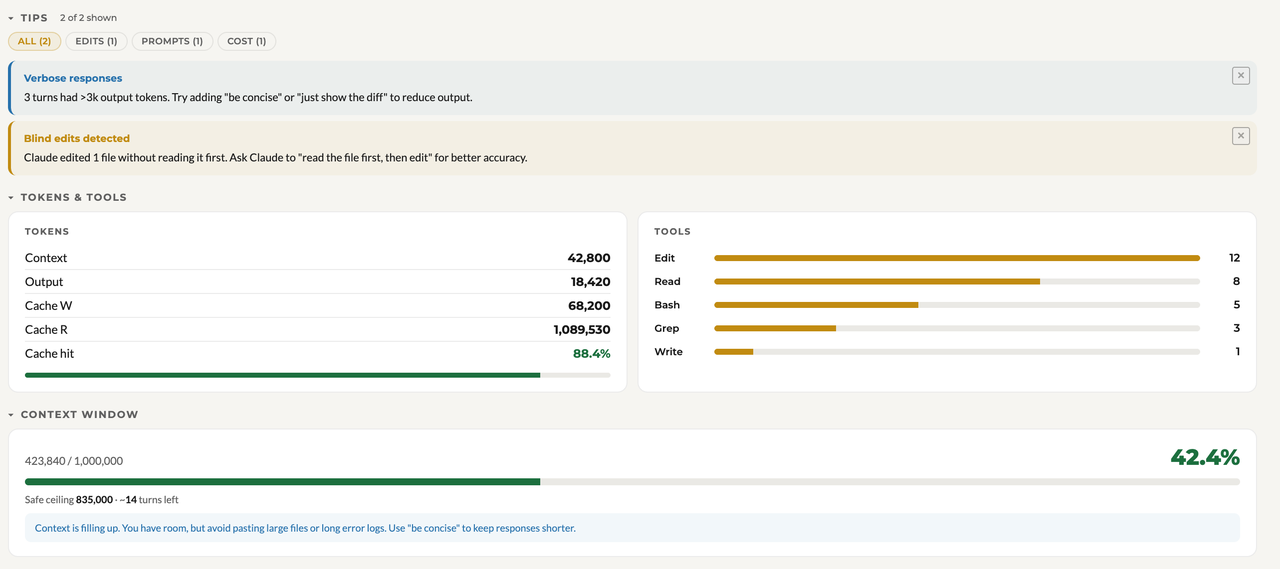
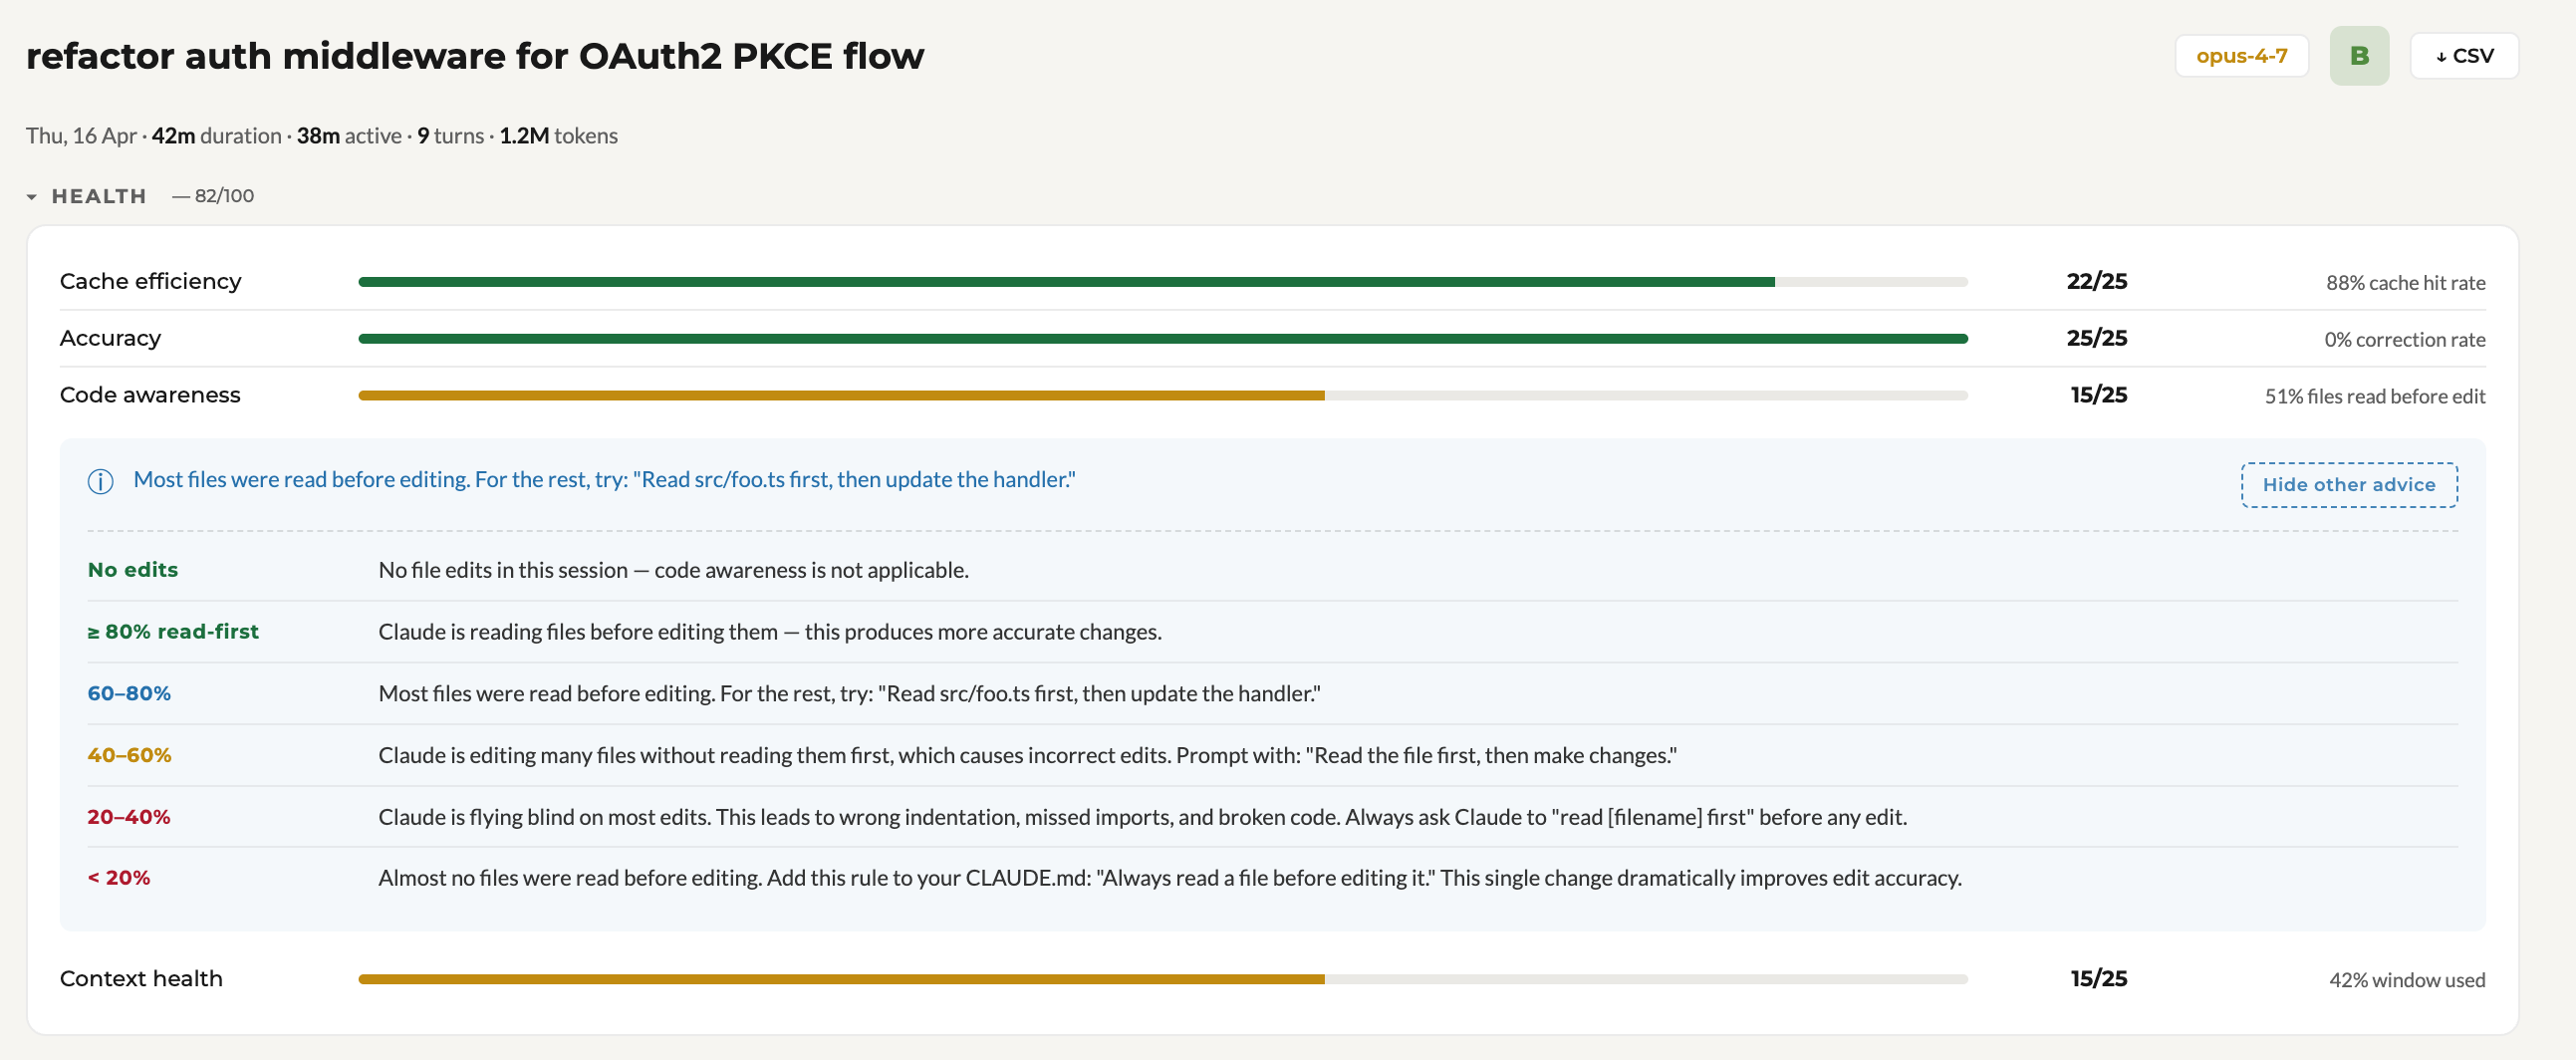
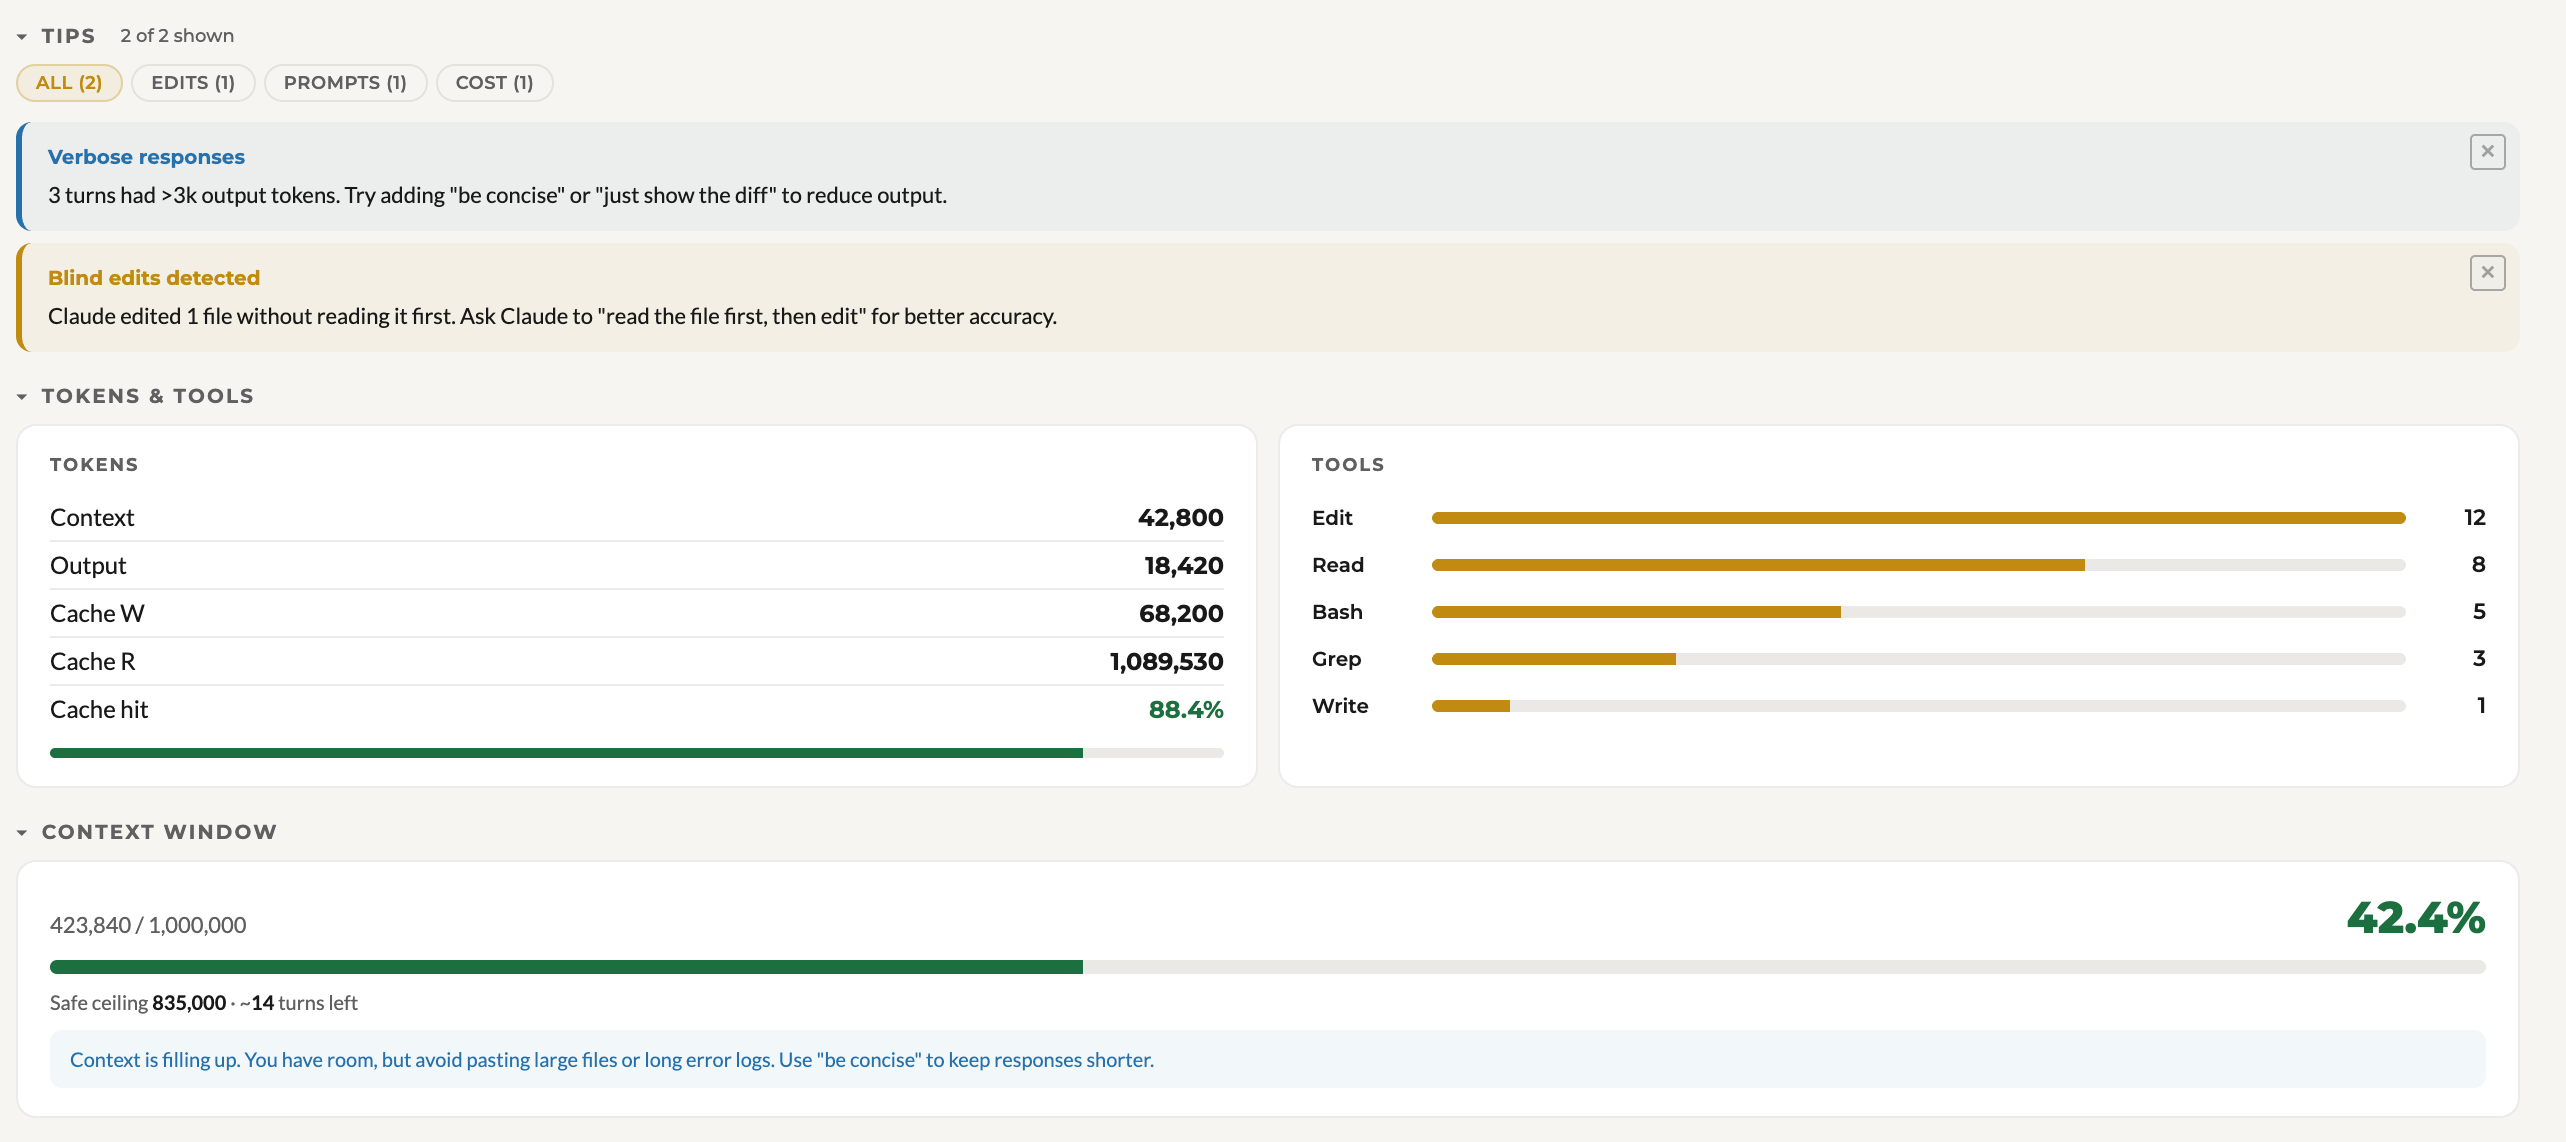
Health factors + coaching tips
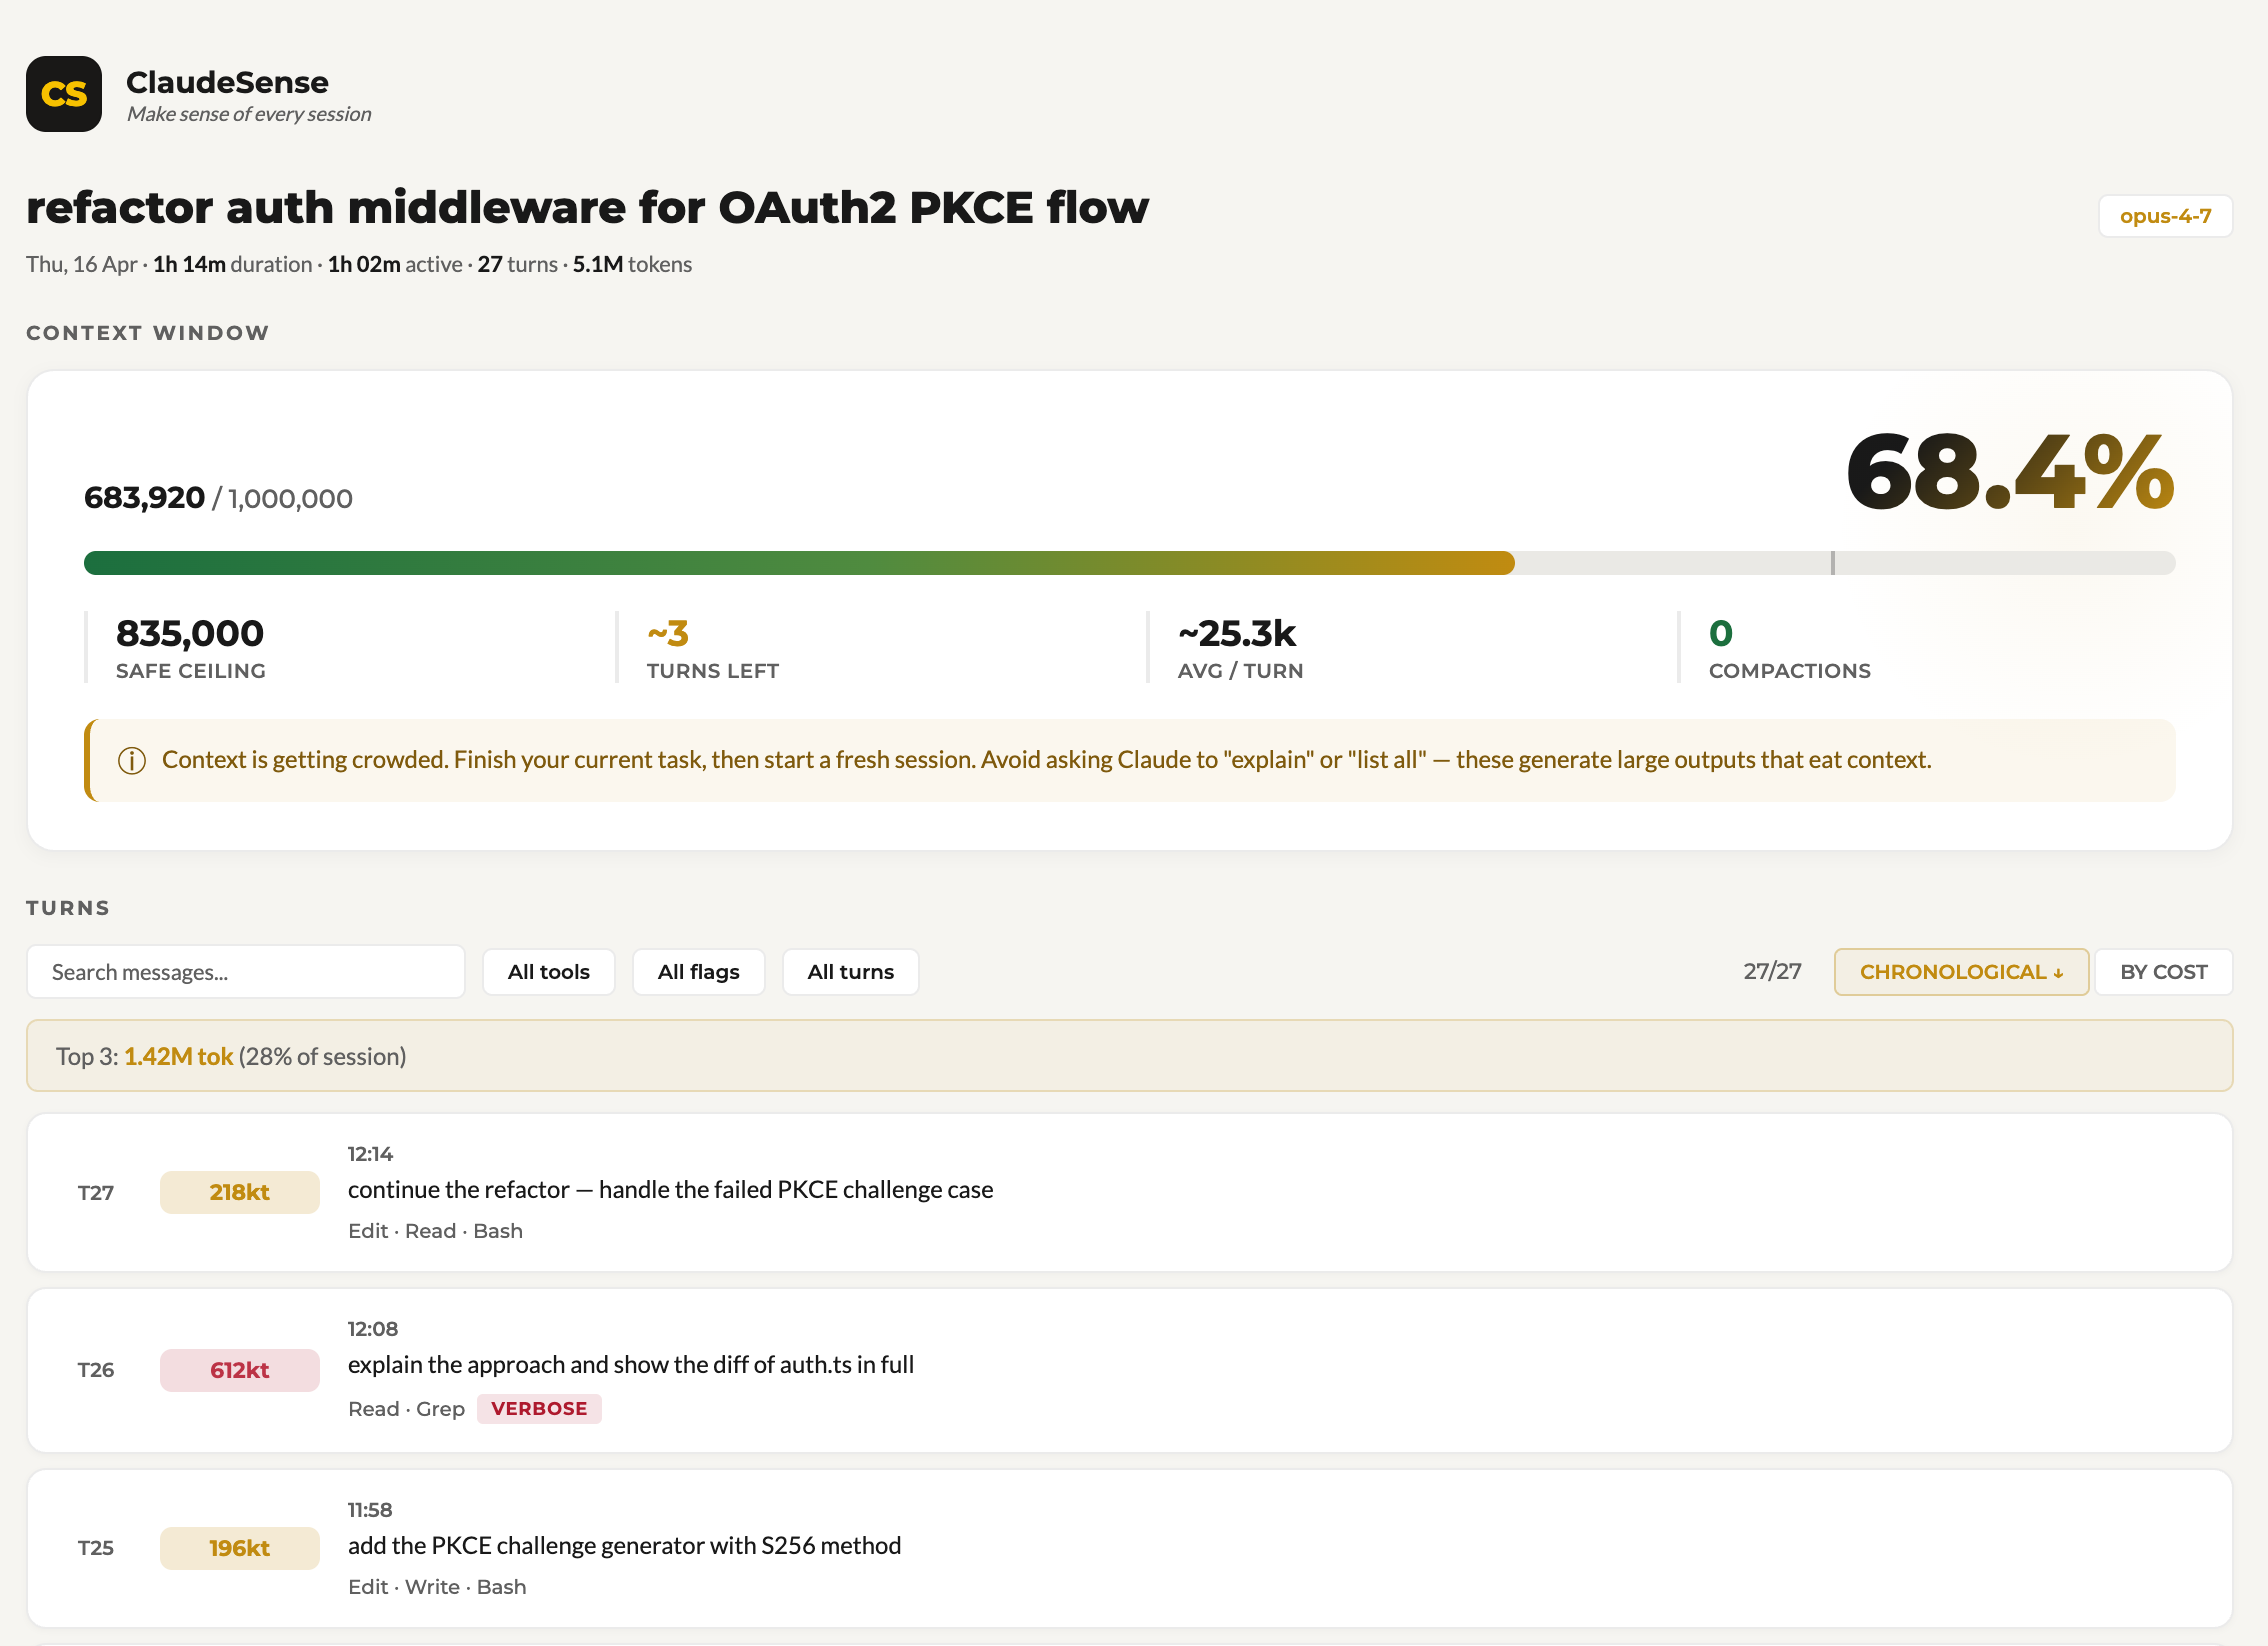
Context window + turn breakdown
Coaching in action
What it does
- Health score (A–F) for every session, graded on four factors: cache efficiency, correction rate, read-before-edit ratio, and context-window pressure.
- Coaching tips when Claude is editing without reading files first, when context is filling up, when you're retrying the same prompt, or when you're using a heavier model for routine tasks.
- Per-turn breakdown — cost, tokens, tools used, and flags for wasteful patterns (blind edits, verbose output, corrections).
- Activity overview — 90-day heatmap, week-over-week deltas, and which projects you're spending the most turns on.
- Status bar — always-on live context size and estimated cost for your active session.
- Live updates — the dashboard ticks as your session progresses. No refresh needed.
- Cost estimation — uses Anthropic's public API rates. Forward-compatible pricing table (new model versions fall back to sensible current-gen defaults instead of regressing to older, smaller-context rows).
Privacy — 100% offline
ClaudeSense never sends your data anywhere.
- Zero network calls in the extension code — no telemetry, no analytics, no cloud sync, no "phone home".
- The extension reads only your local
~/.claude/projects/ JSONL files (the ones Claude Code already writes to your disk).
- The only file it writes is
~/.claude/claudesense-pricing.json — a pricing table you can edit to match your preferred rates.
- No Anthropic tokens are consumed by ClaudeSense itself. It's a passive reader of files Claude Code has already produced.
How to use
- Install from the VS Code Marketplace.
- Open any workspace — ClaudeSense activates automatically.
- Look at the status bar for live
ctx: and est.~$ values.
- Click the Activity-Bar brain icon or run "Open ClaudeSense Dashboard" from the command palette to see the full panel.
- Click the ClaudeSense logo in the sidebar (or the Overview pill above the session list) to switch to the cross-session dashboard — heatmap, weekly deltas, project focus.
Customizing pricing
The extension creates ~/.claude/claudesense-pricing.json on first run. Edit that file to change the rates used for cost estimates. Rates are per million tokens. Model lookup uses longest-prefix match, so claude-opus-4-7 finds its exact row, and unknown future models fall back to the closest family-prefix entry.
Cost numbers shown in the UI are estimates. They don't apply to Claude Pro/Max subscriptions, Bedrock, or Vertex — those bill differently.
Updates
Updates arrive through VS Code's built-in extension update mechanism — no external links, no manual downloads. When a new version is published, you'll see the standard update badge on the Extensions icon.
See CHANGELOG.md for what shipped in each release.
Reporting a bug
Run "ClaudeSense: Report a bug" from the command palette, or click the "Report a bug" link in the dashboard footer. Either action gives you a prefilled diagnostic that you can copy to clipboard or send via your default email client.
Built by Ishdeep S Sahni.