Resource Lens


Shows CPU, memory, and GPU usage in the VS Code status bar.
Screenshots
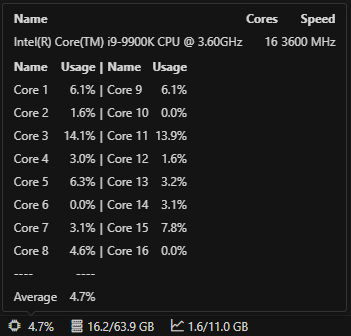
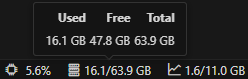
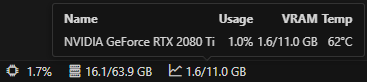
Hover over each status bar item for a compact tooltip with the most useful details.
CPU
RAM
VRAM
GPU support
Only NVIDIA GPUs are supported, via nvidia-smi. If nvidia-smi isn't
found, the GPU item is hidden automatically. Multiple NVIDIA GPUs are shown as
aggregated VRAM usage in the status bar, with per-GPU details in the tooltip.
Tested on Docker (Linux) with an RTX 2080 Ti.
Install
Search for Resource Lens in the Extensions panel.
Settings
{
  // Update interval in ms (minimum 500)
  "resourceLens.updateIntervalMs": 1000,
  "resourceLens.showCpu": true,
  "resourceLens.showMemory": true,
  "resourceLens.showGpu": true,
}
To reduce update frequency:
{ "resourceLens.updateIntervalMs": 5000 }
To show CPU only:
{
  "resourceLens.showMemory": false,
  "resourceLens.showGpu": false,
}
Known issues
- Tooltip content may flicker or briefly disappear while values update. This is a
VS Code limitation and
not specific to this extension.
License
Apache-2.0