Simple Code Explorer
Visualize Control Flow Graph (CFG) for the Simple language directly in VS Code.
Features
- 🔍 One‑click CFG generation – click the
Show CFG button in the editor toolbar or run the command from the Command Palette.
- 🖱️ Interactive graph – zoom, pan, and reset with mouse wheel + drag (powered by
panzoom).
- 💾 Export – download the graph as SVG (vector image) or DOT (Graphviz source).
- 🎨 Flexible rendering – uses XSLT transformations combined with Viz.js to produce clean, customizable SVG graphs.
- ⚡ Cross‑platform – includes compiled compilers for Windows (x64/ARM64) and Linux (x64/ARM64).
Requirements
- VS Code
^1.125.0
- A working
s-language extension (or built‑in support) – this extension relies on the language ID s-language for file association.
Usage
- Open any
.slang or .simple file.
- Click the
Show CFG button in the top‑right corner of the editor.
- A new panel will open with the interactive control‑flow graph.
- Use your mouse to:
- Zoom – scroll wheel.
- Pan – drag the graph.
- Reset – double‑click the graph.
- To download the graph, use the buttons in the viewer:
Download SVG – saves the current view as a vector graphic.Download DOT – saves the raw DOT source (for use with Graphviz).
Example
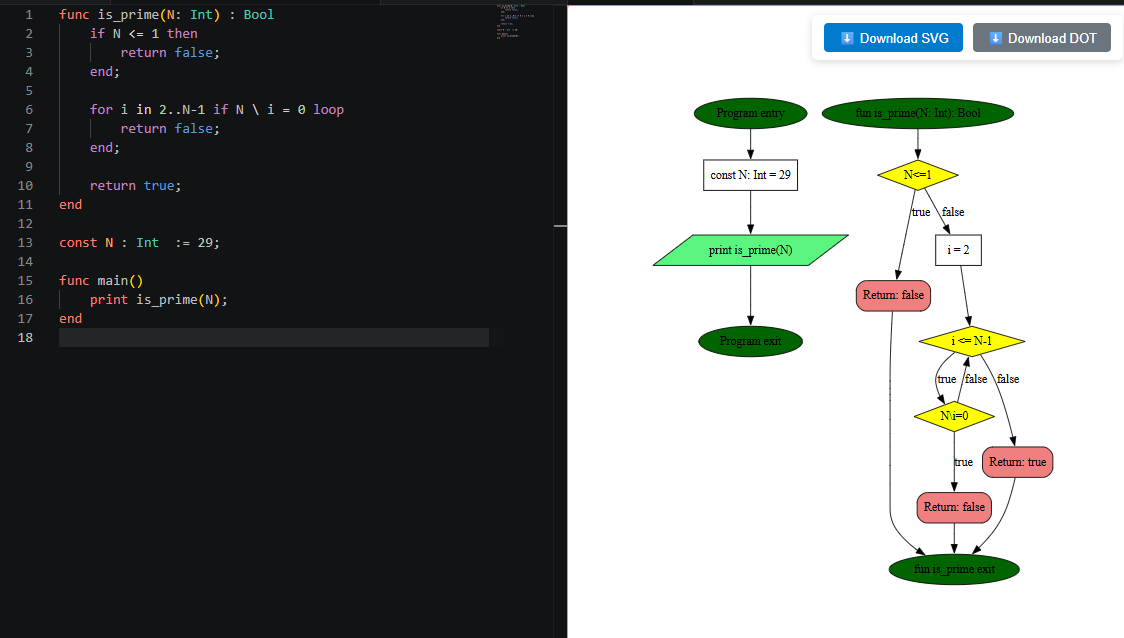
Here’s an example CFG generated from a simple pow function:
Commands
Simple: Show CFG – generates and displays the CFG for the active file.
Extension Settings
This extension does not add any user‑configurable settings yet.
Known Issues
- Large graphs may render slowly; this is due to the underlying Graphviz engine.
License
MIT
| |