racevis
Visualize Go race conditions directly in VS Code — without leaving your editor.
go test -race tells you that a race exists. racevis shows you exactly when two goroutines collided, which memory address they fought over, and the source lines that caused it — rendered as an ECG-style timeline alongside your code.
What you get
ECG timeline — see goroutines collide in real time
Each goroutine is a lane. Green = running safely. Red diamond = the moment two goroutines touched the same memory address simultaneously.
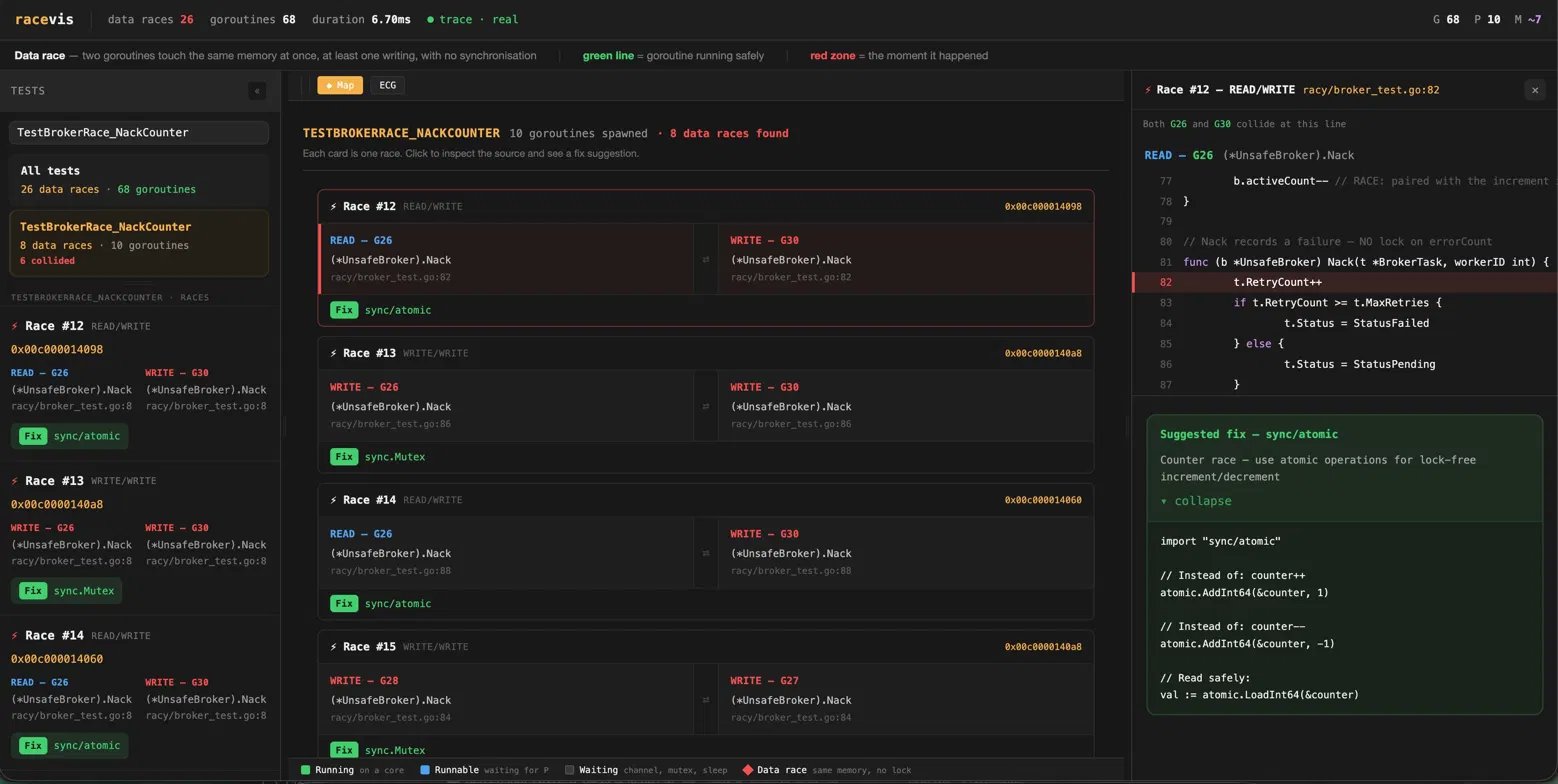
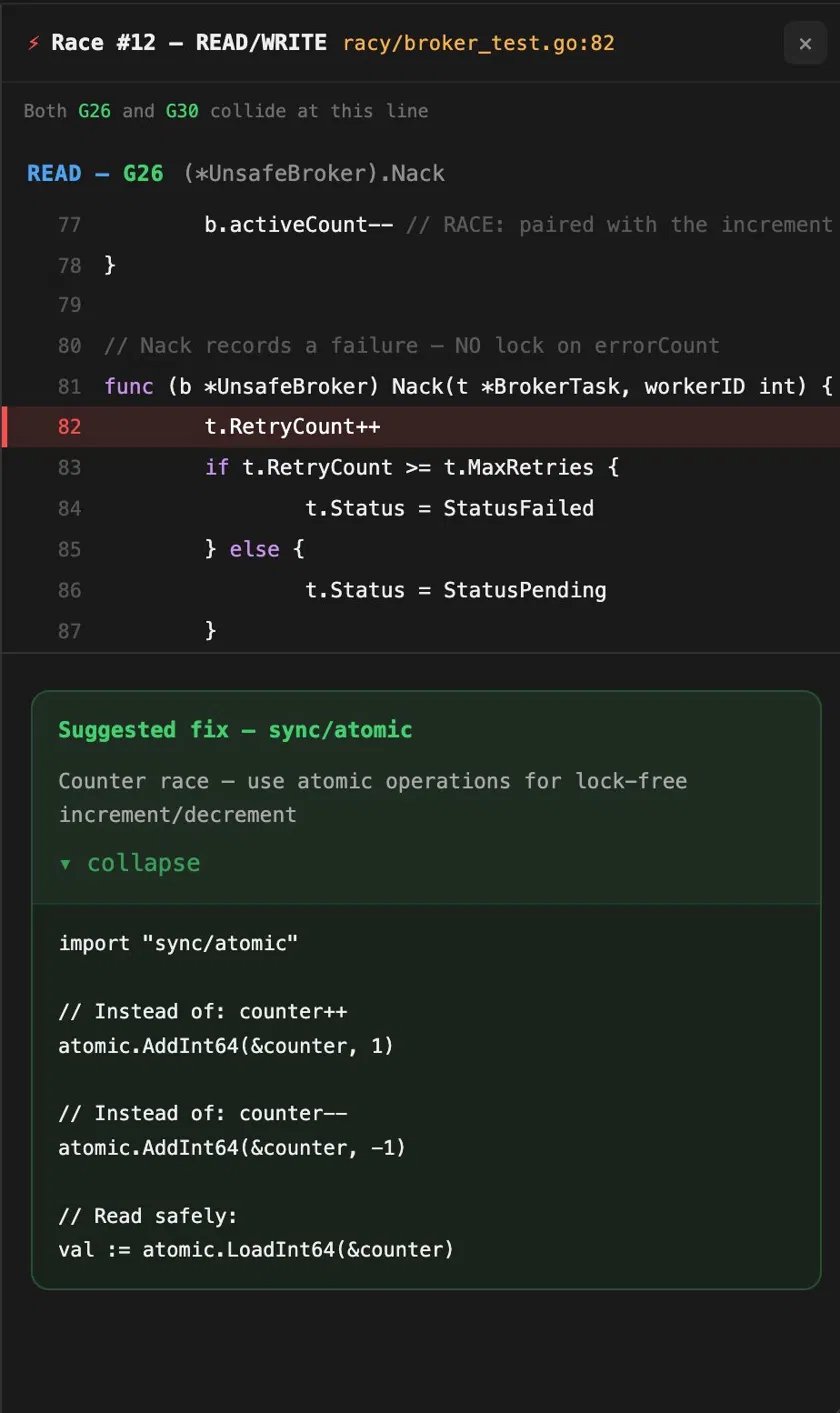
Source panel — jump straight to the race
Click any collision zone and see the exact lines from both goroutines, highlighted side by side with a suggested fix.
Usage
- Open any Go project in VS Code
- Open a
.go file in the package you want to inspect
Cmd+Shift+P → racevis: Analyze current package- The ECG timeline opens in the right panel
- Click any red collision diamond to inspect the race
The status bar shows ⚡ racevis at all times — click it to re-run.
If the active package has no _test.go files, racevis discovers packages with tests using go list ./... and asks you to pick one.
The test list shows visualized tests only. A test appears when a race event stack involved that TestXxx, or when the runtime trace has a goroutine creation stack containing that TestXxx. Plain synchronous tests with no race evidence are intentionally omitted.
Requirements
The racevis binary must be installed and on your PATH:
go install github.com/bramakrishna16/racevis@latest
Verify:
which racevis
# /Users/<you>/go/bin/racevis
Settings
| Setting |
Default |
Description |
racevis.binaryPath |
racevis |
Full path to the racevis binary. Set this if racevis is not on PATH. |
racevis.target |
auto |
Infer a package with _test.go files from the active Go file. Set internal/broker or another package path to override. |
How it works
racevis runs a two-pass pipeline:
- Pass 1 —
go test -race captures race detector output (goroutine IDs, memory addresses, stack traces)
- Pass 2 —
go test -trace captures the scheduler trace (when each goroutine ran, waited, and blocked)
- Correlate — joins both on goroutine ID to produce a Timeline
- Render — the ECG timeline is injected into a self-contained webview — no server, no port, fully offline
Green lanes mean trace-visible goroutines ran without race detector findings. Red diamonds mean the race detector observed a real contested memory access.
Debugging
If something goes wrong, check the output panel:
Cmd+Shift+P → racevis: Show output log
All binary stdout/stderr streams there in real time.
Source