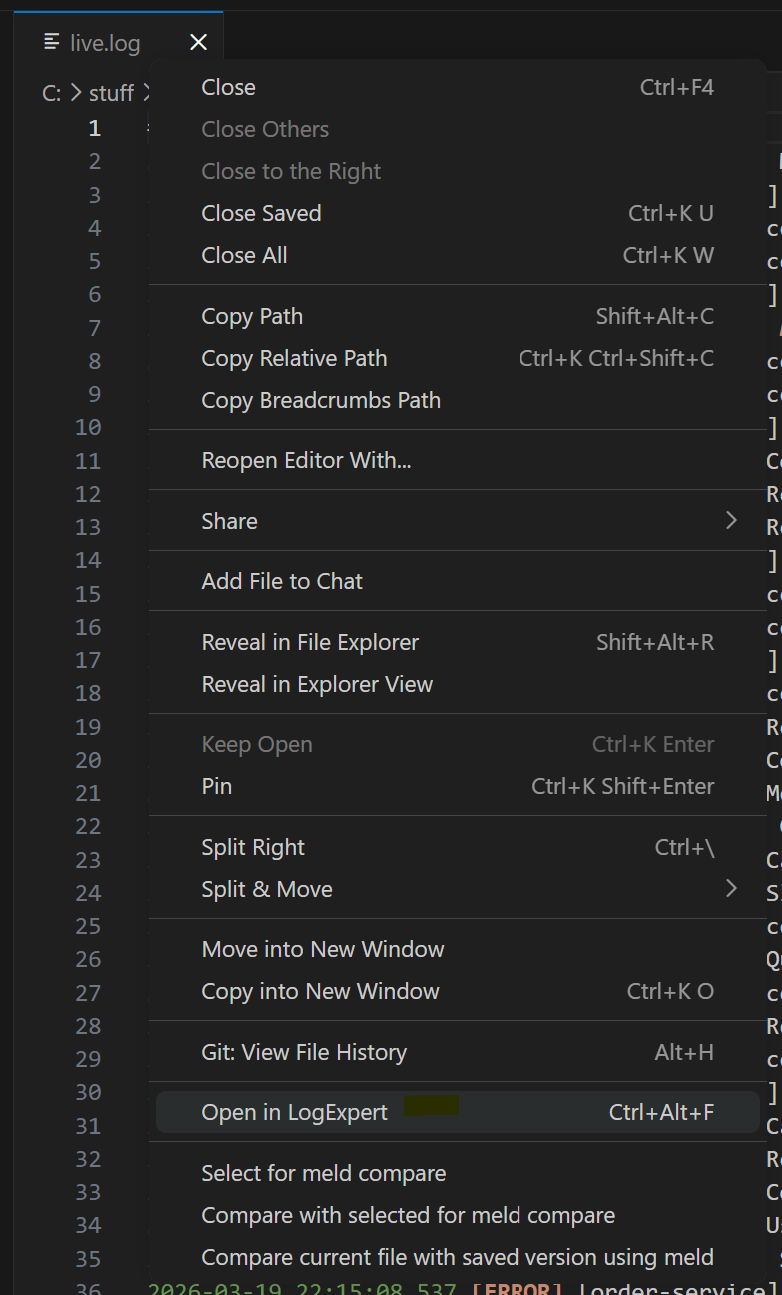
LogExpertFast log analysis for VS Code. Filter instantly, chain filters across named tabs, parse columns (auto-detect, CSV, TSV, Syslog), stream live with Follow Tail, highlight by severity with per-file private rules, save filtered results with column formatting — all without leaving the editor. Installation Launch VS Code Quick Open ( Ctrl+P), paste the following command, and press enter.Copied to clipboard |
LogExpertA fast, LogExpert-inspired log analysis extension for VS Code — built as an independent personal developer tool to solve real log-viewing workflow needs. Open any log file, filter it instantly, watch it live, chain filters across tabs, and bookmark positions — all without leaving the editor. Opening LogExpertThree ways to open LogExpert for any file:
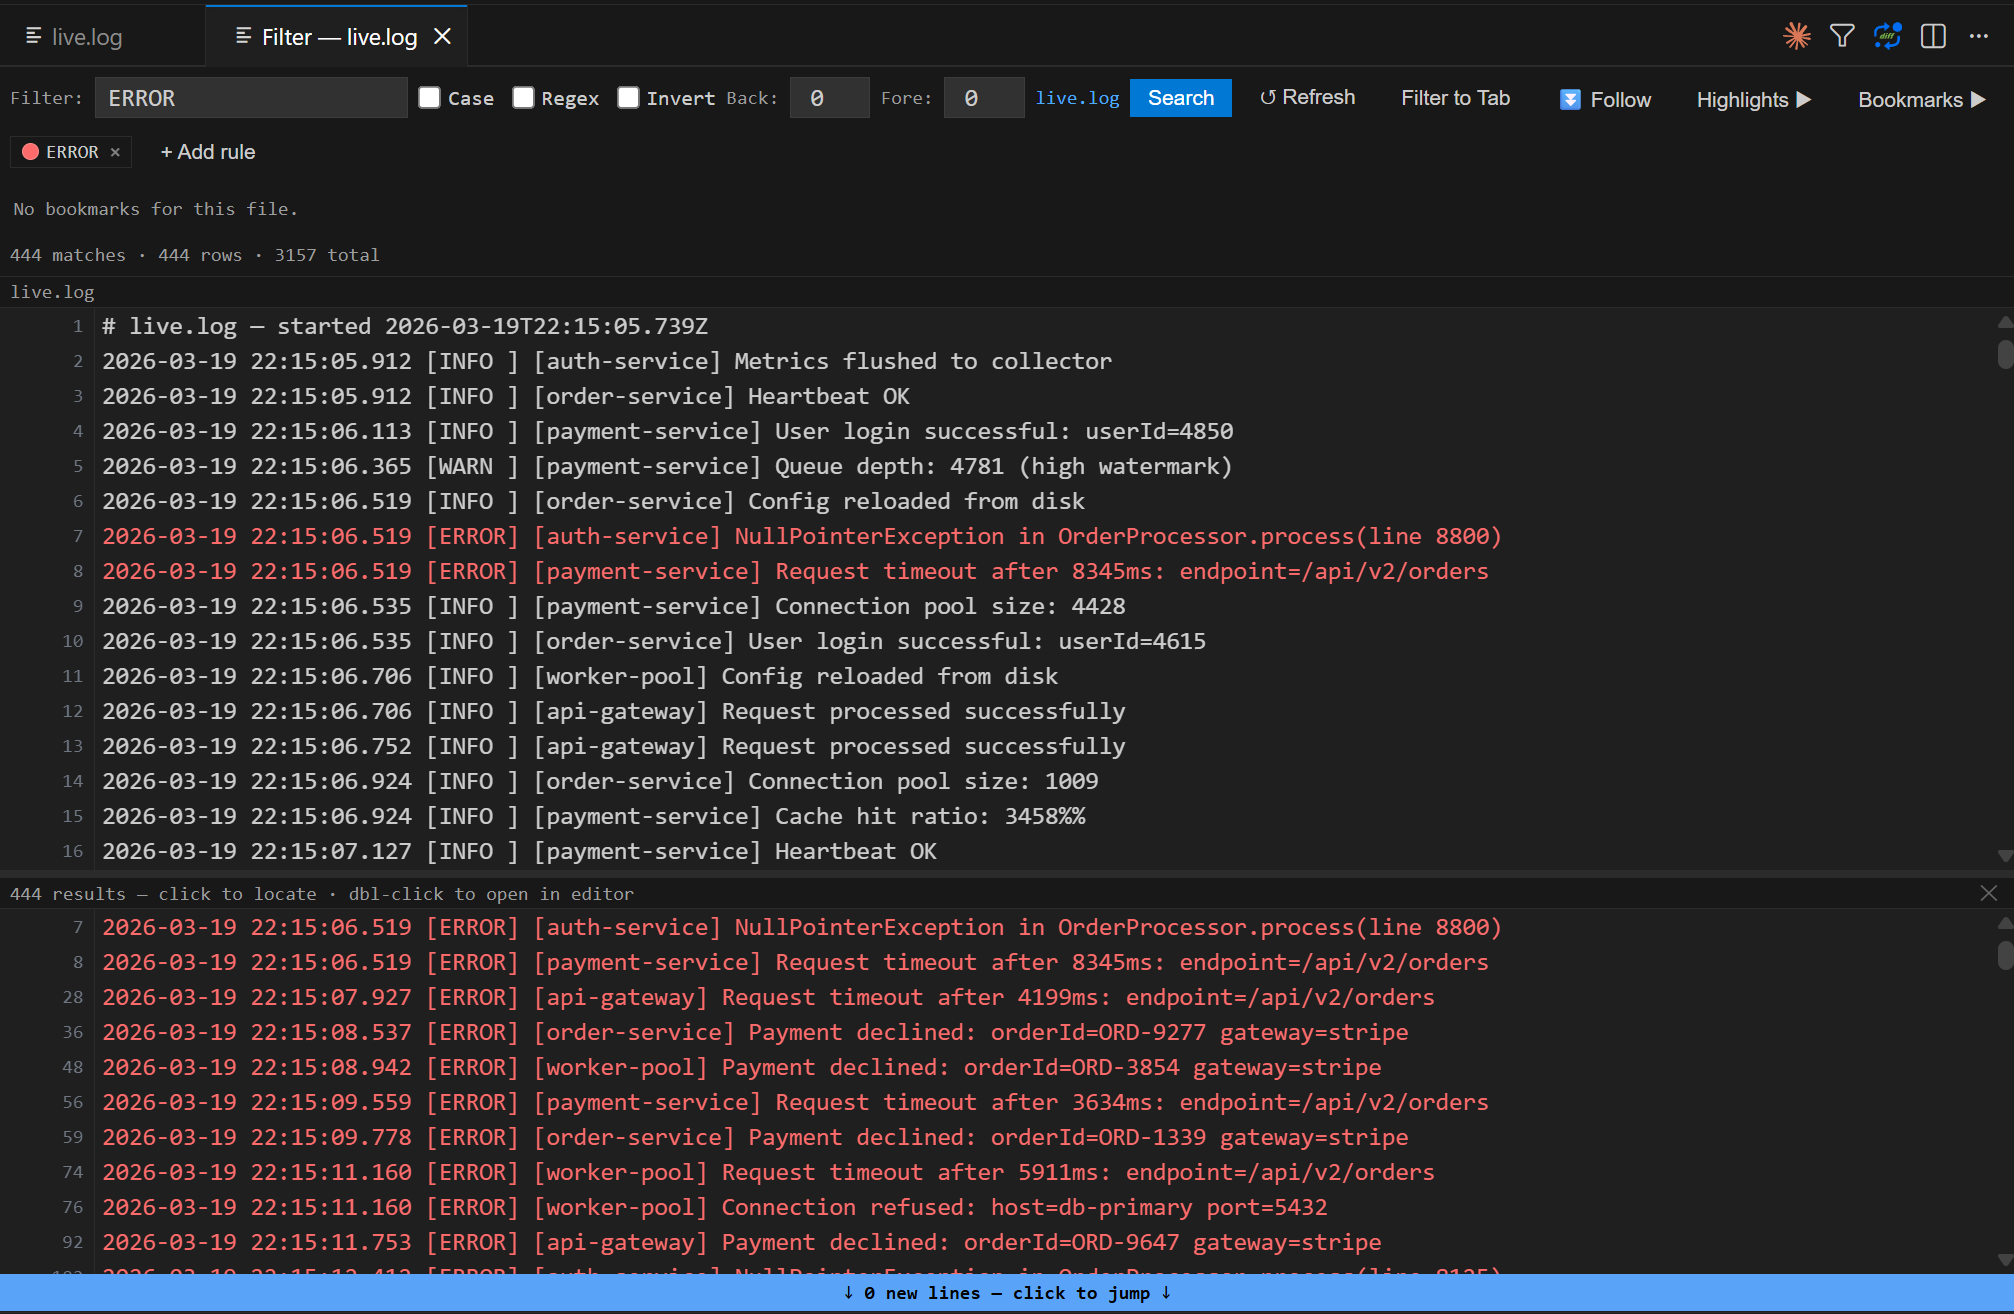
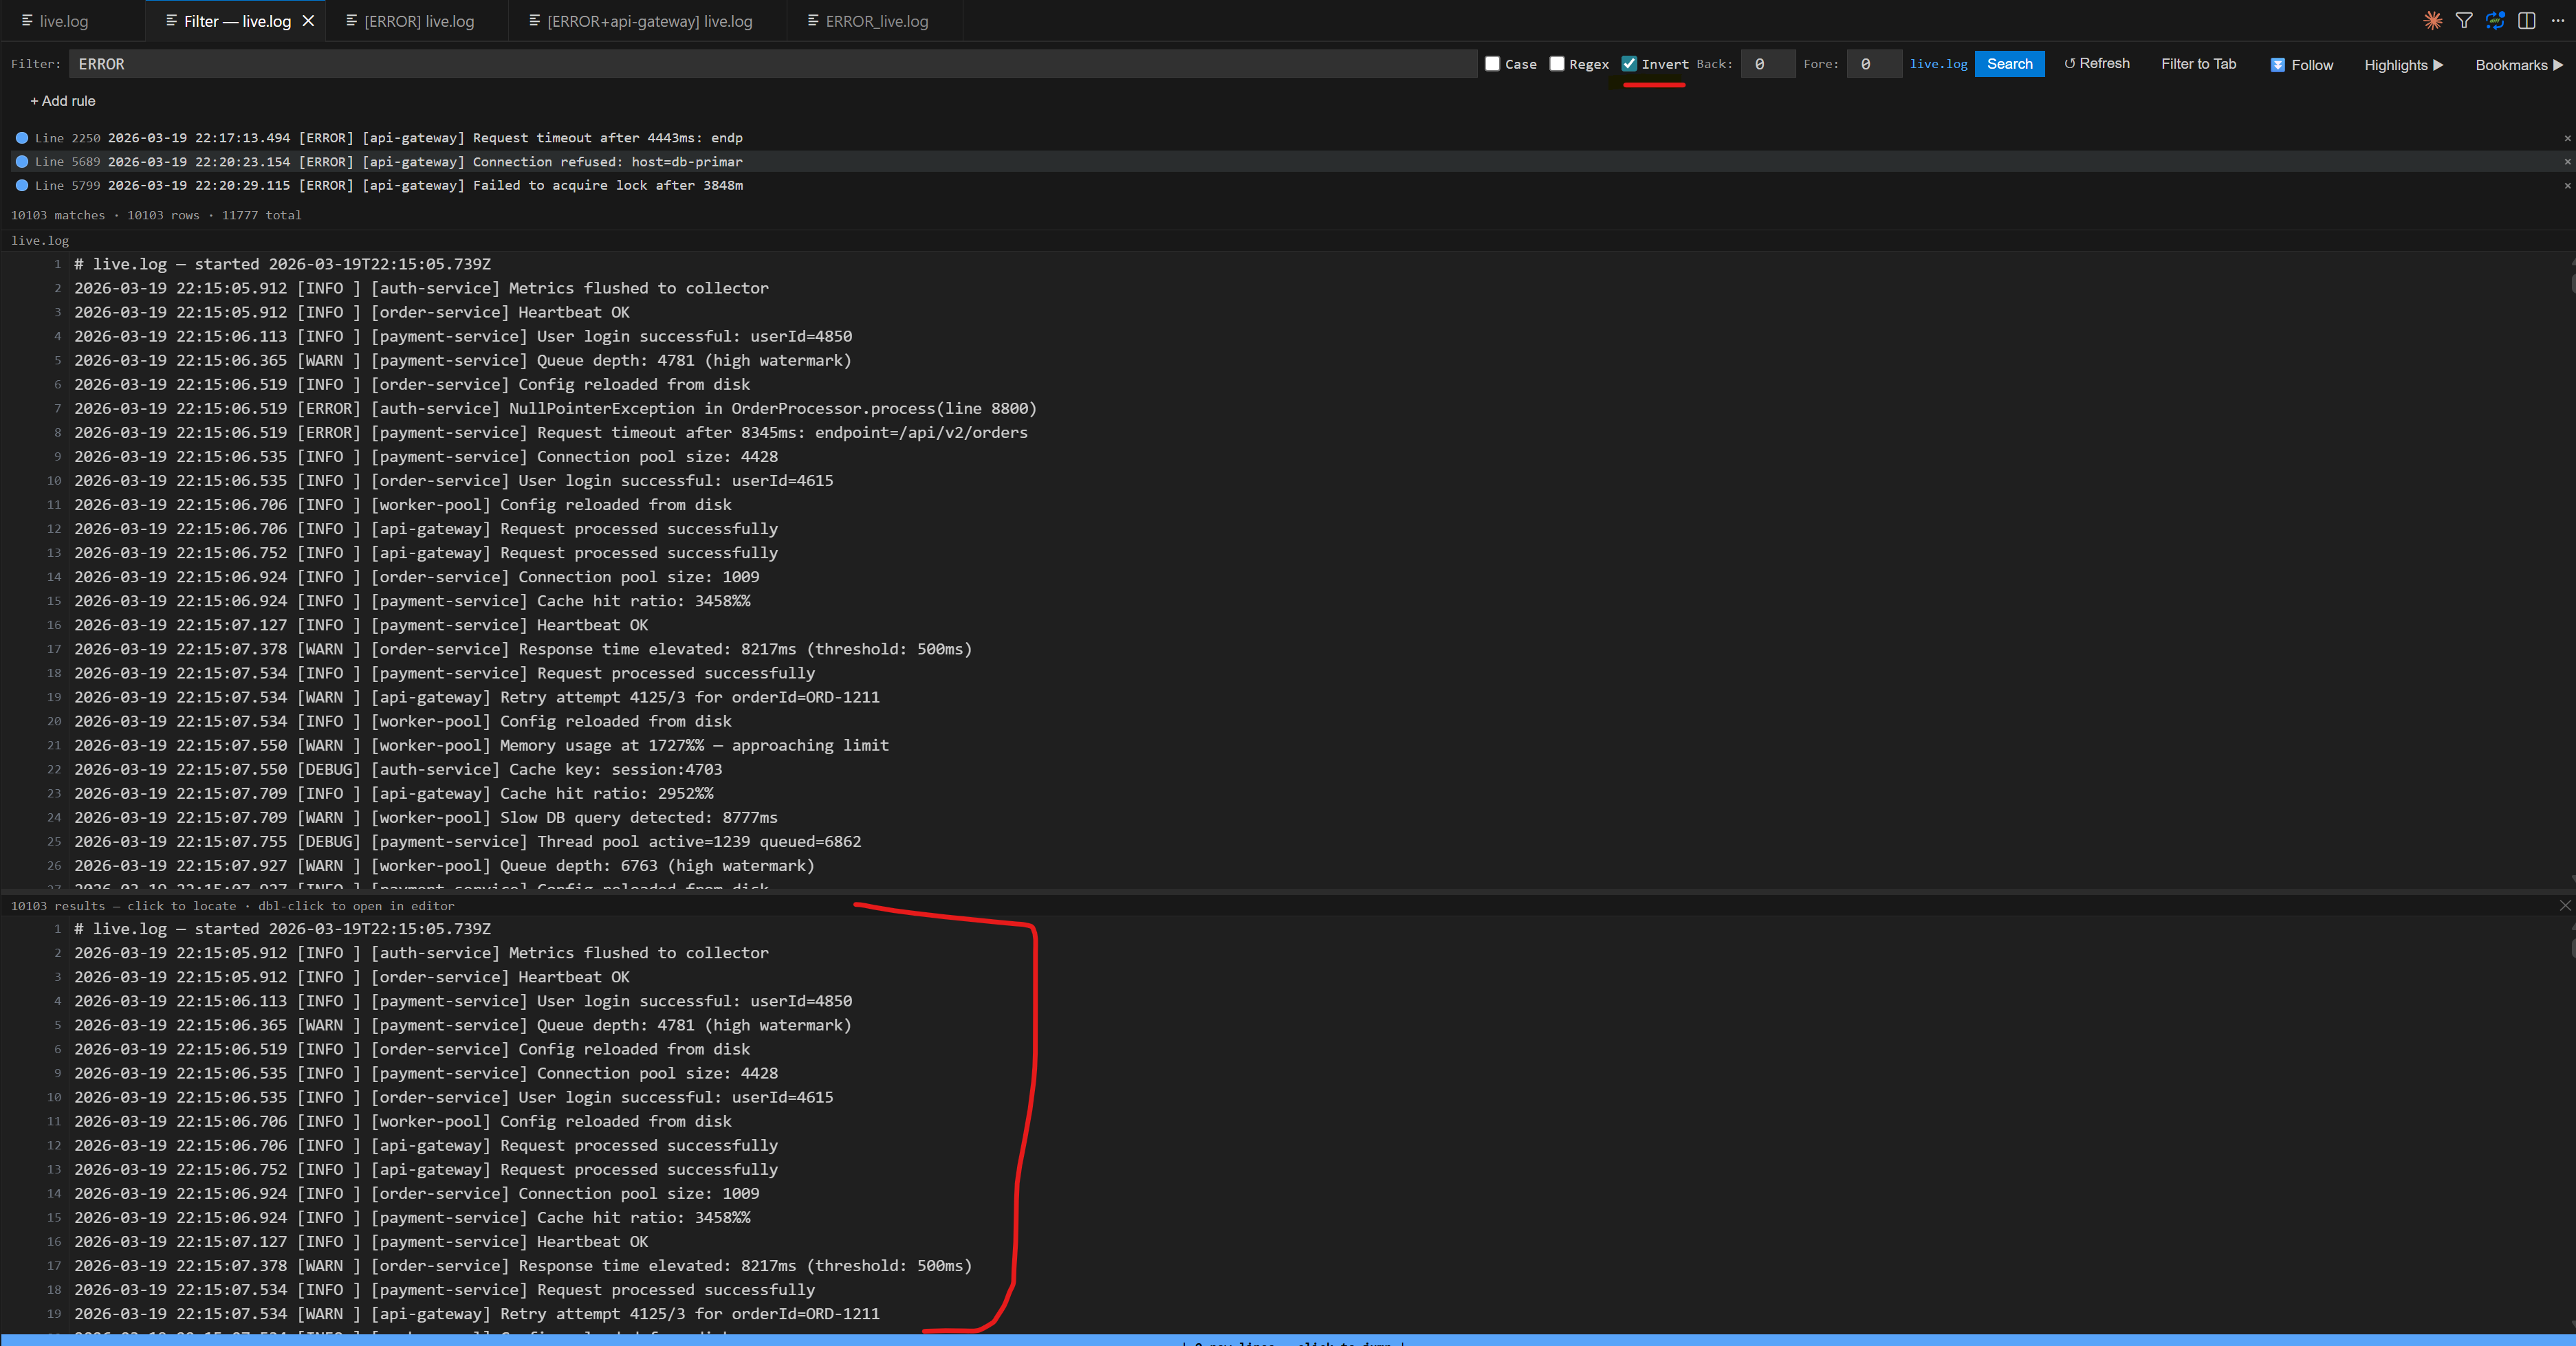
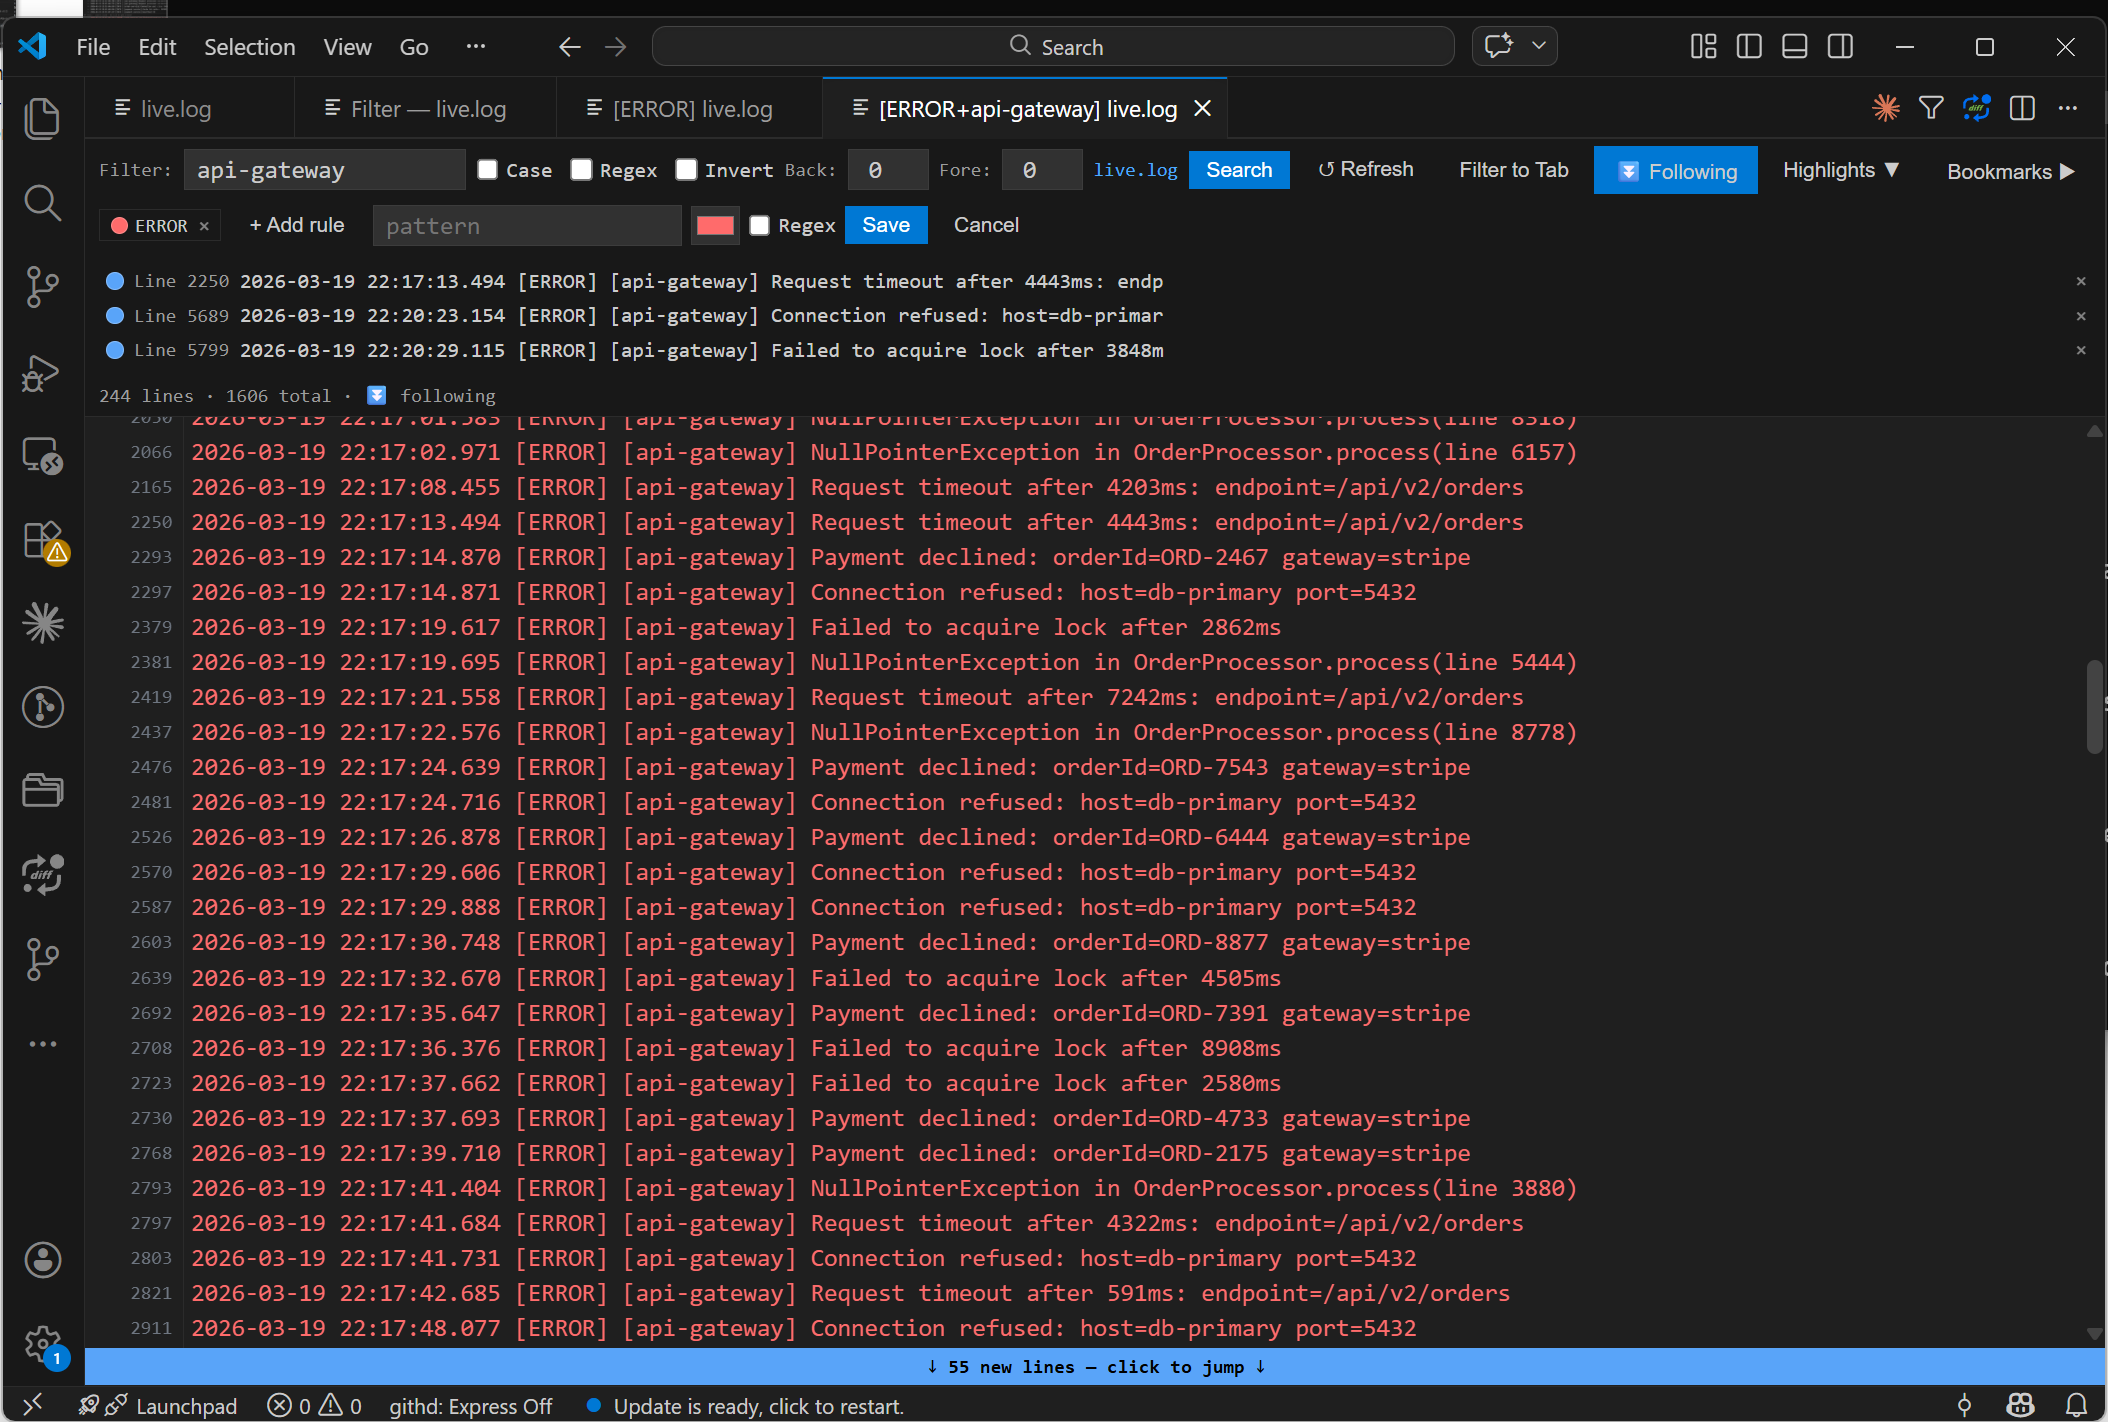
Filter Panel + Auto Split ViewType a pattern and press Search (or Enter). Matching lines appear instantly, coloured by severity. A split view opens automatically — full file on top, filtered results below. Click any result to flash it in context. Double-click to open in the editor.
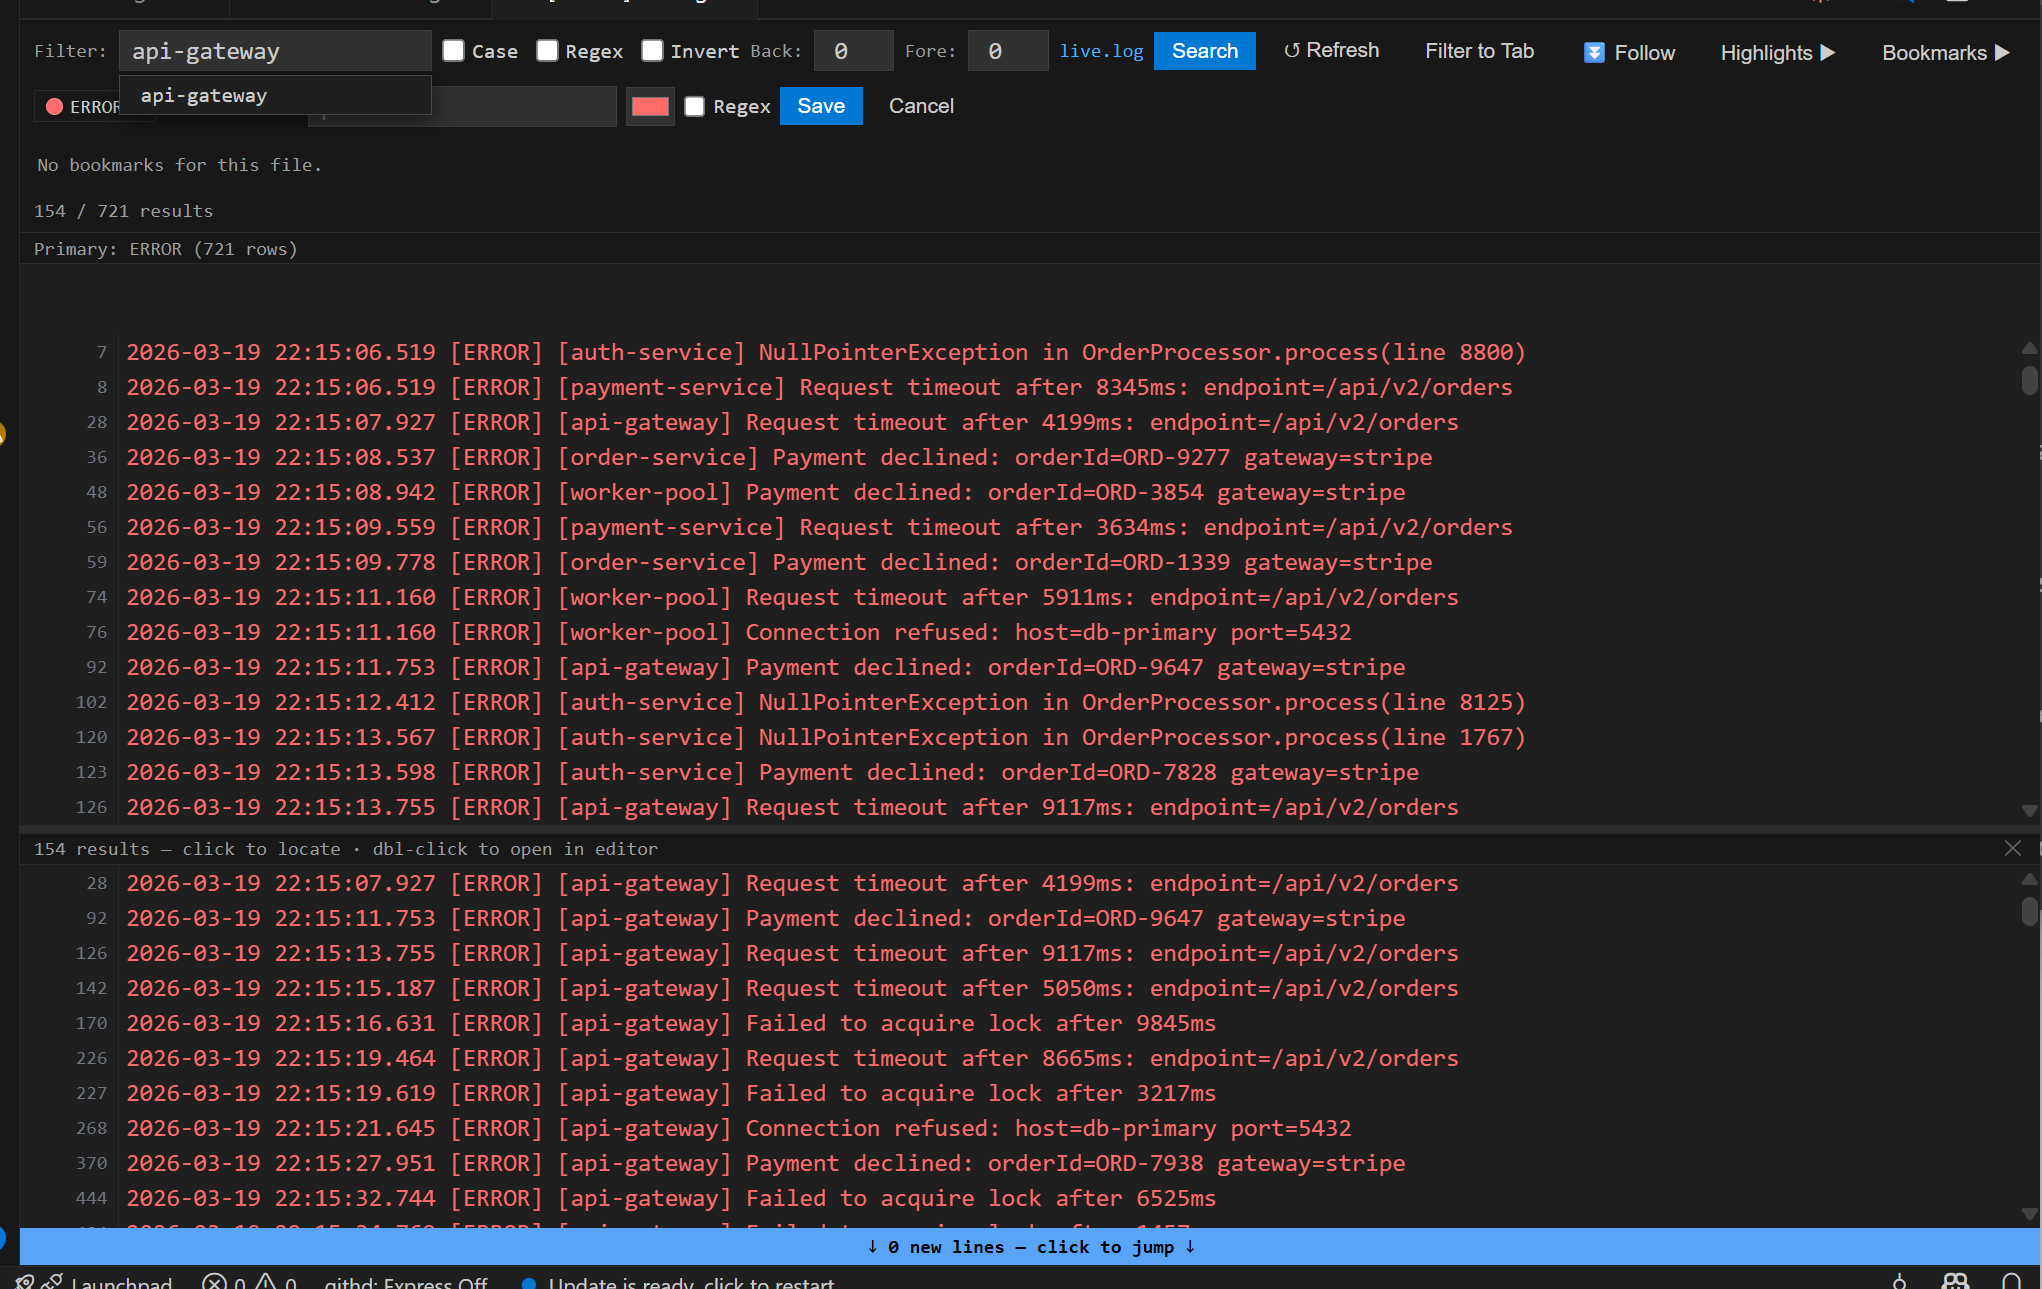
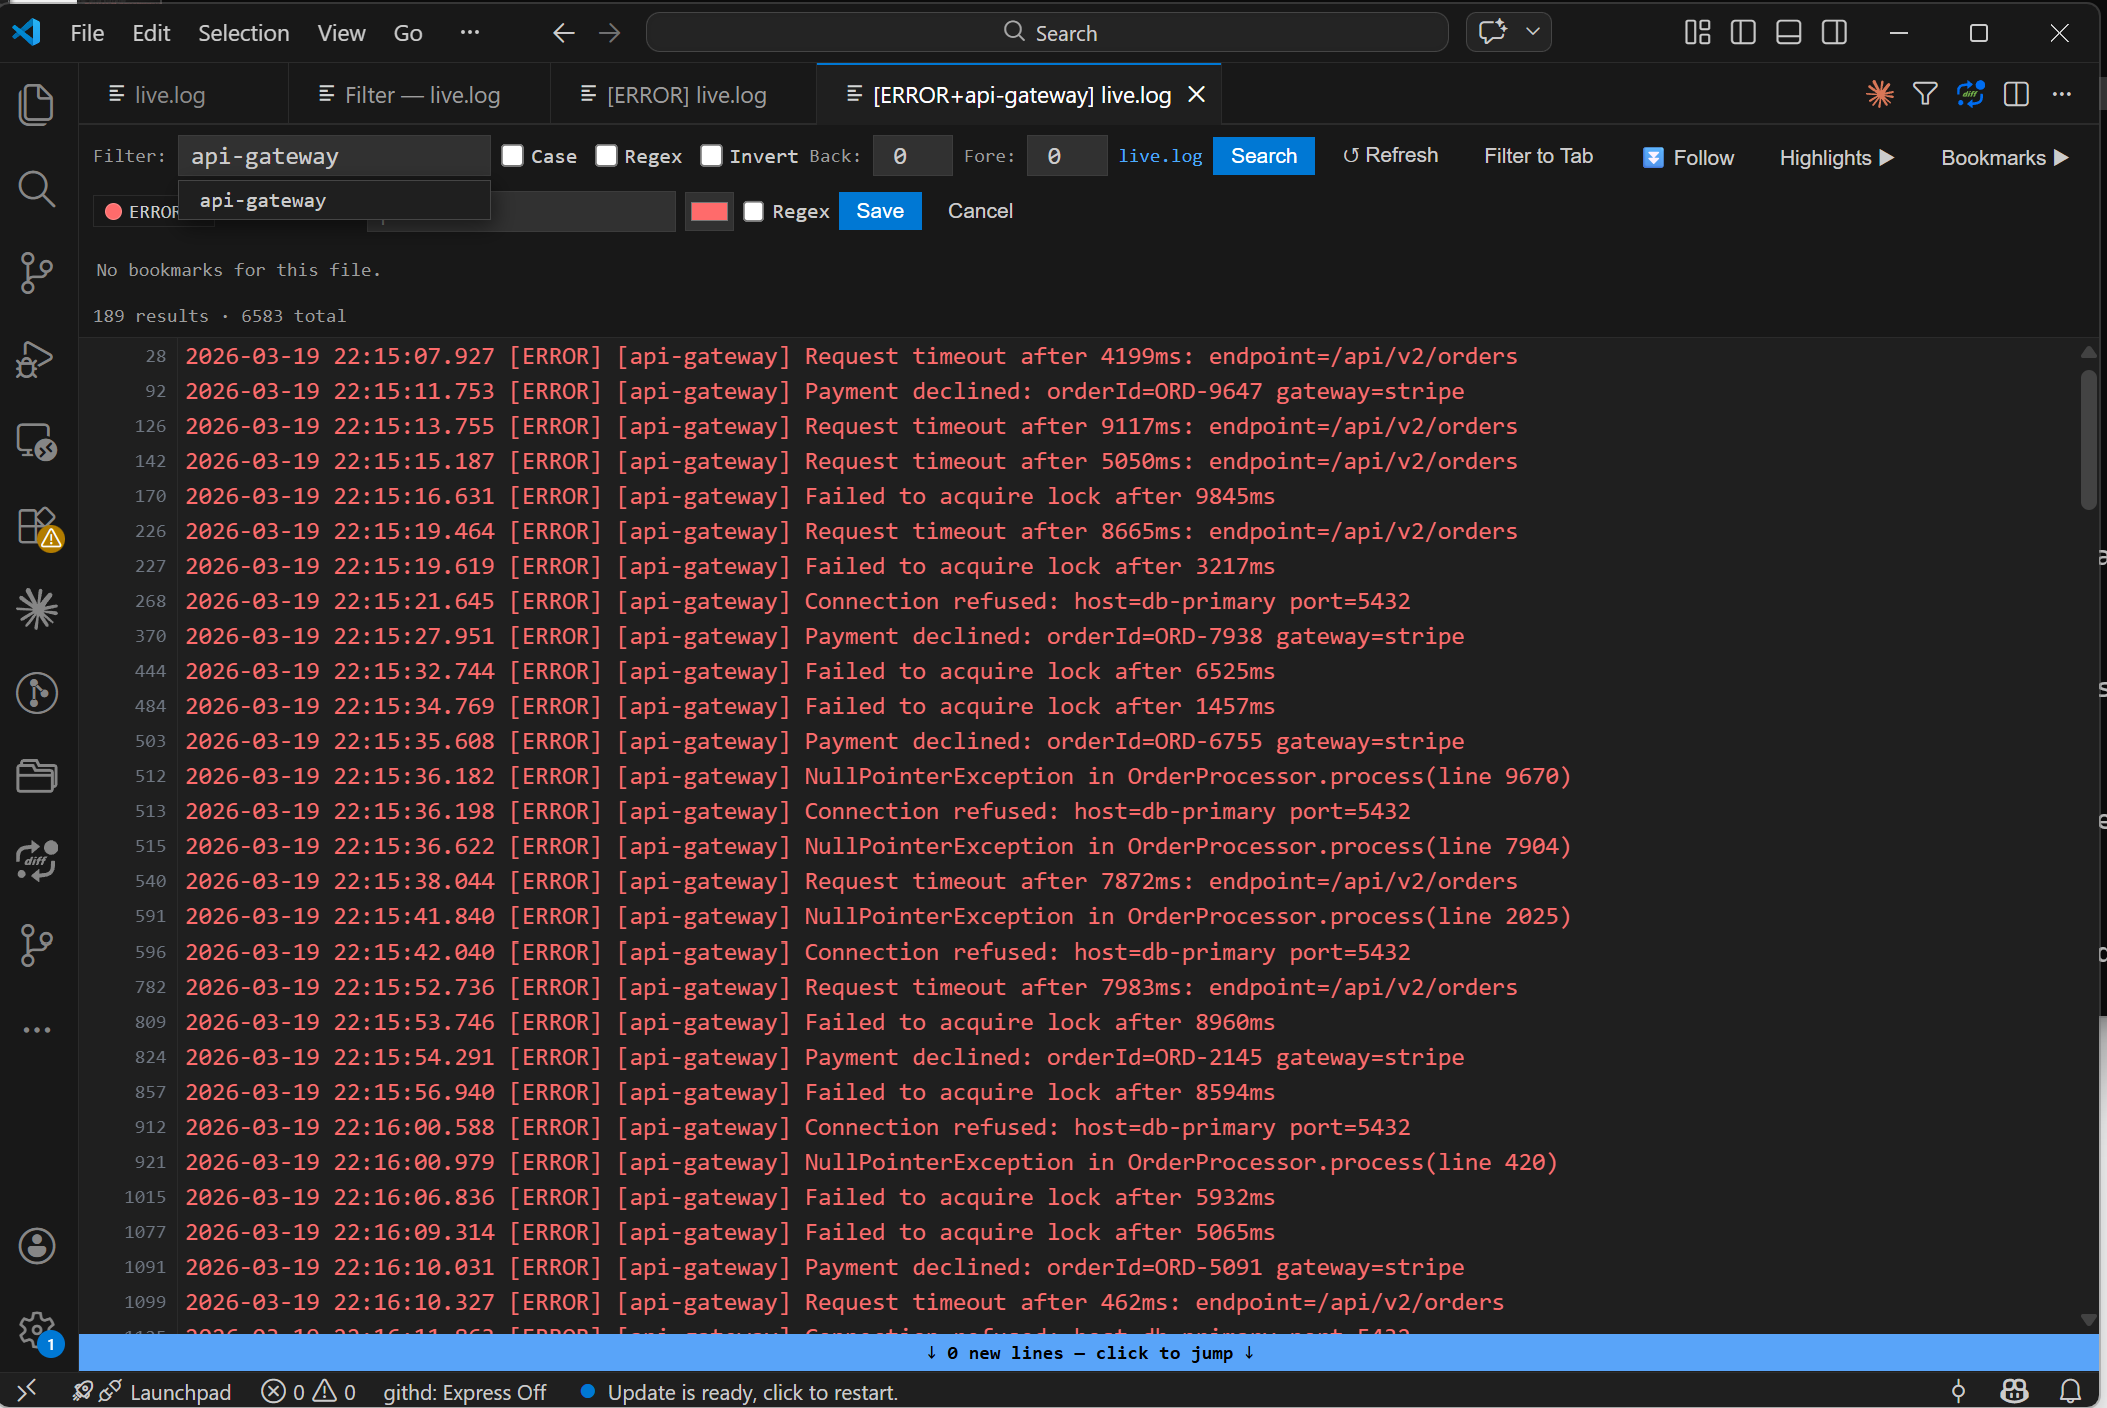
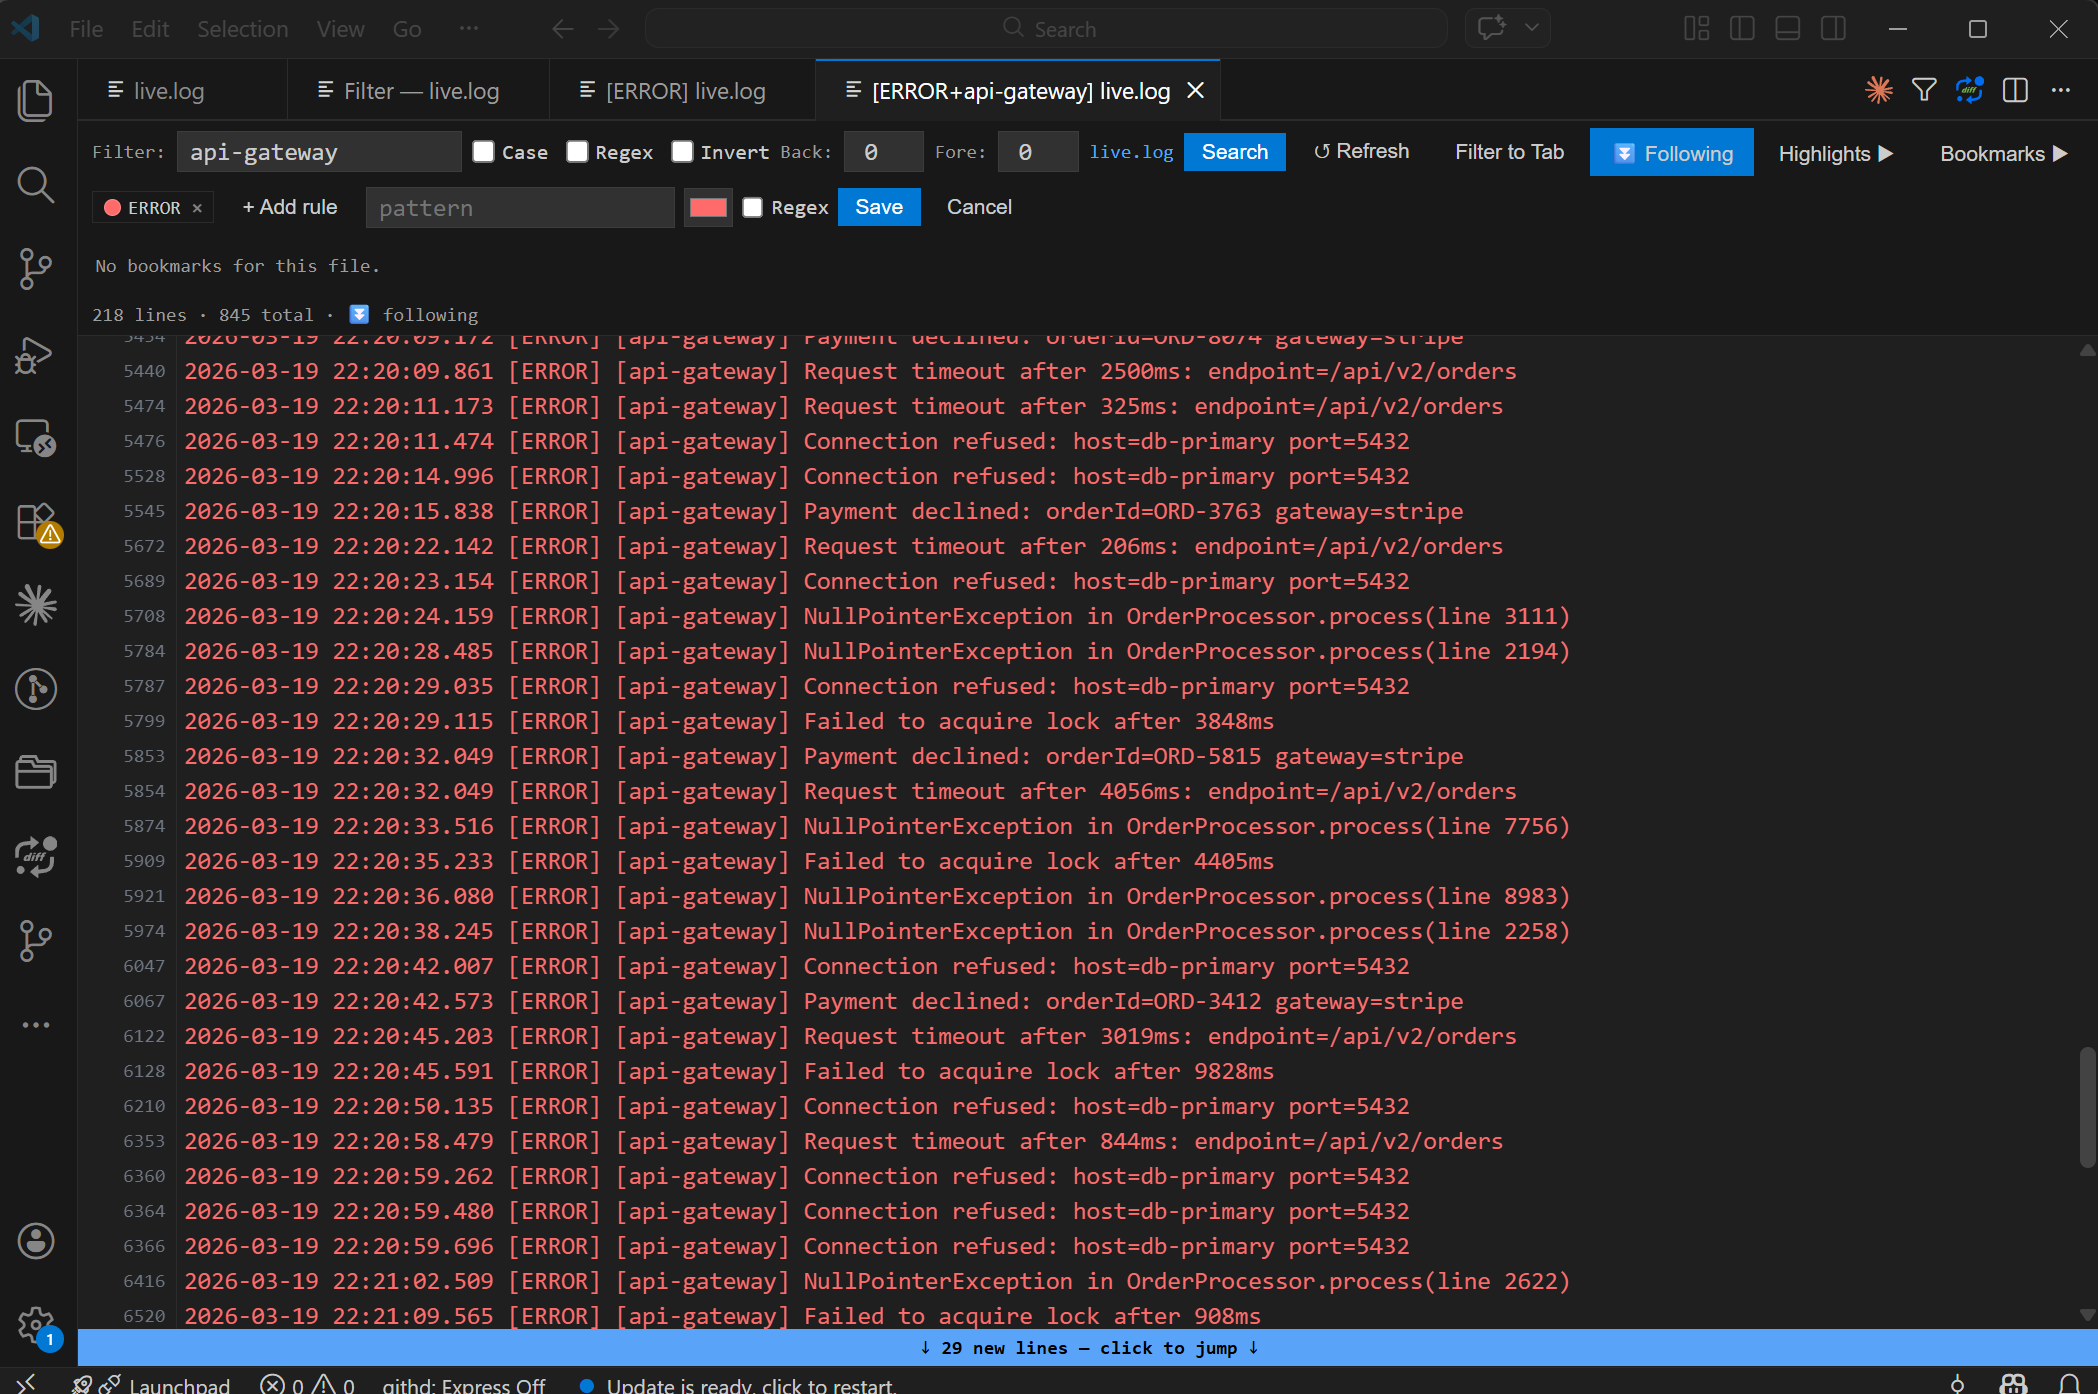
Close the results panel with ✕ when done. Filter to Tab — Named TabsClick Filter to Tab to open the current filter results in a dedicated tab. The tab is named after the active filter — Open multiple filtered tabs simultaneously, each streaming live independently. Nested / Chained FilteringThis is the standout feature. From inside a filtered tab ( The chain can go as deep as needed. Every tab inherits the full chain and applies it to live incoming lines.
Example workflow:
All three update independently as the log file grows.
Live Follow TailEnable ⏬ Follow to stream new lines automatically as the file grows. All active chain filters are applied to incoming lines — only matching lines appear. When you scroll up to investigate, a badge shows how many new matching lines have arrived. Click it to jump back to the bottom.
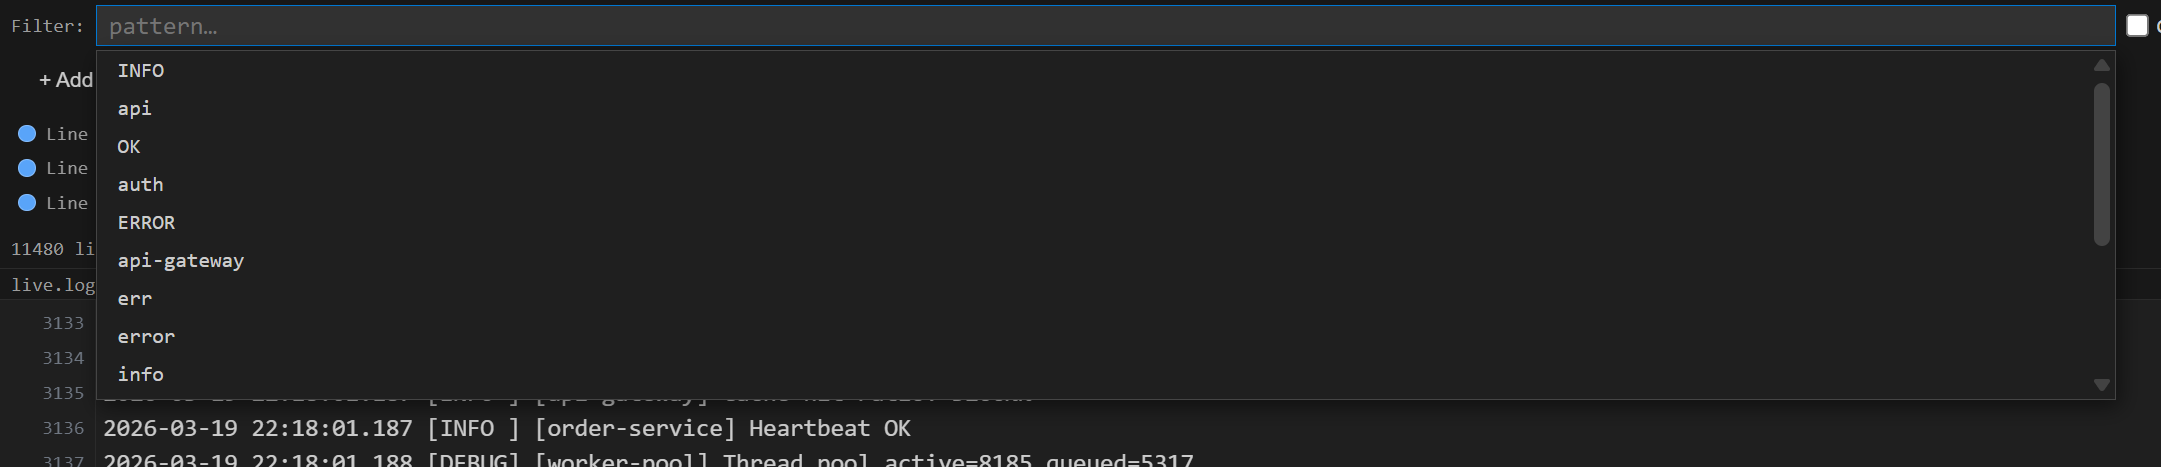
Filter HistoryClick the filter input to see your last 20 searches in a styled dropdown. Navigate with arrow keys, press Enter to select.
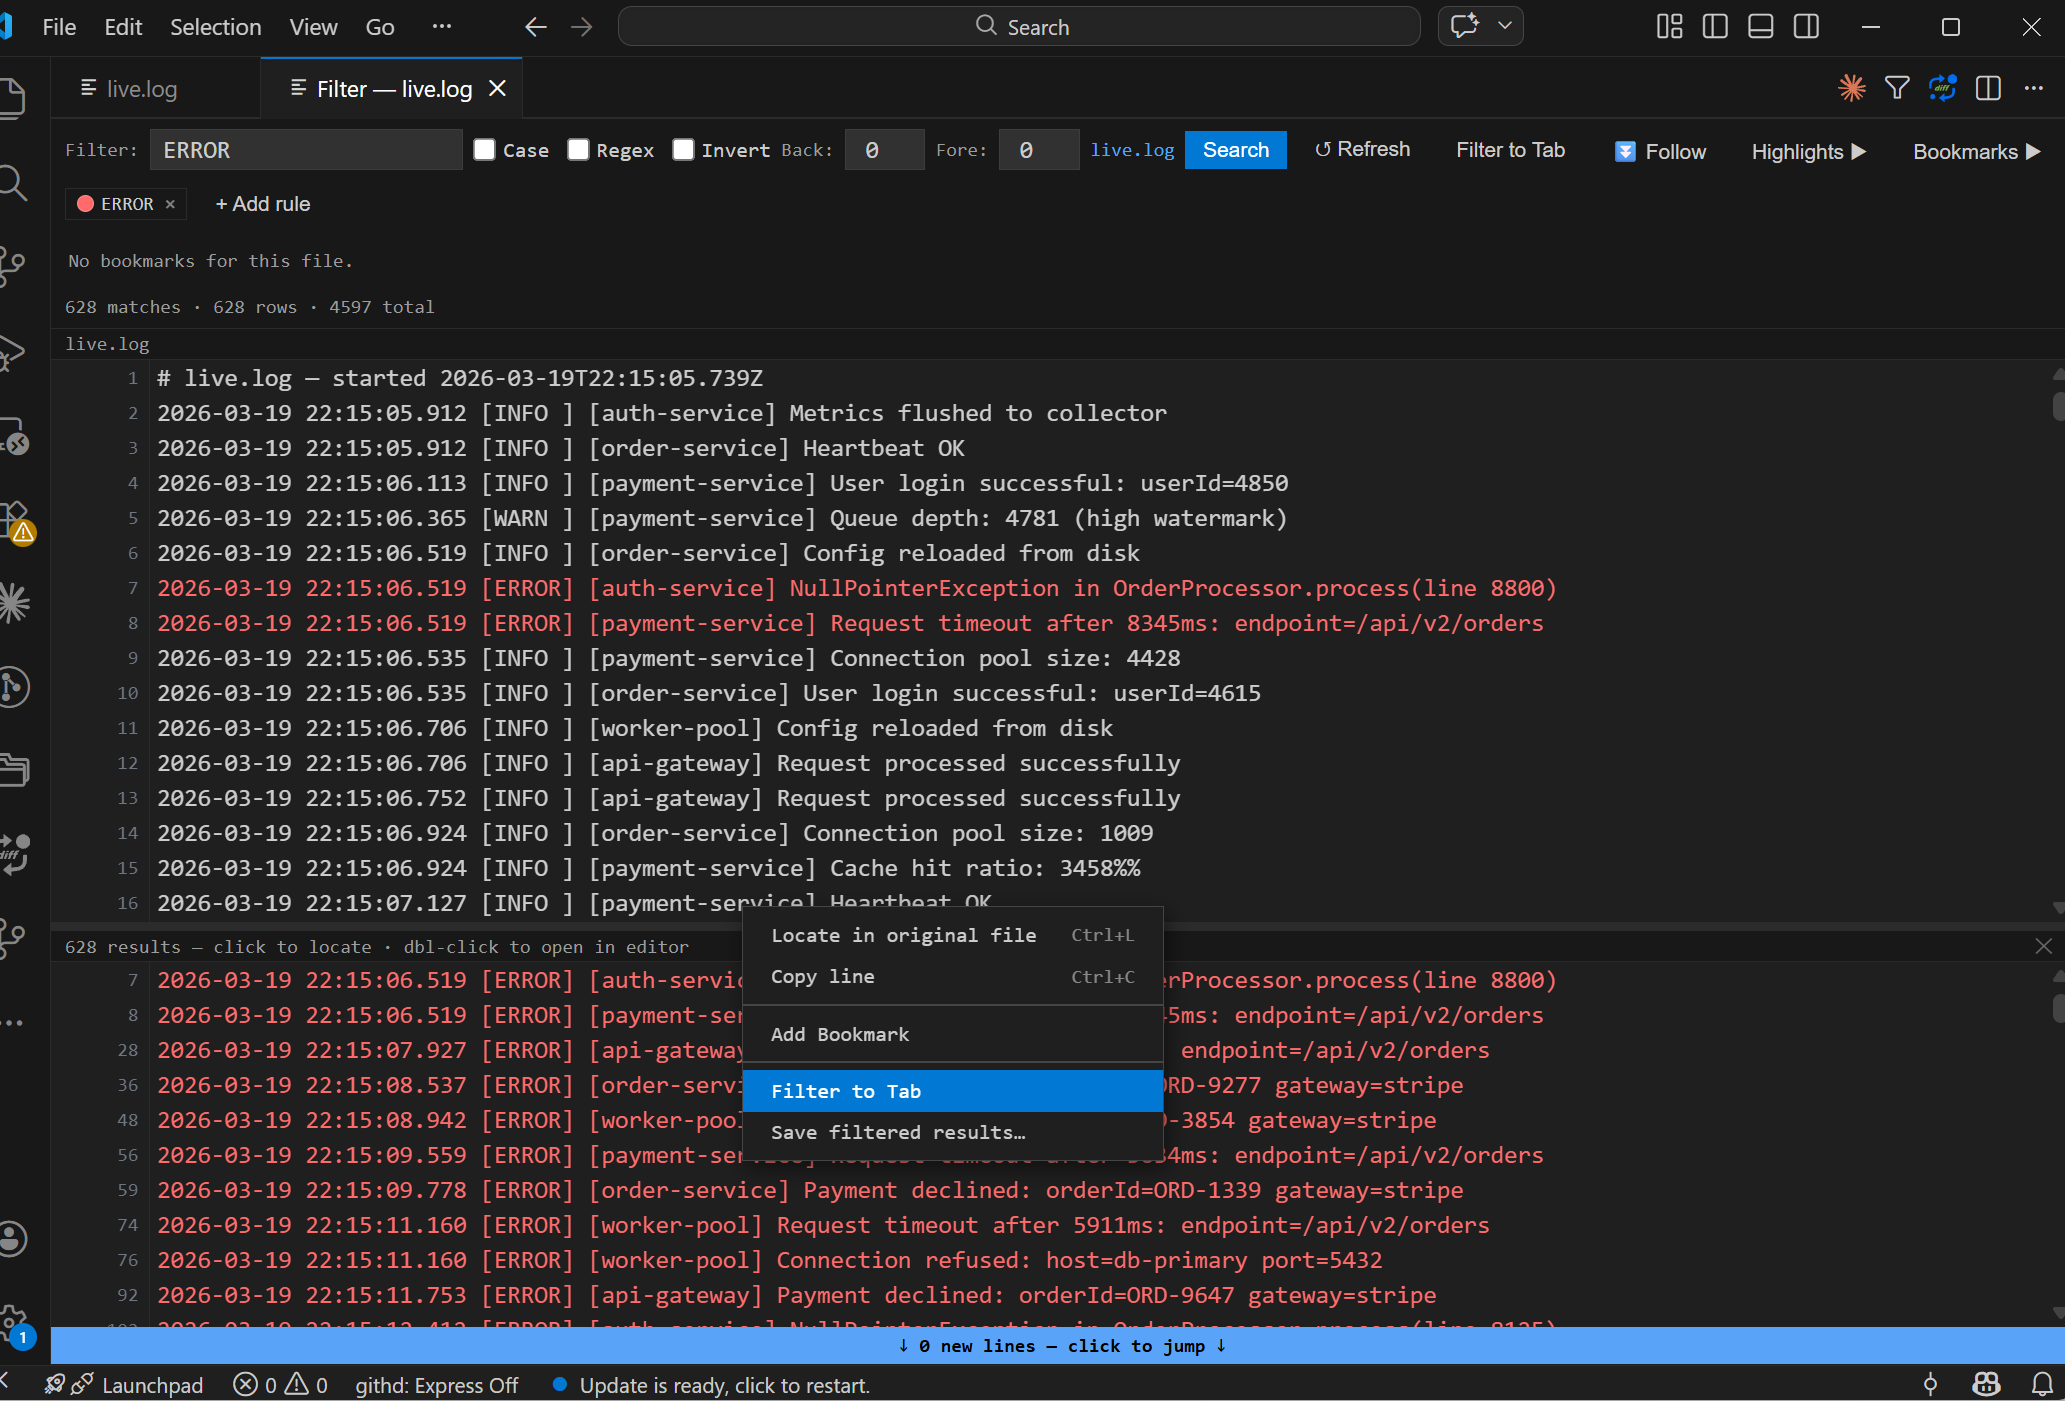
Right-click Context MenuRight-click any result row:
Save Filtered ResultsRight-click any row → Save filtered results… to export the current view to a
Column Parser (Columnizer)Click Columns ▶ to parse structured log lines into separate columns. Choose a preset or let auto-detect pick the best one:
Two view modes
Column visibilityToggle individual columns on or off with checkboxes. Hidden columns disappear from both the view and saved output. For example, hide Timestamp to focus on just the service and message. Save with columnsWhen columns are active, a "Save with columns" checkbox appears. When checked, saving filtered results exports only the visible columns (tab-separated with a header row) instead of the raw log lines. Uncheck it to save the original format. If a preset doesn't match your data, the stats bar shows a warning: "Columns: 0/201 lines matched — try a different preset". Line HighlightingLines are coloured automatically by the built-in rules:
Add custom rules via Highlights ▶ in the panel or Command Palette → Log: Add Highlight Rule. Rules are stored in VS Code settings and apply across all open log files. Private (per-file) rulesCheck "This file only" when adding a rule to keep it local to that panel. Private rules:
Highlights only apply to files that have an active LogExpert panel open. Your BookmarksClick Bookmarks ▶ to manage bookmarks for the current file.
Bookmarks persist across window reloads (stored per workspace). Keybindings
All shortcuts are rebindable via File → Preferences → Keyboard Shortcuts. Settings
Known Limitations
ContributingIssues and pull requests welcome at the project repository. |