Code Beacon
⚠️ Pre-release Warning: This is a pre-release version of Code Beacon. Performance isn't quite there yet, but it will be soon! In the meantime, you can easily filter and turn off tracing to prevent slowdowns. You may encounter other significant bugs, issues, and frequent breaking changes.
⚠️ Gem Installation: The codebeacon-tracer Ruby gem must also be installed in each project you wish to trace.
Better understand and visualize what your Ruby code is doing during development.
Developers constantly run code in development to verify and test changes. This extension is designed to take advantage of that existing workflow by tracing as much code as you can configure it to.
This is a context-aware tracer. External library calls are filtered out so you can focus on your application code. Then it's rolled up into a call graph where each conceptual method relationship is only represented once. This results in a view with fewer than 1% of the original trace, showing only the calls you care about and small enough that you can actually reason about it.
Extension Features
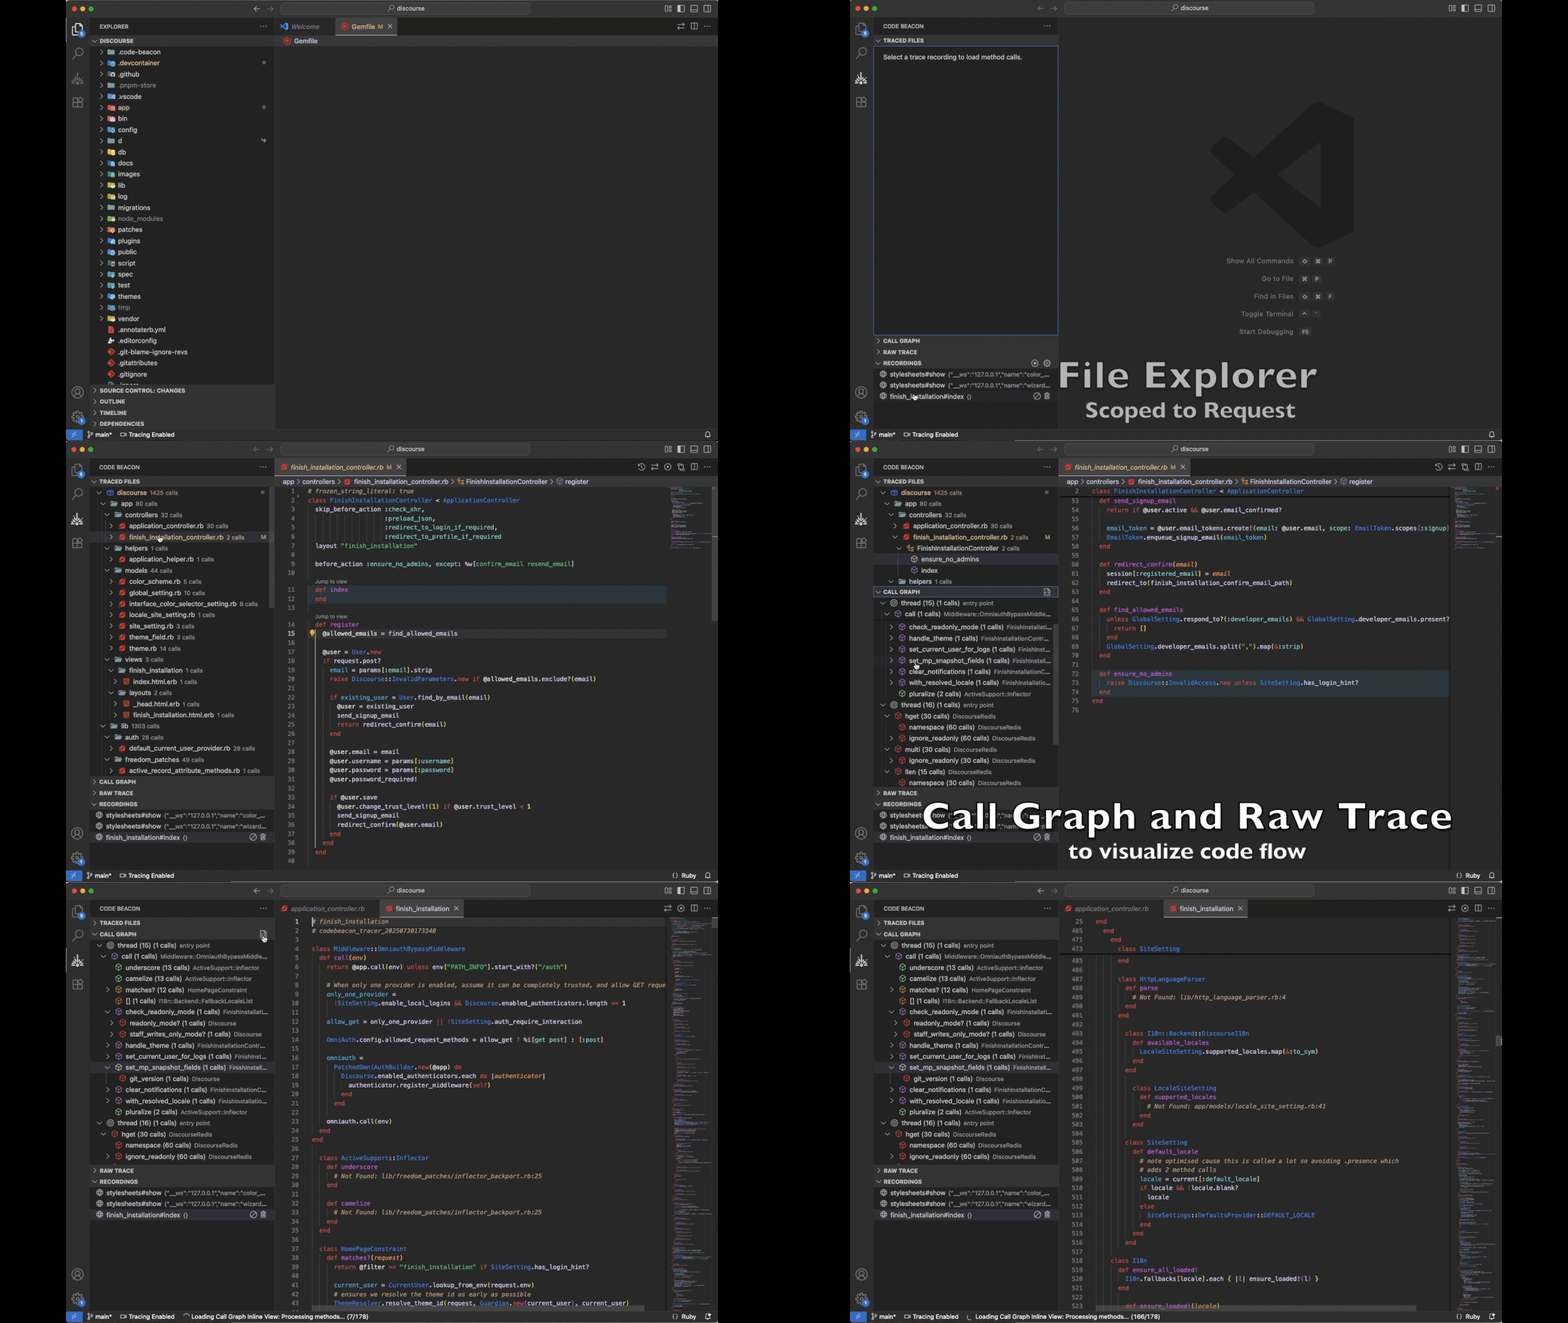
- provides a new interface for your project scoped to just recently executed code
- displays a filtered file explorer view showing just the files you care about
- highlights executed methods in the editor so you can quickly see what code was executed and what wasn't
- displays a call graph showing method and class relationships
- creates an inline file view showing all executed methods in order in a single virtual file
- provides a raw trace when you need to drill down further
- maintains a history of what code has been run
- [gem] Rails integration for automatic middleware tracing
- [gem] Simple tracing interface to wrap code you care about
- ... more coming soon!

Installation
- Open VS Code
- Go to Extensions (Ctrl+Shift+X)
- Search for "Code Beacon"
- Click Install
Requirements
- Visual Studio Code 1.85.0 or higher
- Ruby 2.7 or higher
- A Ruby project with the Code Beacon gem installed
- SQLite3 binary (sqlite3) installed on your system
- Mac: Available via Homebrew (
brew install sqlite3)
- Linux: Available via package manager (e.g.,
apt install sqlite3)
- Windows: Download from the SQLite website
Note: Code Beacon requires the SQLite3 command-line binary to be installed and configured. During initial setup, the extension will attempt to automatically detect the SQLite3 binary on your system. If it cannot be found, you will be prompted to provide the path manually.
Getting Started
Install the Code Beacon gem in your Ruby project:
gem install codebeacon-tracer
Or add to your Gemfile:
gem 'codebeacon-tracer'
Add the Code Beacon tracer to your Ruby application:
require 'codebeacon-tracer'

# Trace a block of code
CodeBeacon::Tracer.trace("My Trace", "Description of what I'm tracing") do |tracer|
  # Your code to analyze goes here
  some_method_to_analyze
end

# Or start and stop tracing manually
CodeBeacon::Tracer.start
# Your code to analyze
some_method_to_analyze
CodeBeacon::Tracer.stop
Rails Applications: In Rails applications, HTTP requests are automatically traced without any additional code. Simply install the gem and run your Rails server as usual.
Run your application to generate execution data
Open the Code Beacon panel in VS Code (look for the beacon icon in the activity bar)
Browse through the recorded method calls and execution paths
Extension Usage
Method Lookup and Highlighting
Method body extraction in the Call Graph Inline View requires a Language Server Protocol (LSP) server for Ruby. We recommend installing the ruby-lsp extension for the best experience.
Features that require LSP:
- Method body extraction in Call Graph Inline View
- Method highlighting in editor (partial functionality)
Features that work without LSP:
- All tree views (Recordings, Traced Files, Call Graph, Raw Trace)
- Remote tracing controls
- Recording management
- Basic method call visualization
Note: ruby-lsp can take time to load and index on initialization. Opening a Ruby file should trigger its initialization.
Recordings
The Recordings view shows all available trace recordings and provides controls for remote tracing:
- Menu Buttons: Use the buttons in the view title bar to allow/block remote tracing or open the remote tracer configuration.
- Tree Item Buttons: Hover on a recording to delete it or add a pattern match to prevent tracing similar items.
- Status Bar: Shows current tracing state (allowed/blocked/error) - click to toggle.
Call Graph Inline View
Extension Settings
This extension contributes the following settings:
Extension Settings
These settings control the VS Code extension's behavior:
code-beacon.dataDir: Set the root directory name for the data files in the workspace root (default: .code-beacon)code-beacon.rootDir: Used only in the case of a multi-root workspace. Enable a single root directory by setting its path here.code-beacon.sqliteBinaryPath: Path to the SQLite binary executable. Required for database operations.code-beacon.autoLoadLastSelectedRecording: Automatically load the last selected recording when the extension starts (default: true)
Known Issues
- Currently only supports Ruby applications
- Large applications with many method calls may experience performance issues
- This is especially true on initial load or reload of a rails application.
- The first request after a rails server is started is not traced.
- Internal tracer execptions are handled, but the tracer doesn't always recover well in long running processes like web servers.
Release Notes
See the CHANGELOG for the latest release information.
Attributions
Icons

