Perceptor
Perceptor X-rays your repository: an interactive, Obsidian-style dependency &
behavior map, with static complexity and data-access risk read straight off
each method — rendered right inside VS Code.
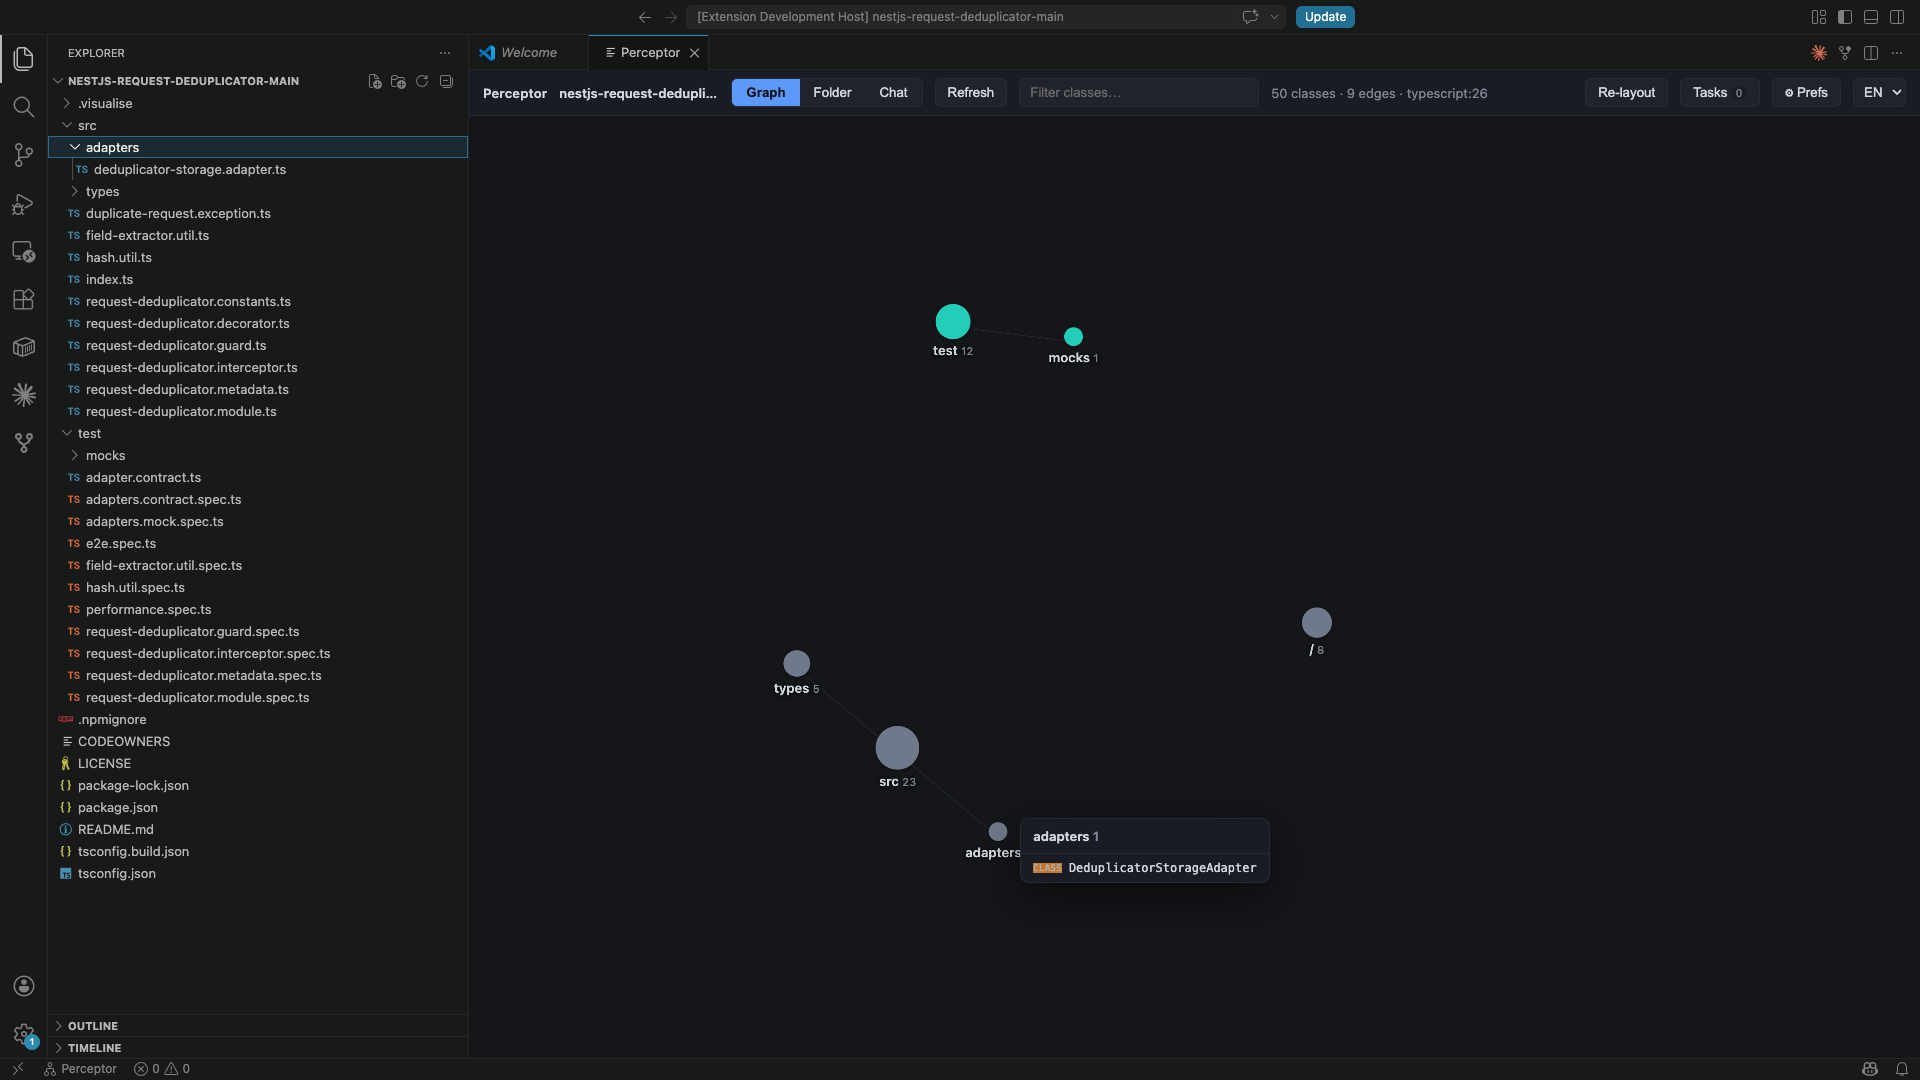
- Graph mode — folders as connection-sized circle nodes, dependencies as
edges, in a force layout.
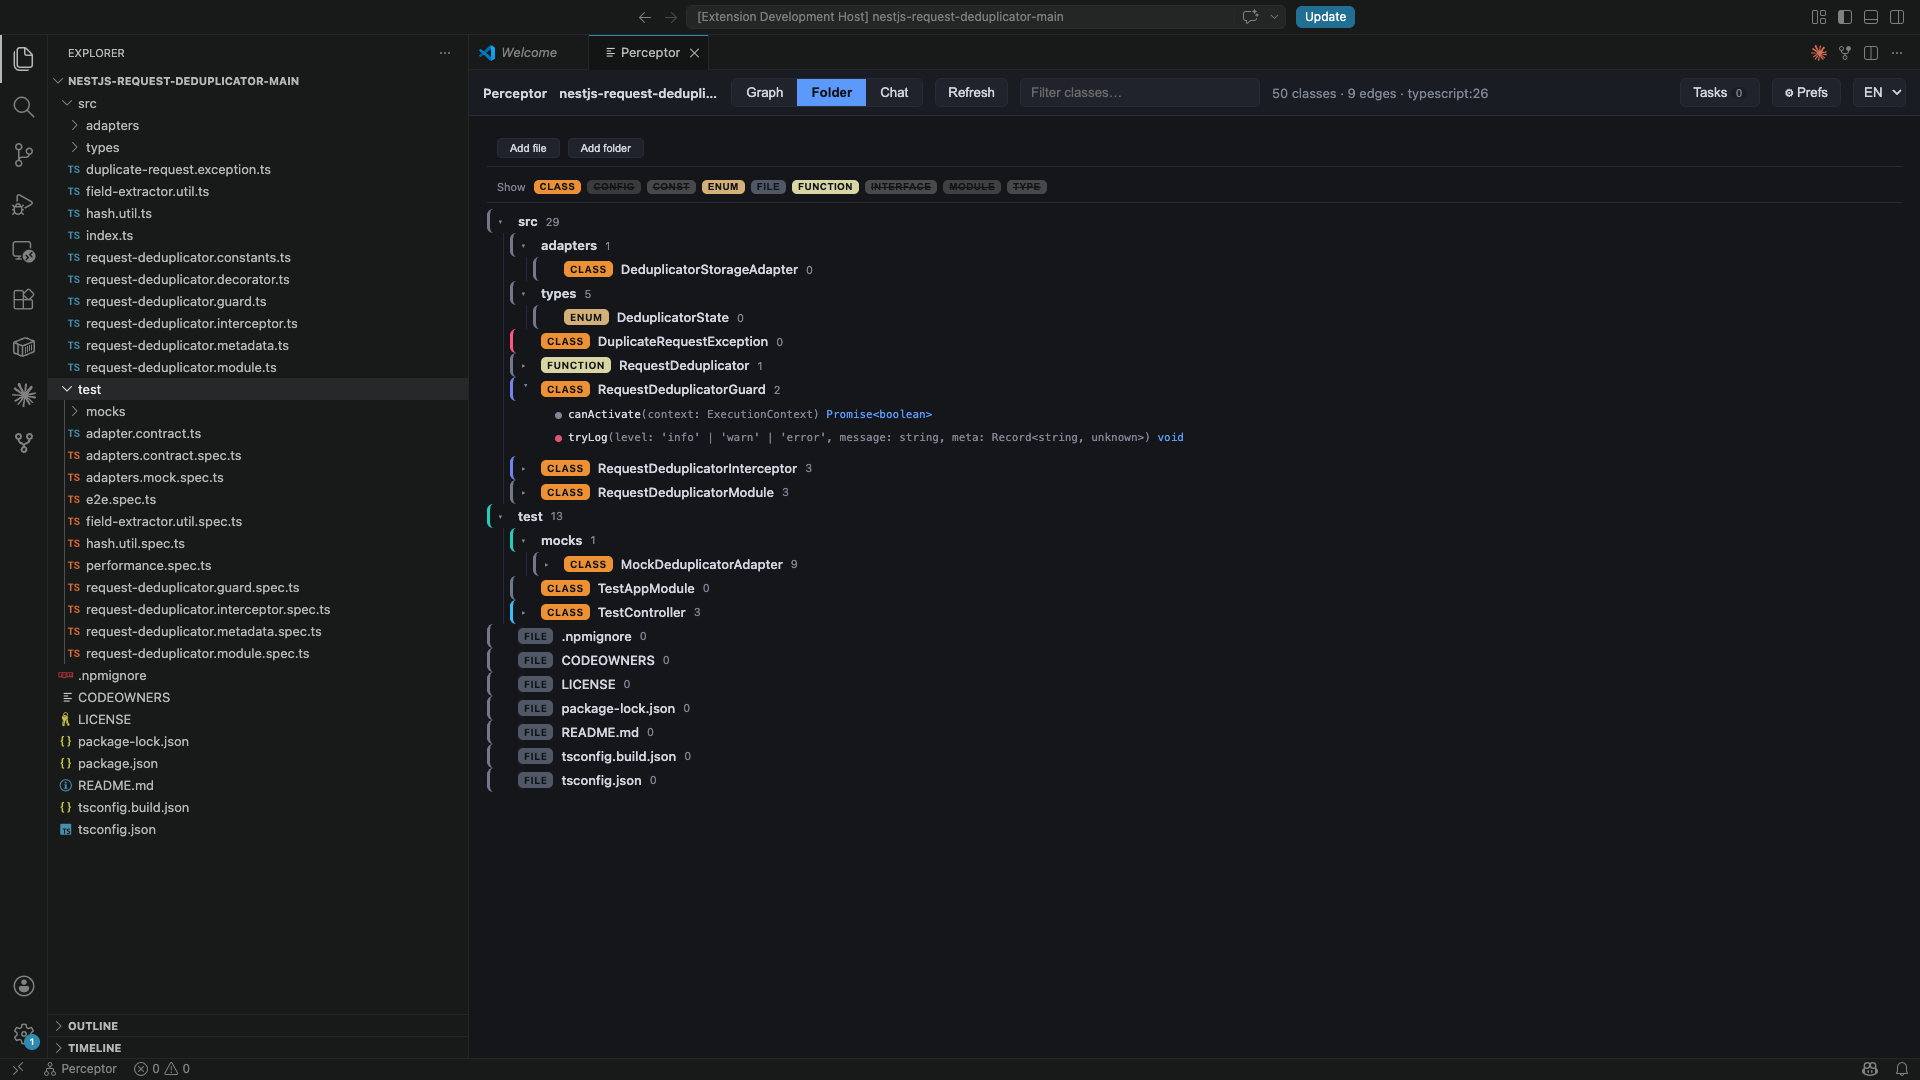
- Folder mode — a collapsible tree (folder → type → behaviors), with a method
detail panel.
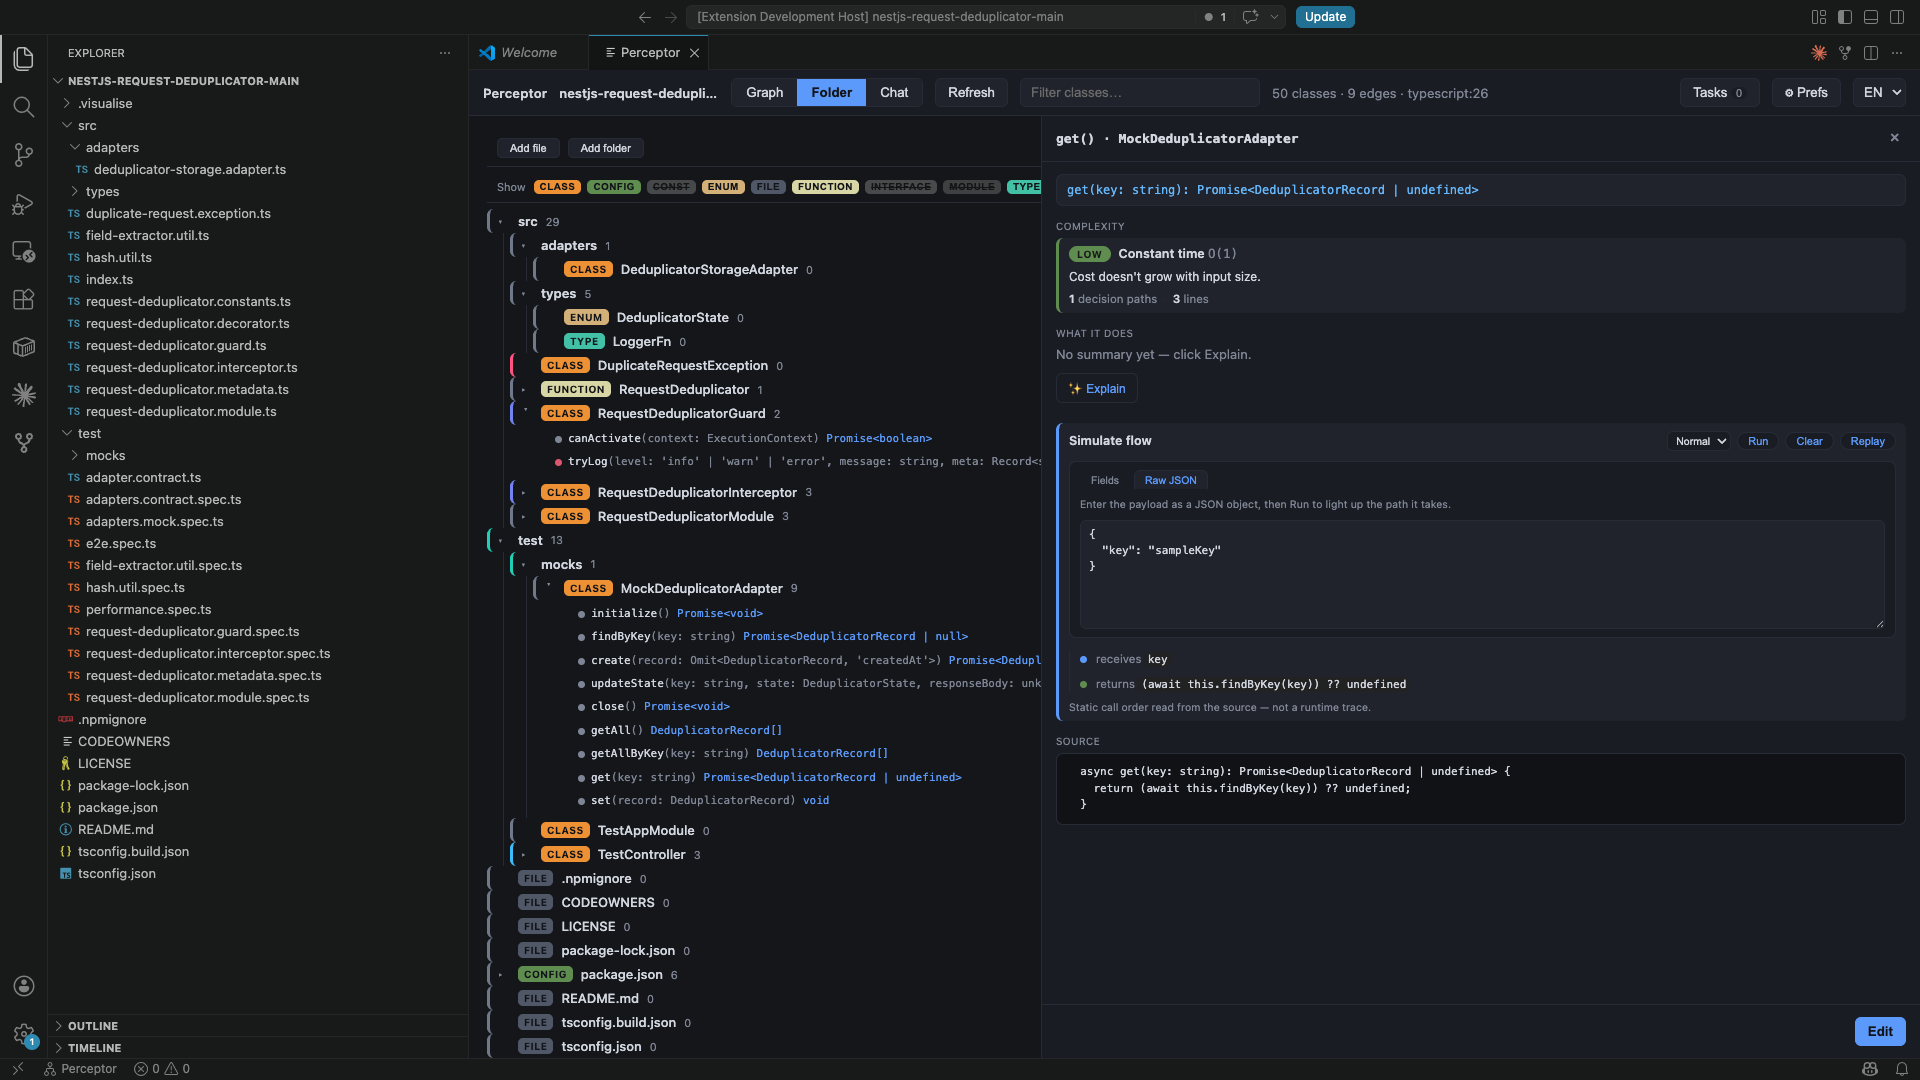
- Method insight — for any method: a static Big-O / complexity read, data-access
(SQL/ORM) risk signals (N+1,
SELECT *, unbounded finds…), and a Simulate flow
storyboard that animates, step by step, what the method receives, every call it makes,
and what it returns.
- Explain — ask your own local Claude for a complete plain-English explanation of a
method, inline in its detail panel.
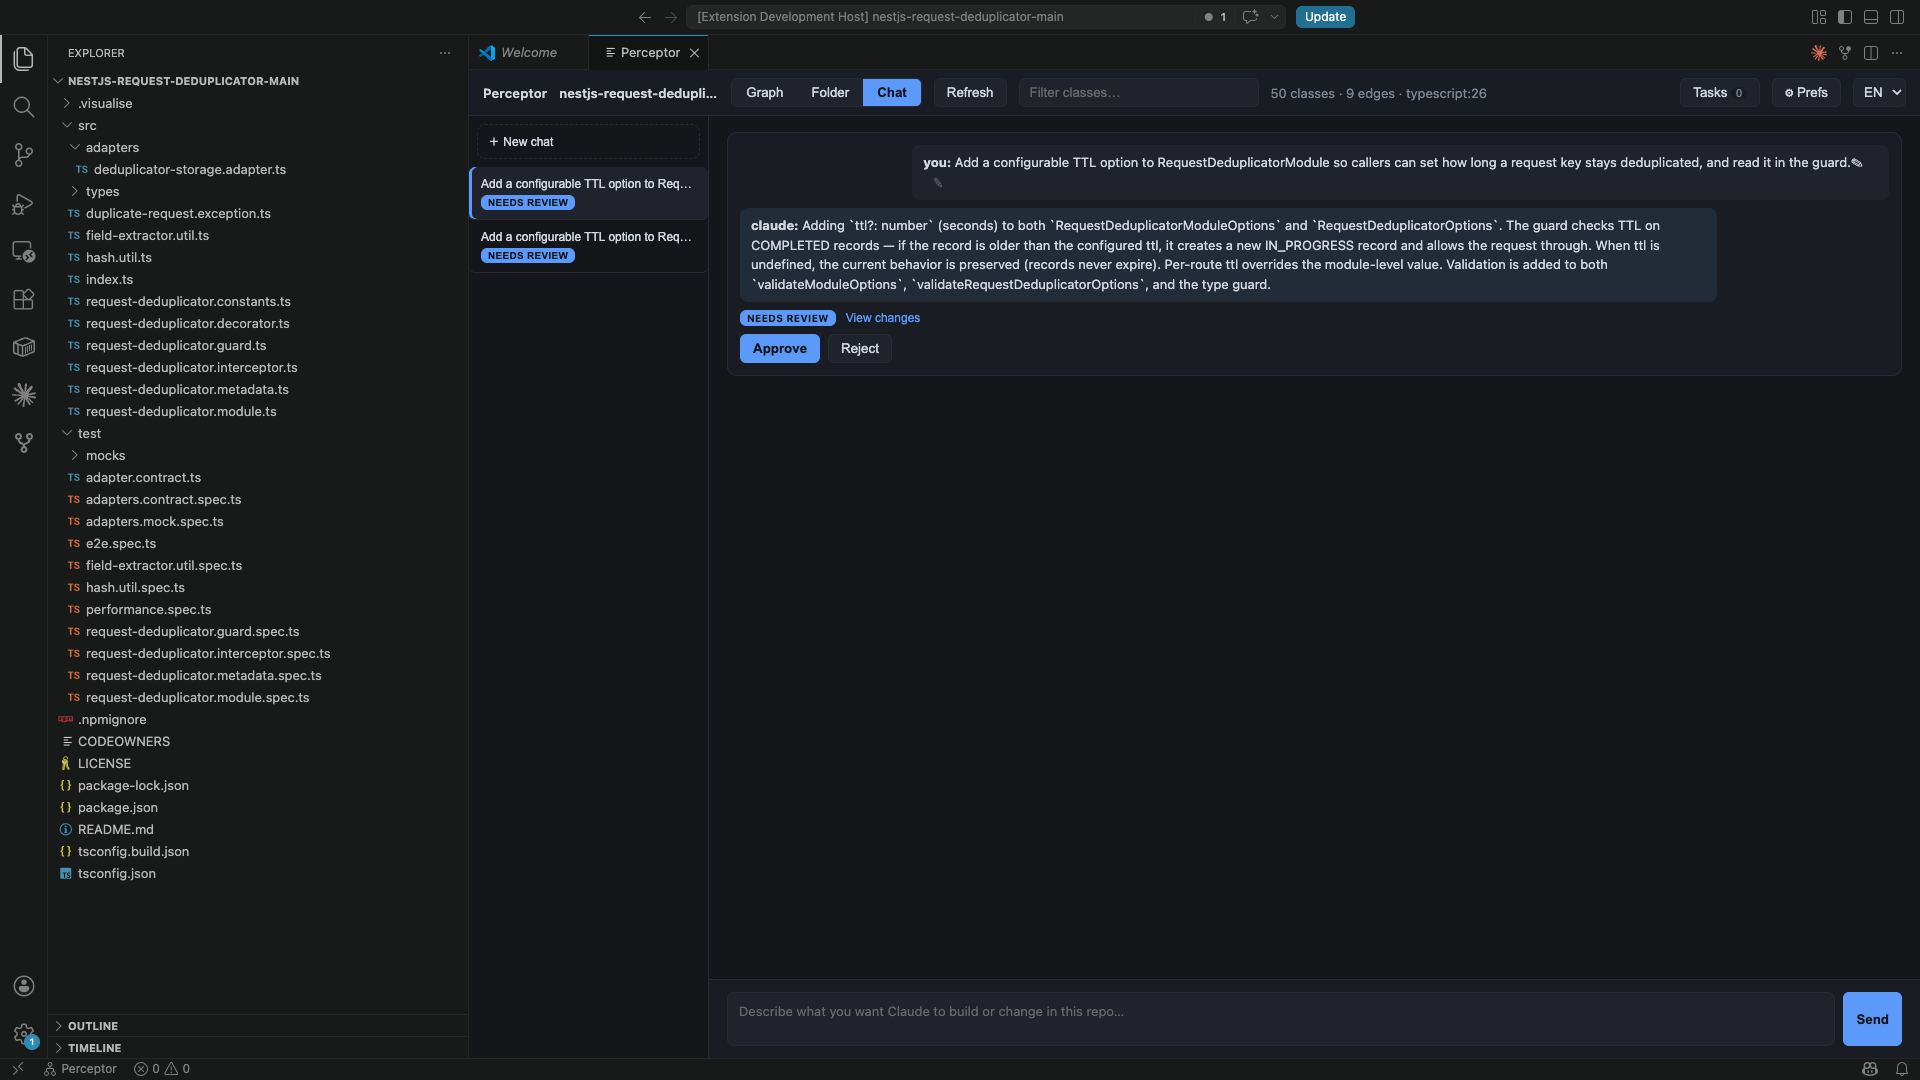
- Chat — describe a change in plain language and Claude proposes it with
impact analysis. Each conversation has its own thread; edit any sent message
to re-run from that point.
- @ File references — type
@ in chat to get an autocomplete popup of
project files; selected files are included as context for Claude.
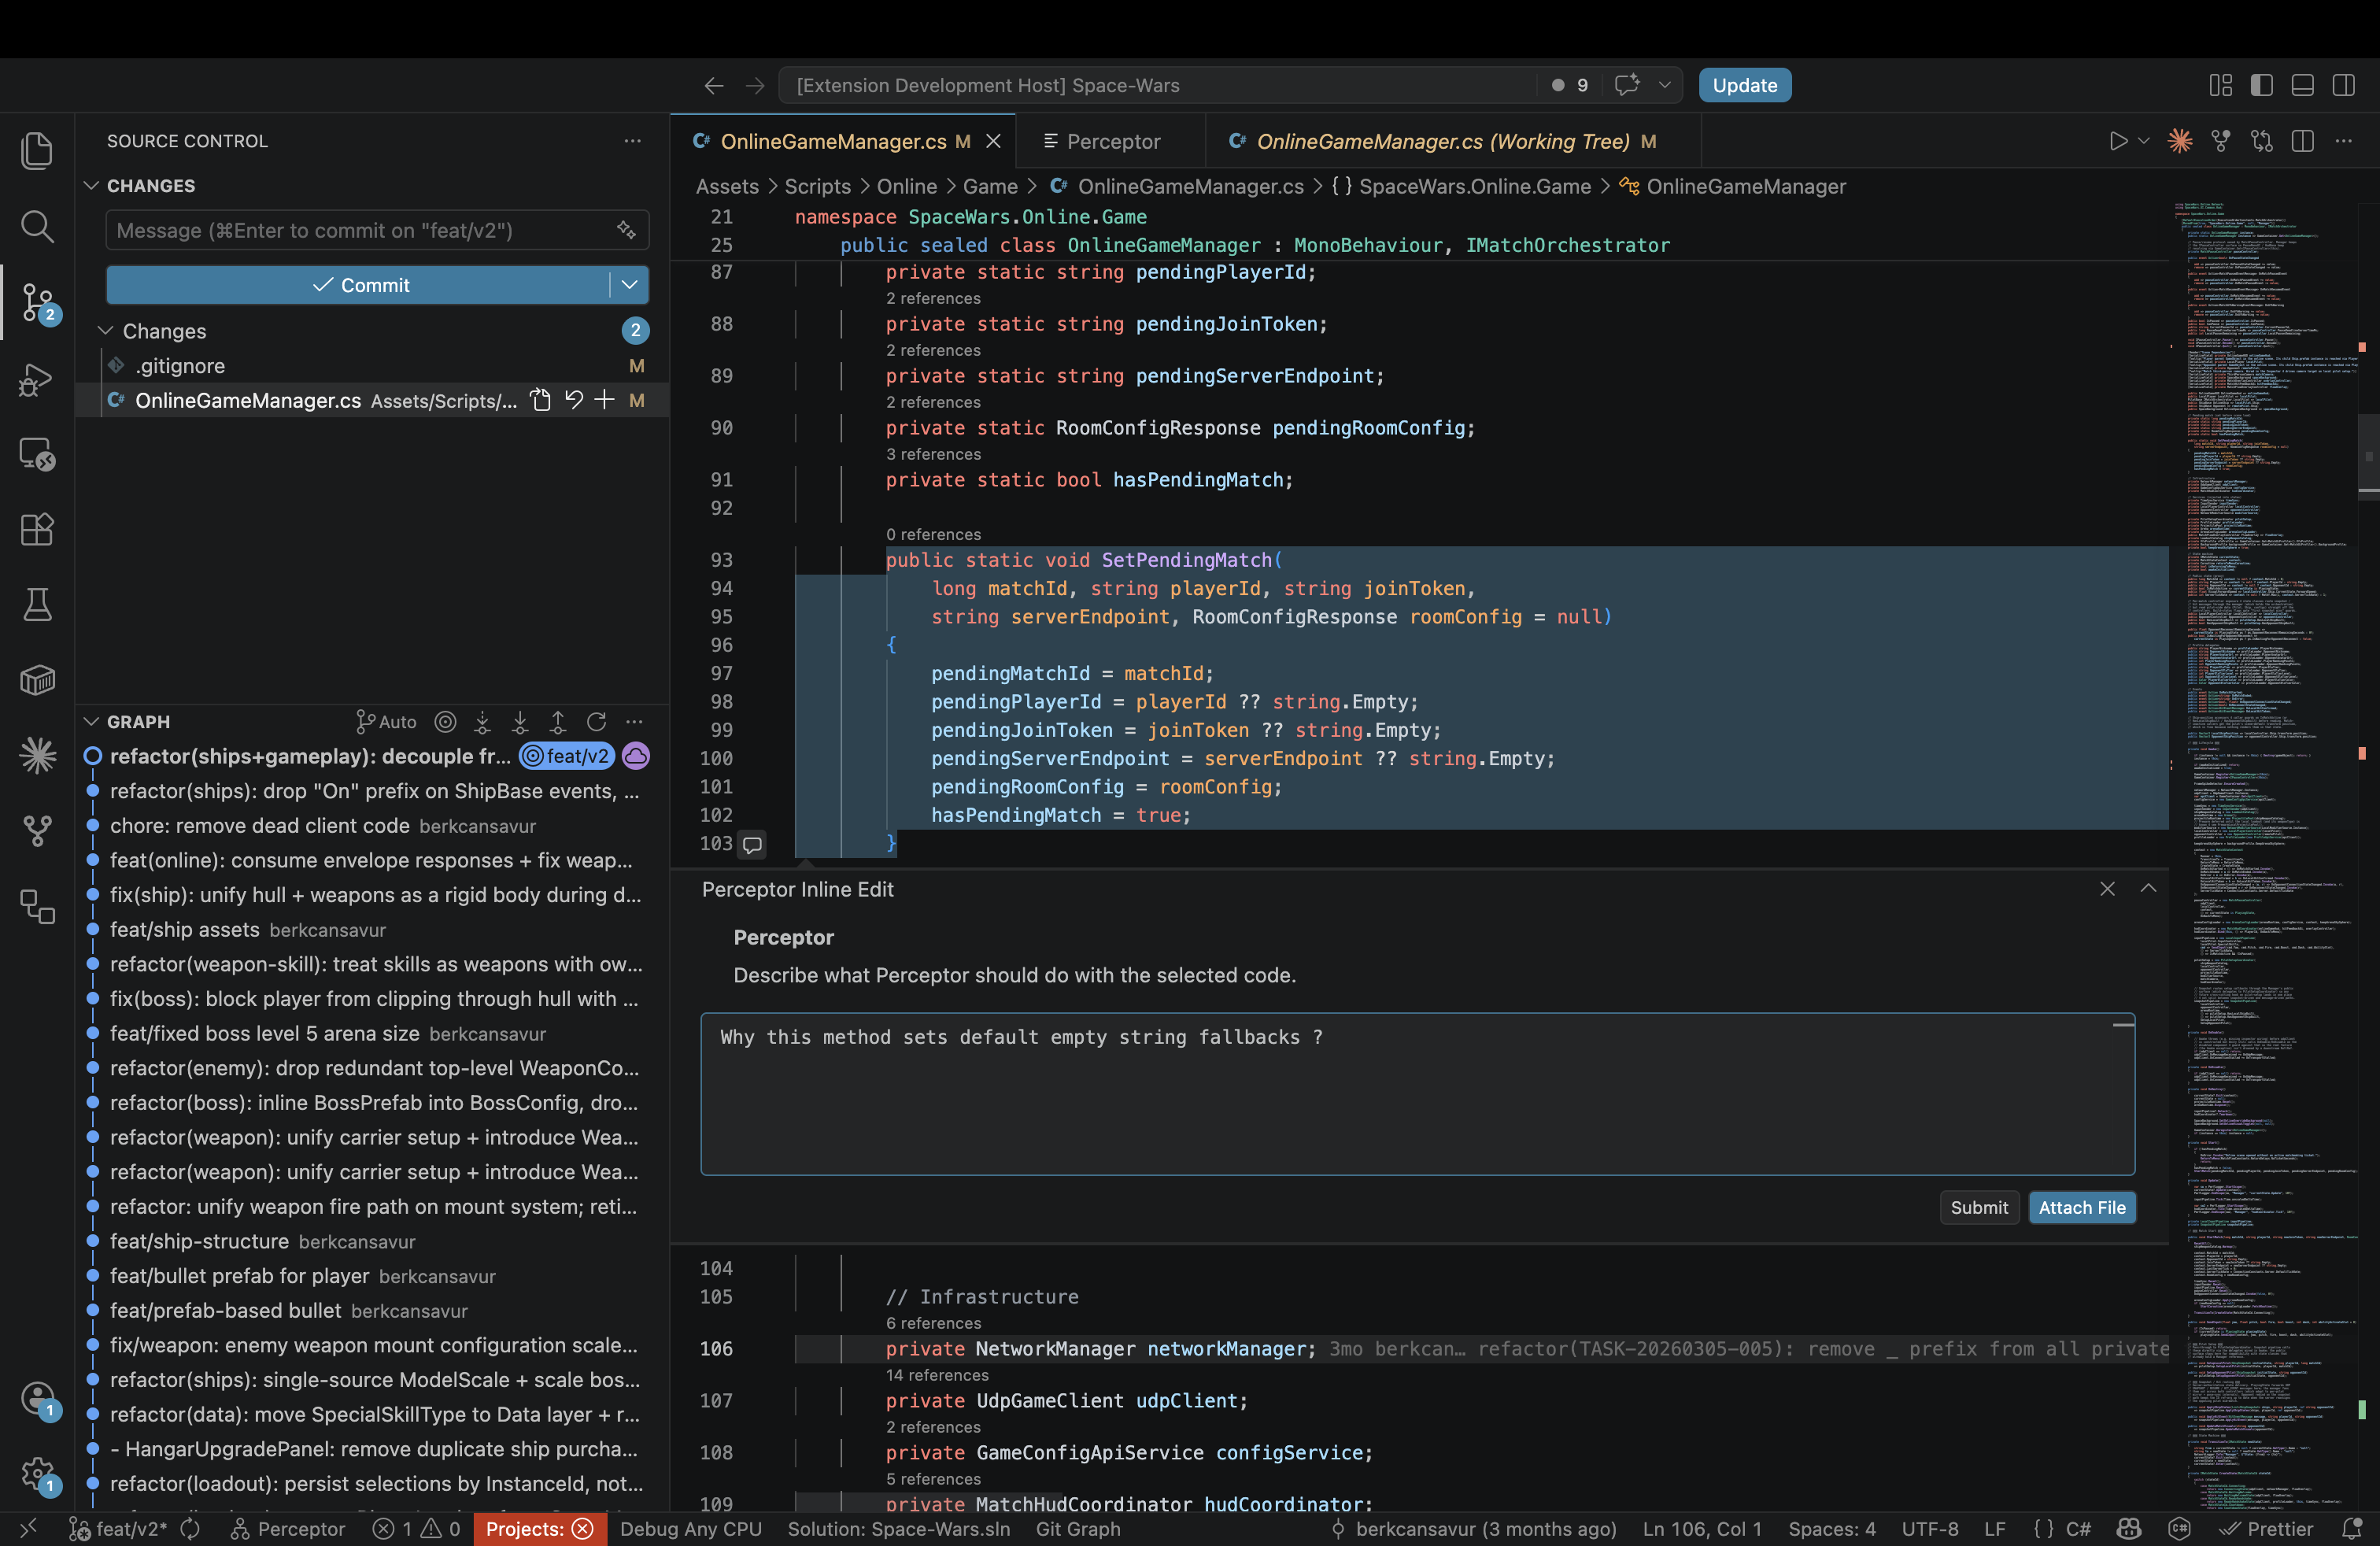
- Inline Edit (
Cmd+Shift+I) — select code in the editor, press the
shortcut, and a Perceptor chat thread opens right next to the selected lines
(via VS Code's CommentController API). Describe what you want; Claude proposes
a diff. Buttons adapt to the current state: Submit, Stop, Attach File, Remove
Attached File, View in Chat, and Close.
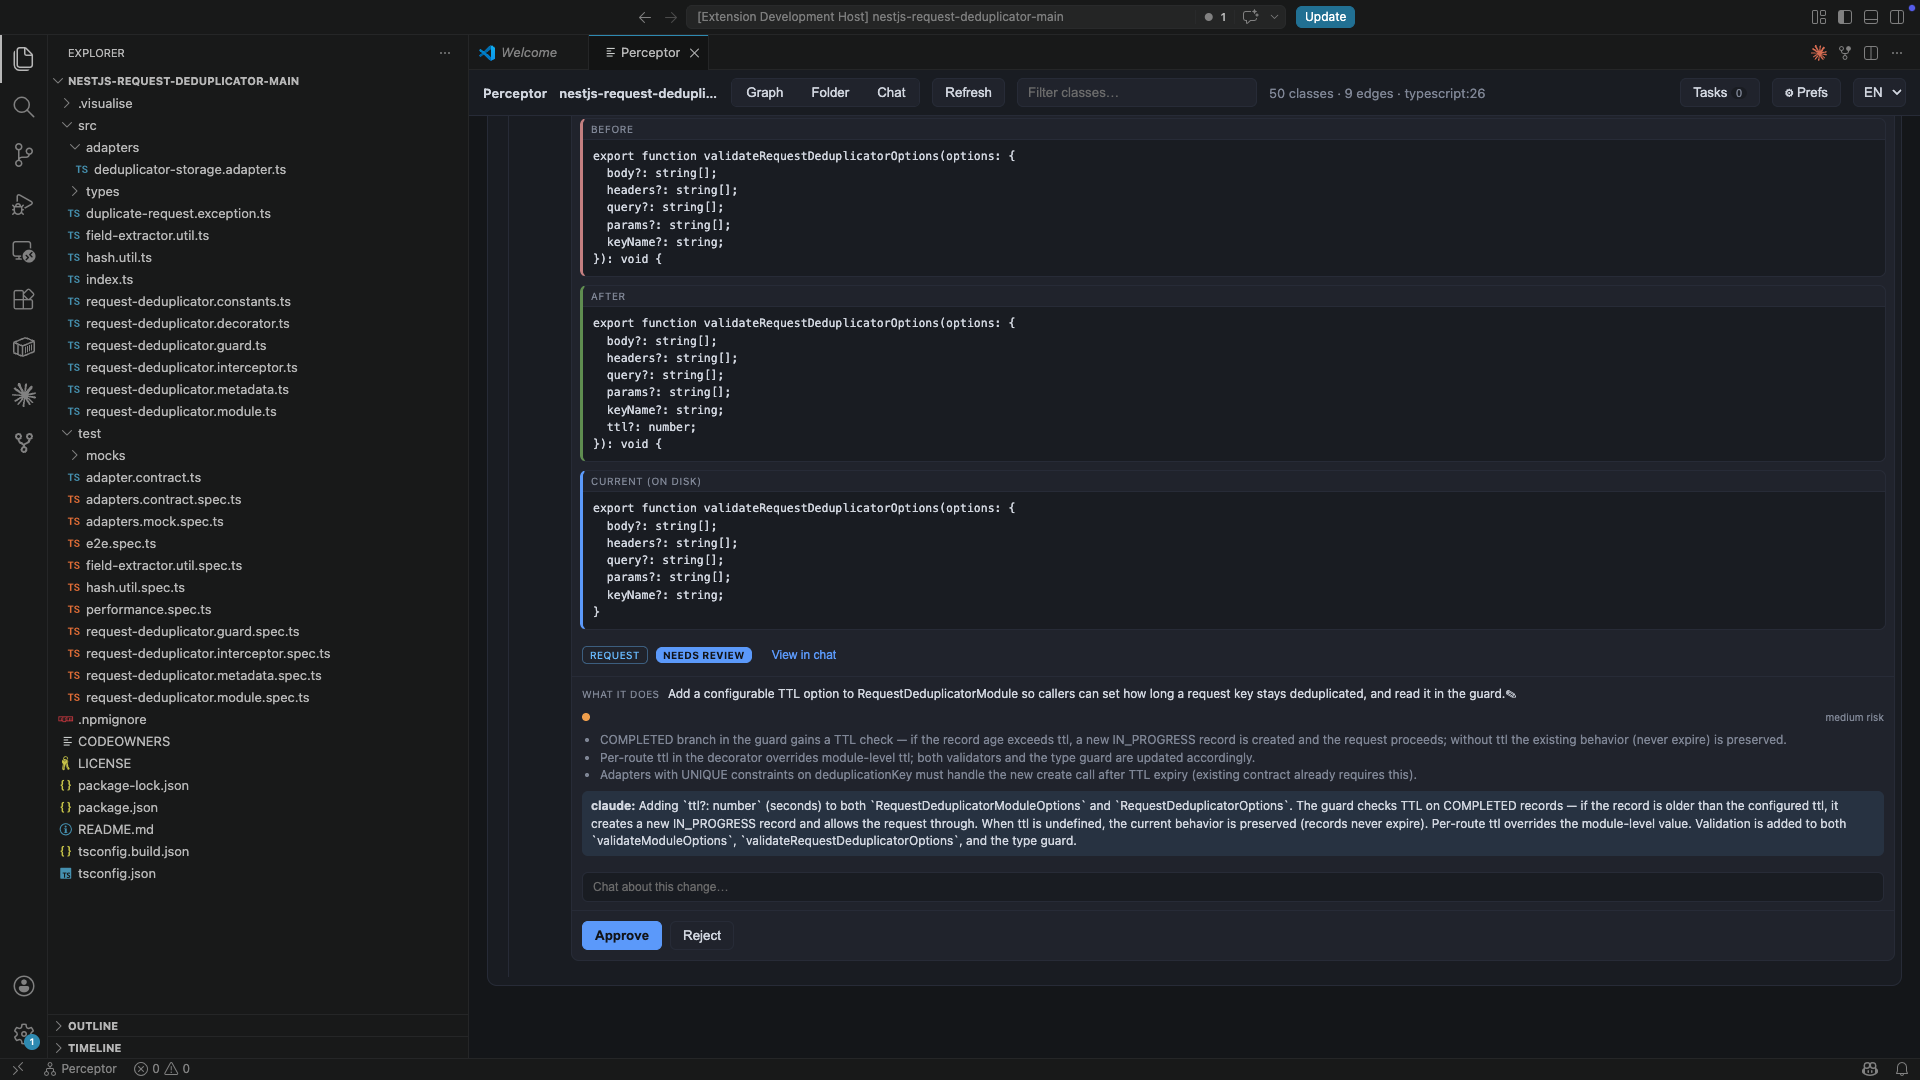
- Change tasks — add / move / edit a behavior or create files & folders from
the map; the work is carried out by your own local Claude. No server, no
hosted backend, your tokens.
Screenshots
Folder mode — collapsible tree with a method detail panel:
Method insight — complexity, data-access risk, and the Simulate-flow storyboard:
Explain — ask your own local Claude about a method, inline:
Inline Edit — select code, press Cmd+Shift+I, and edit right in the editor:
Change tasks — review and apply changes carried out by your local Claude:
Quick start (3 steps)
- Get the file —
perceptor-<version>.vsix.
- Install it — open VS Code → Extensions panel (left sidebar) → click the
… menu at the top → Install from VSIX… → pick the file.
- Open the map — open any project folder, then click Perceptor in the
bottom status bar (or press
Cmd/Ctrl+Shift+P and run Perceptor: Open).
That's it — the map appears and updates by itself. (Optional: the AI edit/explain
features need the free claude CLI installed; the map works fine without it.)
Installation
From the VS Code Marketplace (easiest):
Open the Extensions panel (Cmd/Ctrl+Shift+X), search for Perceptor, and
click Install — or from the command line:
code --install-extension berkcansavur.perceptor
From a packaged .vsix file:
code --install-extension perceptor-*.vsix
…or in VS Code: Extensions panel → … menu → Install from VSIX… → pick the file.
Then open any folder and run Perceptor: Open (see Usage). To update, install
a newer build the same way.
Build the .vsix yourself:
npm install
npm run package        # → packages/extension/perceptor-<version>.vsix
Requires the claude CLI on your PATH
only if you use the AI-powered explain/change tasks; the map itself works without it.
Usage
- Open a folder/workspace in VS Code.
Cmd/Ctrl+Shift+P → Perceptor: Open (or use the status-bar item).- Switch between Graph and Folder modes, pan / zoom / search, click a
type to open it in the editor.
- In Folder mode, click a behavior to open its detail panel — complexity, data-access
risk, the Simulate-flow storyboard (press Run), and Explain.
- Inline Edit — select code in the editor and press
Cmd+Shift+I to open a
chat thread right next to it. Describe your change, submit, and review the
proposed diff in the Changes tab.
The map refreshes automatically as files change.
Supported languages
| Language |
Extracted symbols |
| TypeScript / TSX |
class, interface, enum, type alias, exported const |
| Java |
class, interface, enum, record, annotation (@interface) |
| C# |
class, interface, enum, struct, record, delegate |
| Go |
struct, interface (receiver methods, channel/pointer/slice/map unwrap) |
Settings
| Setting |
Default |
Description |
perceptor.claudePath |
(empty) |
Path to the Claude CLI used for explain/change tasks. Empty = auto-detect via your login shell (recommended); set an absolute path to override. |
perceptor.autoProcessOnOpen |
false |
Auto-process queued tasks on open (token-conservative; off by default). |
Privacy
Everything runs locally. The analyzer and task engine run in the extension host
on your machine; explain/change tasks invoke your own claude CLI with your own tokens.
No code leaves your machine through this extension.
License
MIT © Berkcan Şavur

