AutoSurg Debug
English | 简体中文
AutoSurg Debug is a VS Code / Cursor extension for managing and debugging AutoSurg Compute modules and the Orchestrator.
Features
- Reads the module manifest from
system/config/modules.yaml
- Shows Compute, Orchestrator, and infrastructure modules in a sidebar view, with one child row per live Compute replica (
stereo#0) showing pid, worker generation and last crash
- Displays module runtime status and Compute replica counts
- Start, stop, and restart modules; clone, scale, and stop individual replicas of an LB-backed Compute
- Green Hot-Attach: hot-inject debugpy into a running Compute, replica, or Orchestrator while keeping process state
- Orange Restart-Attach: restart a Compute, then attach (clears init state)
- Attach to all enabled Compute modules at once
- One-click debugging of the full system: Orchestrator in the main process plus all Compute modules
- One-click Orchestrator debug session (launches
main.py when the system is not running)
- Automatic allocation of free debugpy ports, preferring each module's conventional
launch.json port
- Checks YAML syntax, duplicate keys, dependency references, and path presets, then asks the framework itself (
python -m autosurg.runtime.module_registry) whether the config is loadable
AutoSurg: Show Crashes opens the crash bundles the running system recorded (reason, exit code, OOM flag, stderr tail, last request) without needing the log directory locallyAutoSurg: Query Module Logs filters the structured event log by level and request_id over the ControlPlane- A crash notifies while you are in the editor, with the reason and the last stderr line already in the toast
- Right-click Tensor / Mat image inspection while paused at a breakpoint, with slicing, pseudo-color, and a pixel probe
- Interactive 3D point cloud viewer:
.ply files, (N, 2..7) tensors, and Open3D / trimesh clouds, with a force-cloud command
- Live system log tail (
AutoSurg: Show System Log Stream) with backfill, auto-reconnect, and rid= request correlation
- Monitor dashboard: live stream/module telemetry plus a cross-process watch list of arbitrary expressions captured whenever any attached process pauses
- 3D point cloud viewer (WebGL): auto-detects
(N, 3..7) tensors, Open3D / trimesh clouds, and .ply files, with orbit camera, RGB/intensity/height coloring, and point picking
Debug ports are preferredly hot-injected into running workers or the main.py process via ControlPlane start_debug; no AUTOSURG_DEBUG_PORT configuration is needed in modules.yaml. Each Compute row in the sidebar has two debug buttons: the green plug is Hot-Attach, the orange cycle arrow is Restart-Attach. Orchestrator rows also have a green Hot-Attach; since all Orchestrators share the single main.py process, only one main-process debug session is created.
Hot-Attach and Restart-Attach address a Compute through the ControlPlane's compute namespace (--compute stereo, --compute stereo#1), not the generic module namespace. That distinction matters: start_debug --module <name> is resolved against the orchestrators first, so a Compute whose name collides with an orchestrator display_name gets a listener inside main.py and the tool reports success while your breakpoints in the worker stay grey. The tree always sends the specific flag, and the attach harness has a case that fails if this regresses.
Installation
Open the Command Palette in VS Code or Cursor and run:
Extensions: Install from VSIX...
Pick the generated autosurg-debug-*.vsix file, then run:
Developer: Reload Window
Prerequisites
- The workspace contains
system/config/modules.yaml, or autosurg.configPath is configured
- AutoSurg uses a recent ControlPlane that supports
start_debug hot-attach
autosurg.controlPython points to a Python with pyzmq installeddebugpy is importable in the target Compute environment; the worker tries to install it automatically when missing- The Python debugging extension is installed in VS Code/Cursor
Debugging a Compute Module
Set breakpoints in the target Compute code.
Start AutoSurg normally from the command line:
cd system
python3 main.py
Open the AutoSurg view on the left.
Find the target Compute, e.g. stereo.
Two debug buttons appear on the right side of the module row:
- Green plug: Hot-Attach, injects into the running process without restarting or losing state. The module must already be running.
- Orange cycle arrow: Restart-Attach, restarts the module with debug environment variables and then attaches; in-process state is cleared.
You can also right-click and choose AutoSurg: Hot-Attach Compute / AutoSurg: Restart-Attach Compute.
Replicas
When a Compute runs behind its load balancer, its row expands into one child per replica with pid, generation and whether it ever crashed. A replica row hot-attaches with --compute stereo#1; because the start_debug RPC is delivered through the service LB, it lands on whichever replica is idle, so with more than one replica either scale to one replica first or clone a dedicated one:
- Clone Compute Replica spawns an extra replica behind the LB, which is the cheap way to get a process that only your requests reach.
- Scale Compute Replicas sets the desired count (bounded by the module's
max_replicas).
- Stop This Replica removes one replica without touching its siblings.
Restart-Attach asks the supervisor for a predictable port: the module's own env.AUTOSURG_DEBUG_PORT if it declares one, otherwise the conventional port from autosurg/infra/debugpy_runtime.py (qwenhl 5678, ll 5679, tracker 5680, ikpt 5681, stereo 5682, calib 5683, orchestrator 5684, replica n = base + n). That is what makes a hand-written launch.json attach and a tree click land on the same endpoint. Set autosurg.preferConventionalDebugPorts to false to always scan up from autosurg.debugPortBase.
Debugging One Compute Module Without The Whole System
The Flow A/B/C entries above all need main.py, because they reach a worker the supervisor already owns. To iterate on compute/compute_<module>.py alone - no Gateway, no Orchestrator, no ingress, no camera - use the third button on a Compute row:
AutoSurg: Dummy-Attach Compute (Standalone)
It launches autosurg/workers/run_compute_worker.py itself under debugpy and wires up everything standalone startup does not do on its own (the pre-ADR-0005 workers/ layout is still accepted, so one VSIX serves both trees):
- Interpreter from the module's own
python: / conda_env: entry in modules.yaml (${MAIN_PYTHON} and unresolvable envs fall back to a picker).
env: block replayed verbatim (LL_MODEL_PATH, CUDA_VISIBLE_DEVICES, ...). Standalone startup injects none of it, which is why a hand-started worker usually dies inside on_setup.- SHM keys pre-selected from the module's
depends_on ingress modules, so what gets seeded is what the module reads. Keys whose YAML kind is frozen_pool are flagged: --dummy-shm can only create ring buffers, so those need a real main.py segment (autosurg.dummyExtraArgs).
- Frame source (
random:WxH, a still image, or a video), remembered per module, plus a pre-flight that sizes the encoded frames before the launch.
The pre-flight exists because "it launched" is not "there are frames". --dummy-shm copies ring geometry (capacity / max_data_size / overwrite_mode) verbatim from shared_memory: in the same modules.yaml the worker starts with, so an oversized frame spec only raises ValueError: dummy payload ... exceeds max_data_size after the import cost. The pre-flight performs that same check in a few hundred milliseconds on the interpreter that will run the worker, names a source size that fits, and reports how much /dev/shm the session would occupy.
Bare random (1920x1080 side-by-side noise, ~2.9 MB) is the default because it is the frame size production actually carries; random:960x540 (~0.7 MB) is offered for containers with a small /dev/shm. With the shipped config each frame key allocates capacity x max_data_size = 512 MiB (measured: 1225 MB for a full frame + wrist + action session, 0.89% of this machine's 137 GB), so read the footprint line the pre-flight logs before doing this on a laptop. A still image from disk is what stereo / tracker work actually wants (side-by-side, roughly twice as wide as tall).
Something Has To Send A Request
Frames are seeded once at startup and idle: the compute loop only runs business code when an RPC arrives, so an attached debugger would just sit there. Once the worker answers a ping, the extension offers
AutoSurg: Send Request To Dummy Worker
which sends ping / probe or any custom JSON request to the endpoint your dummy worker bound - and lists the action names it found in <compute_package>/compute_<module>.py (the package comes from the config's workspace: section), so you can fire the real handler your breakpoint sits in. Requests use a dedicated ipc:///tmp/autosurg/dummy/<module>.rep.sock namespace, so a dummy run never touches the real system's sockets. Conversely it never gets routed either: the worker is not registered with any ComputeRegistry, which is why no request arrives unless you send one.
Because a suspended breakpoint holds the reply, autosurg.dummyRequestTimeoutMs is deliberately generous and the timeout message says what a suspend looks like.
Debugging All Compute Modules
Keep main.py running in the terminal, then run from the Command Palette:
AutoSurg: Debug All Compute Modules
The extension hot-attaches and attaches to each enabled Compute in turn. Every Compute uses its own debug port and its own call stack. Modules that are not running are still launched via their original path.
Debugging the Full System
Full-system debugging covers all Orchestrators inside main.py plus every enabled Compute module.
Stop any main.py already running in the terminal.
Click the Debug Full System button at the top of the AutoSurg module view, or run:
AutoSurg: Debug Full System
The extension launches main.py in debug mode.
Once ControlPlane is ready, the extension hot-attaches and attaches to each Compute in turn (no extra restarts for debugging).
While a breakpoint pauses a Compute, that module cannot serve RPC requests, and dependent business calls may time out. When debugging GPU modules, the initial model load may still take a while.
Debugging an Orchestrator
Orchestrators and the Supervisor run inside the same main.py process. Hot-Attaching to any Orchestrator calls debugpy.listen() inside that process (conventional port 5684) and then attaches the debugger; breakpoints in other Orchestrators hit the same session.
Start AutoSurg normally from the command line:
cd system
python3 main.py
Set breakpoints in the target Orchestrator code.
Open the AutoSurg view on the left, find the target Orchestrator, and click the green Hot-Attach.
You can also right-click and choose AutoSurg: Hot-Attach. Clicking other Orchestrators again will not open a second session.
When the system is not running yet, you can still use AutoSurg: Debug Orchestrator to launch main.py in debug mode. If the main process is already under an F5 / Full System session, the extension reuses that session instead of attaching again.
A paused breakpoint freezes the entire main process (all Orchestrators, Gateway, ControlPlane), and dependent business calls may time out.
Viewing Tensors / Mats While Debugging
Example — see the current camera frame and the live point cloud at one
breakpoint:
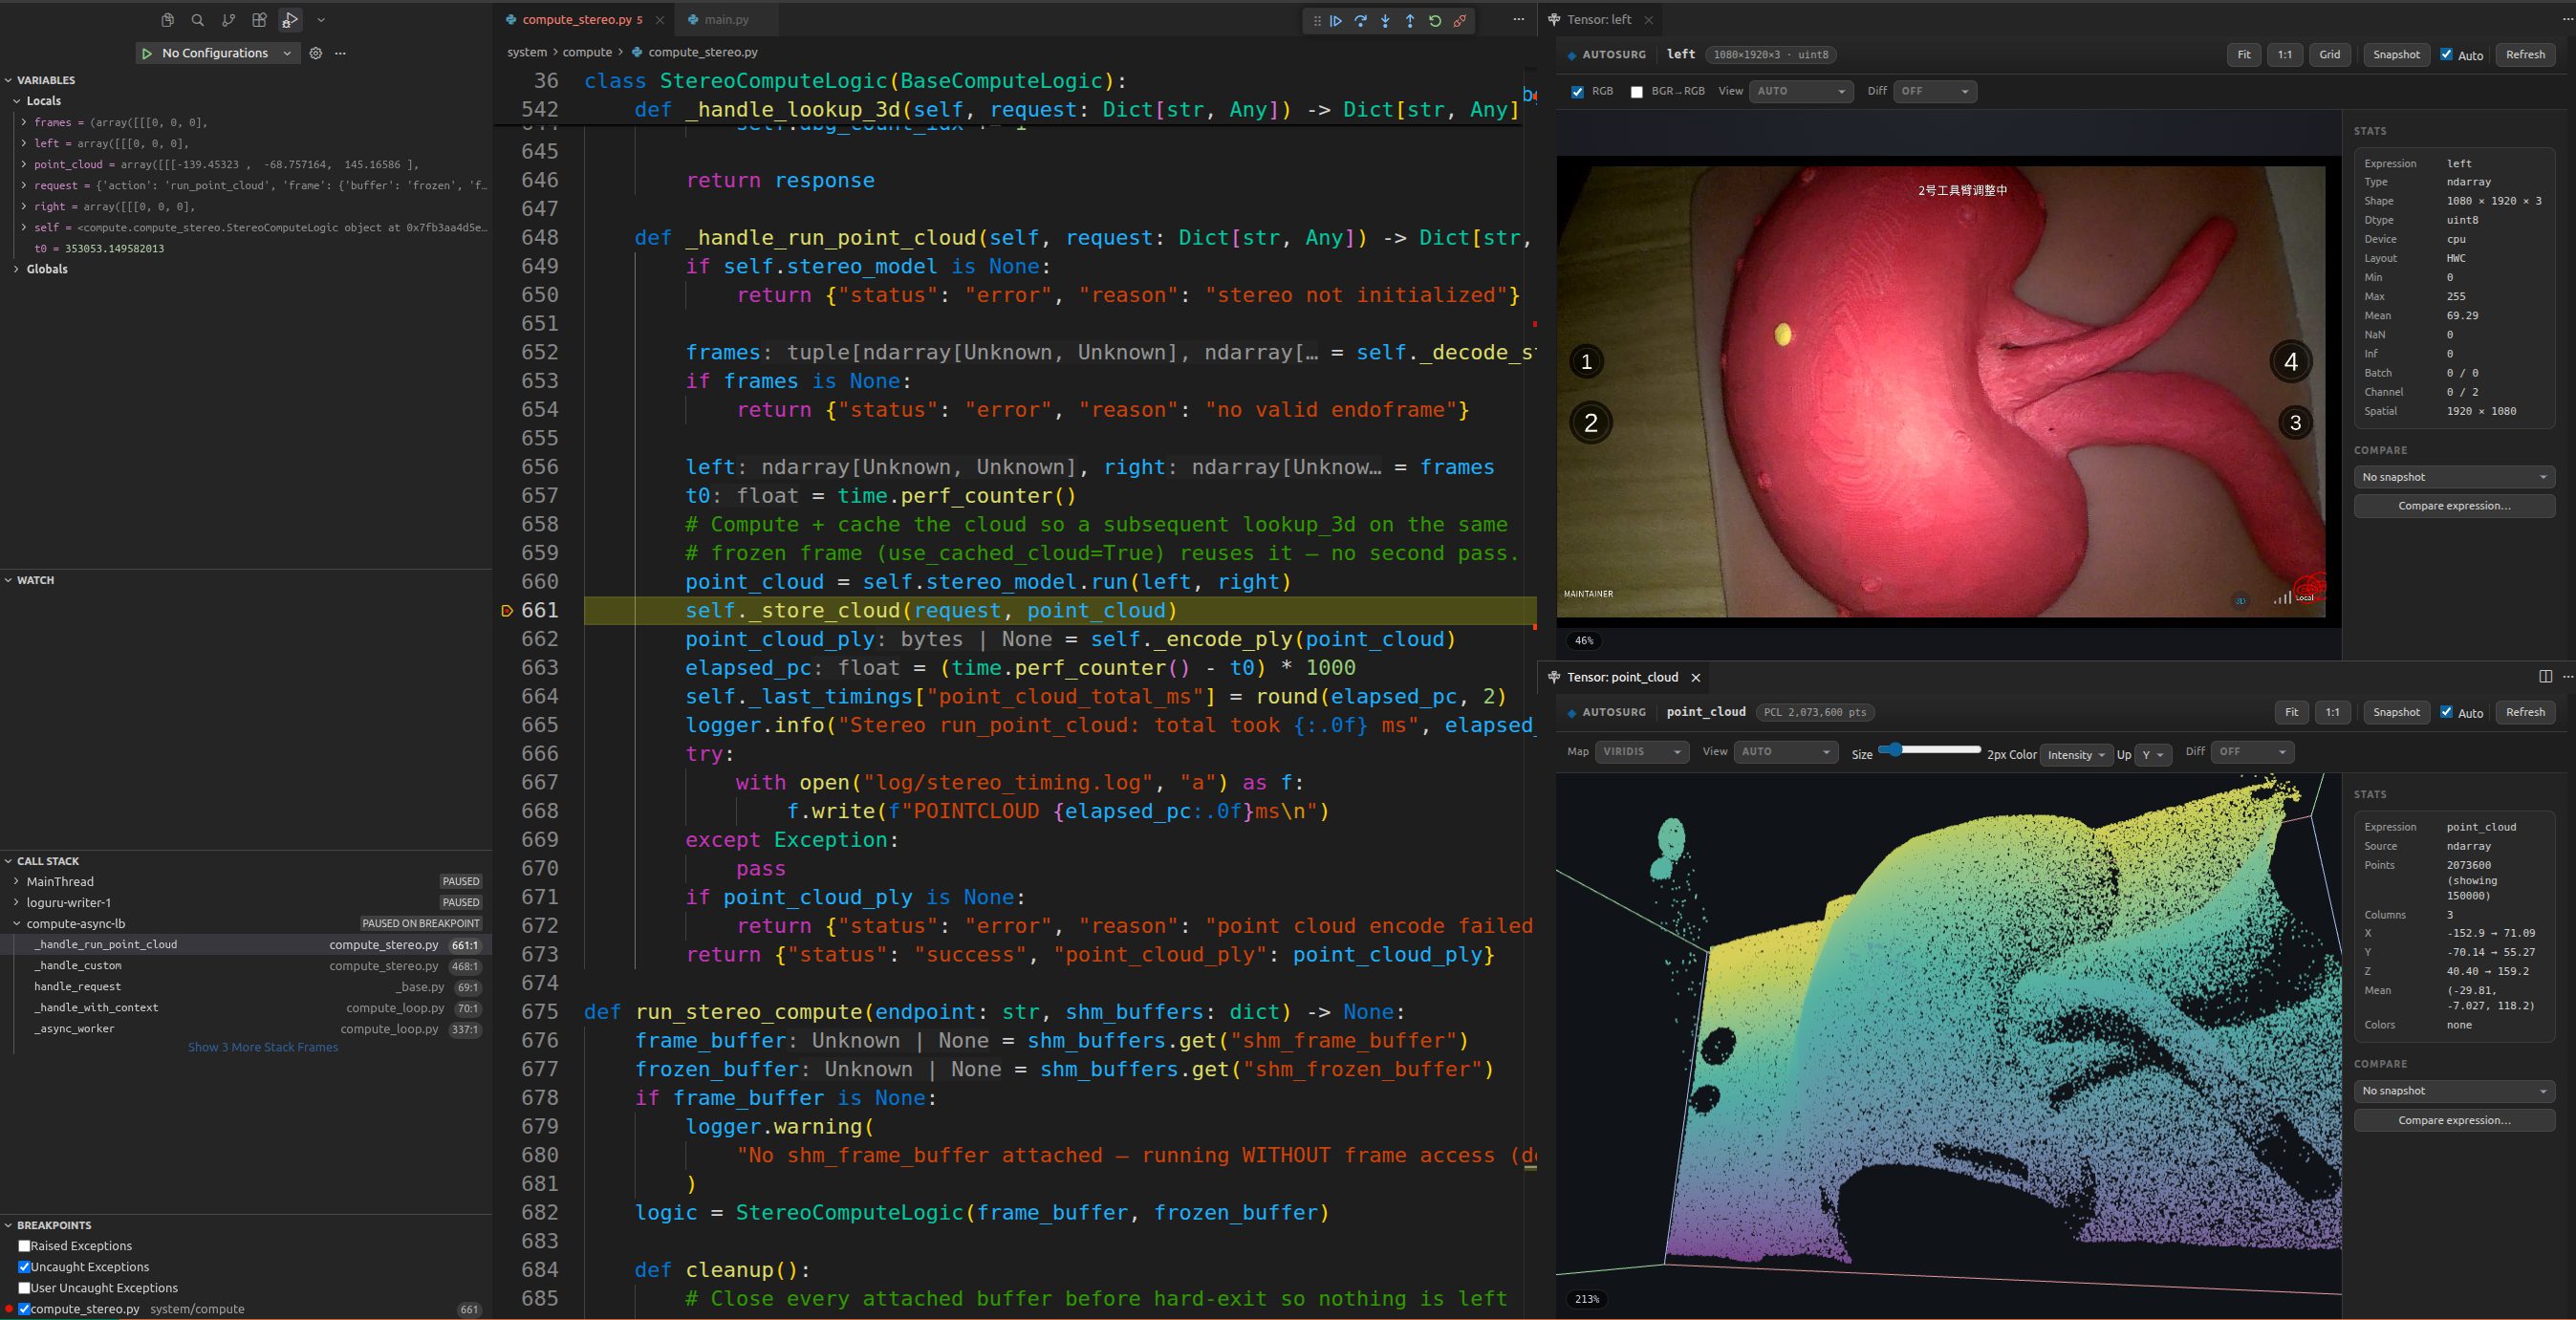
- Attach the compute process (single-module debug or Multi-Attach) and pause
on the line of interest — in this screenshot
_handle_run_point_cloud
just decoded the stereo frames and computed point_cloud.
- Image: click the eye icon on
left / right in Variables (or hover, or
run View Tensor…). The panel shows the (H, W, 3) uint8 frame with
RGB/BGR→RGB, batch/channel sliders and a zoom HUD; the header chip prints
1080×1920×3 · uint8.
- Point cloud: right-click
point_cloud → View as Point Cloud (force) on
the second panel — the chip reports PCL 2,073,600 pts after
downsampling; adjust point size, colouring (intensity/viridis here), up
axis and rotation freely.
- The Stats card tracks dtype/shape/min/max/mean/NaN live; use Snapshot +
Compare to diff two frames of the same expression.
After a breakpoint pauses execution, you can visually inspect torch.Tensor, numpy.ndarray, PIL images, OpenCV images, and C++ cv::Mat.
- Right-click a variable in the Variables or Watch pane and choose AutoSurg ▸ View as Image / Tensor.
- Or select an expression in Python code and press
Ctrl+Alt+I (Cmd+Alt+I on macOS).
- The view supports wheel zoom, drag-to-pan, Fit / 1:1, Batch/Channel slicing, pseudo-color, and BGR/RGB toggle.
- A pixel grid appears above 400% zoom; hovering shows coordinates and raw values.
- Auto-refresh is on by default: opened views refresh automatically after F10 / F11 steps.
- Hovering a tensor/image variable in code shows a mini thumbnail; click the link in the hover to open the full view.
- Multi-channel tensors can be tiled via
Grid; click a thumbnail to enter that channel.
Snapshot saves the current frame; Diff supports side-by-side or residual heatmap, and can also compare against another expression.
Data is encoded to PNG inside the debugged process memory and streamed to the webview over DAP—no temporary files are written.
Hover thumbnails can be disabled with the autosurg.tensorHover setting.
Viewing Point Clouds
Arrays with shape (N, 3) … (N, 7) (xyz, optional intensity or RGB), Open3D / trimesh point clouds, and .ply files are rendered as interactive 3D point clouds in the same viewer:
- Right-click a point-cloud variable while paused and choose AutoSurg ▸ View as Image / Tensor, force point-cloud rendering with AutoSurg ▸ View as Point Cloud (Force) (Variables / Watch / selected code), or open a
.ply file with AutoSurg: Open Point Cloud (PLY)... (also available from the Explorer right-click menu).
- Drag to orbit, Shift+drag (or middle-drag) to pan, wheel to zoom,
Fit to re-center.
Color: Auto / Gray / Intensity / RGB / Height colormap; Up: choose the Z / Y / X up axis; Size: point size in pixels.- Hover a point to see its index, coordinates, and color/intensity.
- Auto-detection is a heuristic. Whenever a variable opens as an image/heatmap but you know it is a cloud, use the
View selector in the viewer toolbar (Auto / Image / Point Cloud) — the forced path also accepts (3, N) transposed, (B, N, C) batched, and (N, 2) planar layouts that auto-detection ignores.
Clouds larger than 150k points are uniformly downsampled for transfer; statistics in the sidebar always report the full cloud. PLY support covers ASCII, binary_little_endian, and binary_big_endian files with x/y/z, optional red/green/blue and intensity properties.
Monitor Dashboard
AutoSurg: Open Monitor Panel (dashboard icon in the sidebar title) opens a
general-purpose watch dashboard:
- Streams · live — fps (with sparkline), frame number, and network latency per image stream, polled from the system WebUI every ~2.5 s. No debugger required.
- Modules — running / restarting / stopped chips for every module at a glance.
- Watches — click + Watch expression, pick the target process (Orchestrator or any attached Compute) and type any expression:
tracker.pose, last_depths.mean(), len(pending_tasks). Because the Debug Adapter Protocol can only evaluate while a process is stopped, values are captured whenever that process pauses (breakpoint hit, step, or pause); each row shows the value, target, and its age. A 10 M-element tensor is subsampled; broken __repr__ objects cannot hang the board.
- Recent events — module lifecycle events (started / crashed / restarted) from the system event bus.
Want continuously-live values for arbitrary expressions? That requires a tiny
read-only evaluate action inside each worker (the protocol boundary is
fundamental, not an implementation shortcut) — see the system-side watch
action proposal discussed with the maintainers.
System Log Stream
AutoSurg: Show System Log Stream tails the live log stream of the running
system over the WebUI WebSocket (port = ControlPlane − 8, i.e. 5552 by
default; override with autosurg.webuiPort). It first backfills up to 200
buffered lines, then follows live and reconnects automatically with backoff.
Each line shows time, level, origin and — when present — the
rid=<request-id> that ties the gateway → orchestrator → compute log lines
of one business request together, which makes cross-module debugging
traceable end to end.
By default the stream renders in a terminal (a processless pseudoterminal)
so it can show colors: levels, timestamps and origins follow Loguru's default
palette (autosurg.logView = terminal). VS Code Output channels can never
render ANSI colors, so pick output (plain text) or both for the classic
panel if you prefer its search UI. Escape sequences from the stream are
sanitized: color codes pass through, everything else (cursor/alt-screen/OSC
control sequences) is stripped, so a hostile log line cannot paint your
prompt. Closing the log terminal disconnects the stream; run the command
again to reconnect.
Validating Configuration
Click the validate button at the top of the AutoSurg module view, or run:
AutoSurg: Validate Configuration
Results are shown in the Problems pane. Two checkers contribute: the extension's own YAML checks (syntax, duplicate keys, dependency references, path presets - anchored to the exact column), and the framework's own validator, python -m autosurg.runtime.module_registry --config <path> run with autosurg.controlPython. The second one is what keeps the extension honest about the current schema - field-name allowlists, the workspace: package names, shared_memory: kinds, replica/load_balance combinations, orchestrator requires wiring and port clashes are the registry's rules, and mirroring them in TypeScript would mean the extension keeps saying "valid" the week the schema grows a field. When that interpreter cannot import autosurg you get an Information note instead of a false green light; turn the pass off with autosurg.validateWithFramework.
Triaging A Crash
AutoSurg: Show Crashes lists the crash bundles the running supervisor recorded and opens the one you pick as a readable document: reason, exit code / signal, OOM flag, auto-restart state, the last request the worker was serving, and the stderr tail - followed by the raw bundle. Because the query goes over the ControlPlane, it works when system/log/ lives on the GPU box and not on your laptop. If the bundle's stderr_path is reachable locally it is opened too; otherwise the path is offered for copying so you can scp it.
The same detail arrives unasked: module:crashed is published on the system event bus, the extension relays it, and the toast carries reason, exit code, OOM and the last stderr line with Open Crash Bundle / Show Module Logs / Copy Summary buttons. So a worker that dies while you are editing another file lands in front of you instead of being discovered when the next request times out.
AutoSurg: Query Module Logs is the log-directory-free equivalent of grepping: it filters the structured event log by level and optional request_id (a replica row filters to that replica) and opens the result as a document, which is what you want after a crash - the surviving process's log lines around the death, not a terminal scrollback.
Extension Settings
autosurg.configPath: path to modules.yaml; relative paths resolve against the workspace rootautosurg.controlHost: ControlPlane address, defaults to localhostautosurg.controlPython: Python used to run the ControlPlane client, defaults to python3autosurg.diagnosticsFolder: folder for attach-attempts.jsonl; empty means the extension's global storage folderautosurg.debugPortBase: first port tried when auto-assigning debug ports, defaults to 5678autosurg.preferConventionalDebugPorts: Restart-Attach asks for the module's own AUTOSURG_DEBUG_PORT, else the conventional launch.json port (replica n = base + n), instead of the first free port from autosurg.debugPortBase; on by defaultautosurg.validateWithFramework: run the framework's module_registry validator during config validation, on by defaultautosurg.webuiPort: WebUI port used by the log stream and the replica actions; 0 means ControlPlane port − 8 (5552)autosurg.logDir: log directory for the analysis panel. When empty the extension follows the framework's own variables - AUTOSURG_LOG_DIR, then <AUTOSURG_WORKSPACE>/log - and only then derives <system>/log next to modules.yaml, so a launch that already sets them needs no setting here; the panel's status bar names the source that wonautosurg.dummyNFrames: how many leading slots of each dummy buffer hold frames, defaults to 8; it does not size the segment - capacity and max_data_size come straight from modules.yamlautosurg.dummyFrameSource: default frame source for dummy debugging (random, random:WxH[:mono], or an image/video path); empty means bare random, i.e. a production-size noise frame. Slot caps come from modules.yaml, not from this extensionautosurg.dummyShmKeys: override which SHM keys get seeded instead of deriving them from depends_onautosurg.dummyEndpointDir: endpoint prefix, defaults to ipc:///tmp/autosurg/dummy so dummy runs never collide with live system socketsautosurg.dummyExtraArgs: extra raw CLI args, e.g. a real --shm ...:frozen_pool attachautosurg.dummyPreflight: probe frame specs before launching, on by defaultautosurg.dummyReadyTimeoutS / autosurg.dummyRequestTimeoutMs: ping budget while the worker boots, and how long a request waits for its replyautosurg.dummyConsole: where the worker's stdout goes (integratedTerminal by default, so Ctrl+C reaches it)autosurg.tensorHover: show tensor thumbnails on hover while the debugger is paused, on by default
Troubleshooting
Module status is unavailable
Make sure main.py is running and that the environment pointed to by autosurg.controlPython has pyzmq installed.
A module never becomes ready while debugging
Check system/log/latest_log.log for startup errors of the target worker. Common causes include a wrong Python environment, missing CUDA libraries, or debugpy failing to import.
Business requests time out while debugging
Business requests can be sent right after a successful hot-attach. If the program is stopped at a breakpoint, that Compute's RPC calls will wait and may trigger client-side timeouts.
Hot-attach failed
Hot-Attach does not silently restart anything: when it cannot inject, it stops and tells you why. The message names one concrete cause, for example
stereo: debugpy is not importable inside the target module [debugpy_import_failed] → install debugpy in that module's interpreter;stereo: ControlPlane does not support start_debug at all [action_not_supported] → the running main.py predates hot-attach; restart the system, or use Restart-Attach;stereo: The worker is listening, but VS Code did not start the attach [attach_refused] → a stale session from another window; run Developer: Reload Window;stereo: could not reach the ControlPlane [control_plane_offline] → start main.py, or fix autosurg.controlHost.
Every failure offer Copy Diagnostics (also AutoSurg: Copy Attach Diagnostics, and the report icon in the module view title). The bundle contains the extension/VS Code versions, the ControlPlane endpoint, active debugger sessions, reserved ports, and the last attach attempts with their raw replies — paste it instead of describing what you clicked. Attempts are also appended to attach-attempts.jsonl in the extension's global storage folder; point autosurg.diagnosticsFolder somewhere shared to collect them.
Only when you choose Restart-Attach is the module restarted (which clears in-process state). If you want that behaviour automatically, that is a deliberate choice: an auto-restart hides whether debugpy injection itself is broken.
Breakpoints in the worker never hit although Hot-Attach reported success
Check which process the session is attached to: a listener inside main.py means the name was resolved as an orchestrator. The tree addresses Computes with --compute, so this now only happens if you attach by hand with --module, or if two windows attach at once. With several replicas an RPC only reaches one of them - scale to a single replica, or clone one and debug that.
Debug Full System refuses because another instance is running
The message names the instance when it can read the runtime directory (/tmp/autosurg/<pid>/instance.json): pid, workspace and config path. That distinguishes a colleague's session from your own orphaned run, and Copy Instance Info puts the same text on the clipboard. AUTOSURG_ALLOW_CONCURRENT_INSTANCE=1 starts around the guard when a second instance is deliberate.
The dummy worker launched but never answers a ping
Check the worker's own terminal first - the extension only says "not ready", the reason is in the worker's stderr. Usual causes, in order:
- the frame source was larger than the yaml's
max_data_size slot and the worker died at startup (the pre-flight normally catches this before launching)
- the interpreter resolved to an environment without the module's dependencies; the extension asks for a path when
conda_env is unreachable from this shell, and answering with a system Python produces exactly this symptom
- a relative path in the module's
env: block does not resolve from the worker's cwd (standalone runs with cwd = system/)
- the module is simply slow: GPU modules spend minutes in
on_setup, so raise autosurg.dummyReadyTimeoutS
Show Dummy Output on any of these dialogs opens the AutoSurg Dummy log, which records the resolved interpreter, the exact worker argv, the pre-flight verdict, and one line per request/response.
Author
Zacario Li
zacario.li@outlook.com
License
MIT

