Dev Doctor Pro
Project health, made actionable.
Find common project problems inside VS Code, prioritize the findings, and follow practical recommendations. Designed primarily for JavaScript and TypeScript projects, with additional checks for React, Next.js and Three.js.
What you get
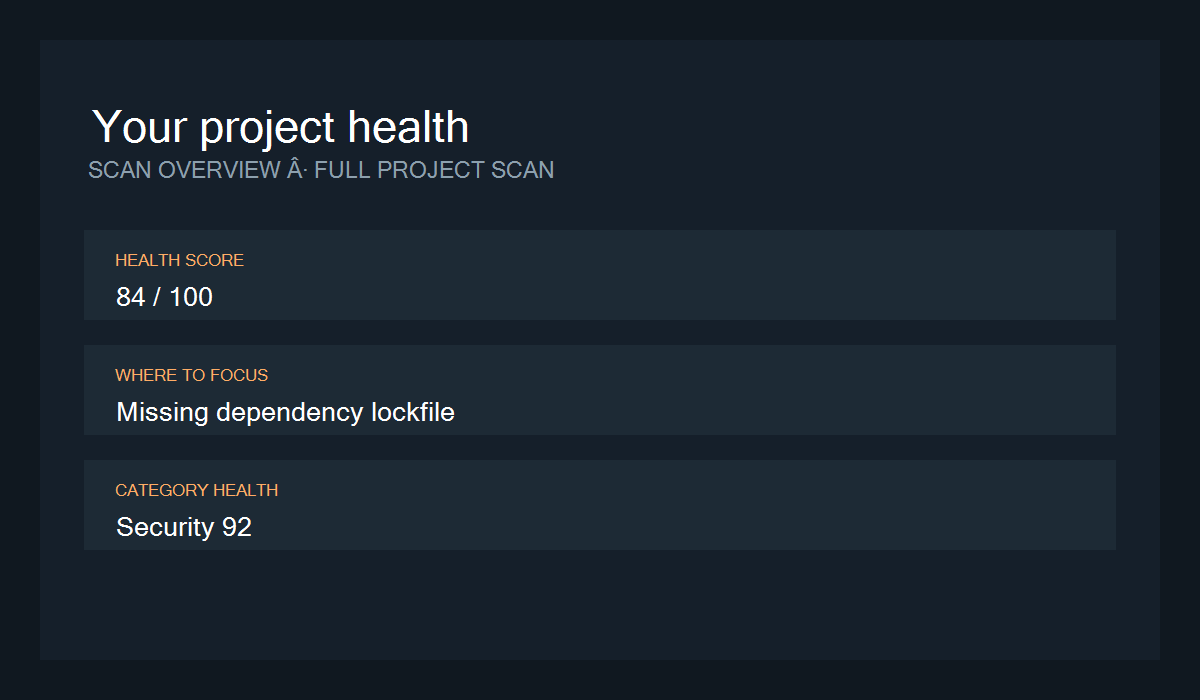
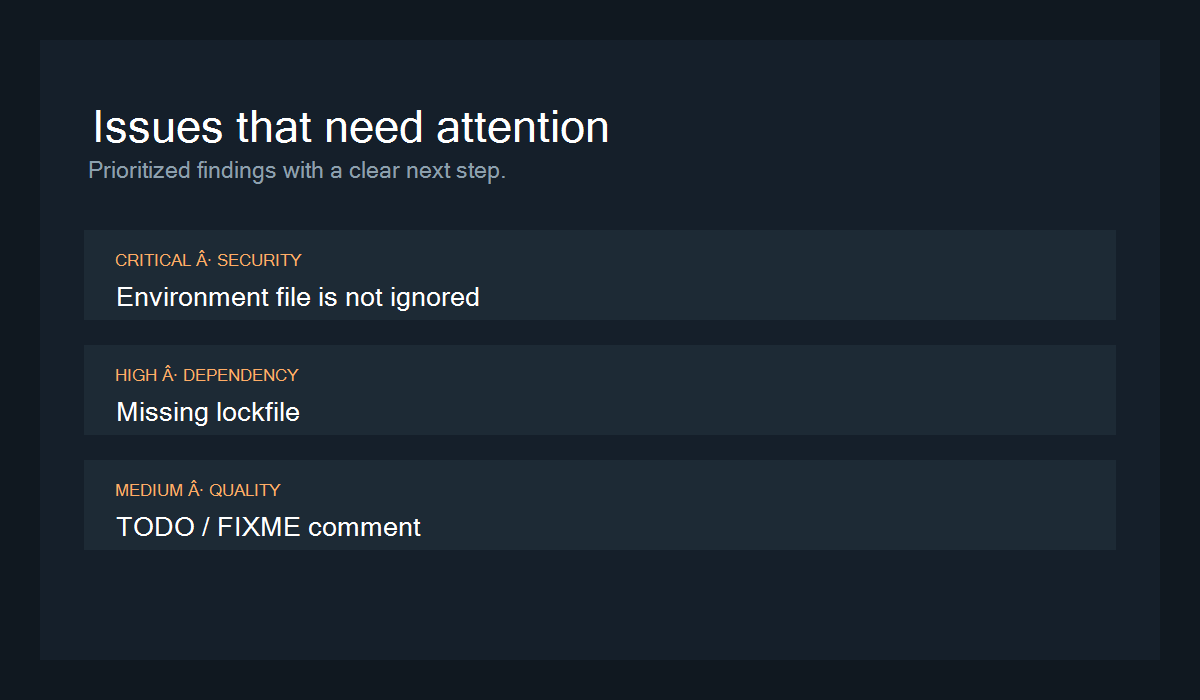
- An actionable dashboard: a health snapshot, real severity counts, top recommendations, category scores and scan timing.
- Nine scanners: dependencies, security patterns, code quality, configuration, assets, performance, React, Next.js and Three.js.
- Lightweight checks on save: code quality and React/Next.js checks update the Problems panel for the saved file. They do not rerun every project scanner.
- Project and workspace scanning: scans are scoped to workspace folders, support cancellation, and retain previous results when cancelled or failed.
- Editable fixes: standalone debugger removal, dependency removal with confirmation, and gitignore updates use VS Code edits. Review and save the change, then scan again.
- Markdown reports: choose where to save a report for review with your team.
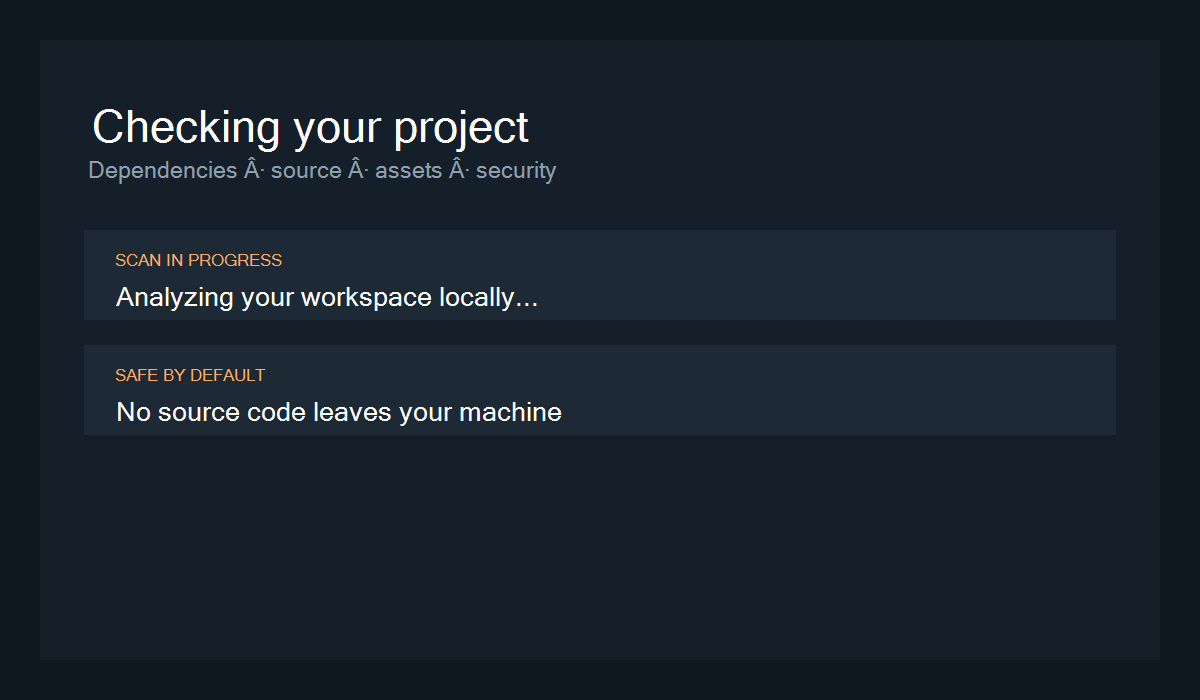
- Local operation: scanning does not send source code to an external service or require an account.
Get started
- Open a project folder in VS Code.
- Select the Dev Doctor shield icon in the Activity Bar, or run Dev Doctor: Show Dashboard.
- Select Scan project. Inspect the top findings and use Explore all findings to navigate to source locations.
- Review recommendations and any available fixes. Save edited files and scan again to refresh the dashboard snapshot.
- Select Export report to save a Markdown summary.
A status-bar shortcut keeps the dashboard within reach. Automatic startup scanning runs without opening the sidebar.
Screenshots
Commands
Use the Command Palette to run Scan Project, Scan Workspace, Scan Current File, Scan Dependencies, Scan Security, Scan Performance, Scan Assets, Show Dashboard, Show Issues, Generate Report, or Clear Cache, under the Dev Doctor category.
Current-file scanning runs lightweight quality and framework checks. Category scans replace the dashboard snapshot with the selected scope; their score does not represent a full-project assessment.
Settings
| Setting |
Default |
Purpose |
devDoctor.autoScan |
true |
Run a project scan after activation. |
devDoctor.scanOnSave |
true |
Run lightweight checks on saved files. |
devDoctor.exclude |
generated/vendor directories |
Directory names omitted from project scans. |
devDoctor.maxFileSize |
10485760 |
Skip content reads larger than 10 MB. Asset checks still inspect file sizes. |
devDoctor.enableSecurityScan |
true |
Enable security pattern checks. |
devDoctor.enableAssetScan |
true |
Enable asset checks. |
devDoctor.enableThreeScan |
true |
Enable Three.js-specific checks. |
Understanding results
The health score is a heuristic based on findings from enabled checks. It is not proof that a project is secure, correct, or production-ready. Checks use text patterns and can produce false positives or miss issues. Dependency checks do not query a vulnerability database. An apparently unused dependency may be loaded by configuration or at runtime.
Excluded directories are not inspected. To inspect production bundles, remove their directories from devDoctor.exclude and check VS Code search exclusions. Files above the content-size limit are not inspected for code or secret patterns. File counts show discovered files, not a guarantee that every scanner inspected every file.
Environment ignore checks cover common root-file patterns; they do not determine whether a file is already tracked by Git. Potential duplicate assets are identified by name and size, not content hashes. Saved-file checks update Problems; the dashboard and exported report remain the last completed scan snapshot.
Development
npm install
npm run check
npm run lint
npm run package
check runs TypeScript validation, dashboard JavaScript syntax validation, unit tests, and the production build. Use VS Code's Extension Development Host for manual interaction checks. The package is built from dist/extension.js and the media assets.
The icon's editable vector source is media/brand-icon.svg; media/dev-doctor.svg is the monochrome Activity Bar mark.

