Plotly Express Snippets
This extension is for data scientists writing Python code to create statistical and scientific graphics using Plotly Express. It provides code snippets that work with Python (.py) files or (.ipynb) notebooks to make the process of working with Plotly Express even more fun. Snippets reduce the amount of Python syntax to remember, eliminate keystrokes, and help free the data scientist to focus on understanding their data.
Gallery of sample visualizations created using this extension. Contains information provided by the UK Oil and Gas Authority and/or third parties.
Usage
Overview
All snippets provided by this extension have triggers prefixed px, which activate the IntelliSense pop up or allow filtering in the Command Palette. Trigger prefixes are further organised as follows:
| Prefix |
Description |
px-setup |
Starting point for creating figures and setting defaults. |
px-read |
Read datasets from common file formats. |
px-fig |
Create over 30 types of statistical and scientific graphics figures. |
px-update |
Update layout and data trace styling of existing figure. |
px-args |
Select arguments from lists of options to modify figure styling. |
|
|
A typical sequence is to: (a) start with px-setup, (b) read data files with px-read, (c) create figures with px-fig, and (d) optionally adjust styling with px-update and px-args.
See the Features section below for a full list of the available snippets and their prefix triggers.
Inserting snippets
Inserting Plotly code snippets into your Python code is easy. Use either of these methods:
Command Palette
Click inside a Python notebook cell or editor and choose Insert Snippet from the Command Palette.
A list of snippets appears. You can type to filter the list; start typing px to filter the list for snippets provided by this extension. You can further filter the list by continuing to type the desired prefix.
Choose a snippet from the list and it is inserted into your Python code.
Placeholders indicate the minimum arguments required to produce a figure. Use the tab key to step through the placeholders.
Intellisense
Start typing px in a Python notebook cell or editor.
The Intellisense pop up will appear. You can further filter the pop up list by continuing to type the desired prefix.
Choose a snippet from the pop up and it is inserted into your Python code.
Placeholders indicate the minimum arguments required to produce a figure. Use the tab key to step through the placeholders.
You can also trigger Intellisense by typing Ctrl+Space.
Features
Plotly Express Setup Snippets
The following snippets are triggered by px-setup and provide the starting point for creating figures. Usually inserted near the beginning of a code file or notebook, px-setup is the key snippet for importing the required modules and setting defaults that apply to all figures.
| Prefix |
Description |
px-setup |
Provides the initial starting point for creating figures. Imports pandas, plotly.express, and plotly.io modules; provides choice of default figure template and renderer from option lists. |
px-setup-mapbox_token |
An access token enables the full suite of mapbox styles in scatter_mapbox, density_mapbox, line_mapbox, and choropleth_mapbox figures. This snippet reads the file specified in the placeholder and registers the token to allow access to all mapbox_style options. Deprecated from Plotly 5.24. |
Read Pandas and JSON Data Snippets
The following snippets are triggered by px-read and provide features for creating pandas data frames from Comma Separated Value (.csv) and Microsoft Excel (.xlsx) files, and for reading data from GeoJSON (.geojson) files.
Data frames are the main data source for Plotly Express figures, and GeoJSON dictionary objects are an important source of geospatial data for choropleth and choropleth_mapbox figures.
| Prefix |
Description |
px-read-csv |
Read CSV (.csv) file into pandas data frame and report information. |
px-read-excel |
Read Excel (.xlsx) file into pandas data frame and report information. |
px-read-feather |
Read Feather (.feather) file into pandas data frame and report information. |
px-read-geojson |
Read GeoJSON (.geojson) file into Python dictionary object and print contents. |
px-read-parquet |
Read Parquet (.parquet) file into pandas data frame and report information. |
px-read-plotly |
Create and show a Plotly figure from the definition stored in a JSON (.json) file. |
|
|
The following snippets are triggered by px-fig and provide features for creating over 30 different types of statistical and scientific graphics figures. Despite this variety, the consistent design of Plotly Express allows all figures to be created by a single function call with arguments representing selected columns of a pandas data frame. An exception is the imshow figure which is created from data on a regular 2D raster.
These snippets use placeholders to indicate a minimal set of figure creation arguments. Use the tab key to step through the placeholders. A key placeholder is for the data_frame argument which provides the data source for most figures; you can either type the name of a data_frame variable at this placeholder, or you can automatically populate this placeholder by first selecting the variable name in your code before triggering one of these snippets.
You can use these snippets to create initial figures which you can then refine and modify either by using px-update and px-args snippets or by using the extensive Python interface for Plotly. For more information check out the Python interface documentation for Plotly Express (see References).
| Prefix |
Description |
px-fig-scatter |
Create scatter figure. |
px-fig-scatter_3d |
Create scatter_3d figure. |
px-fig-scatter_polar |
Create scatter_polar figure. |
px-fig-scatter_ternary |
Create scatter_ternary figure. |
px-fig-scatter_mapbox |
Create scatter_mapbox figure. Deprecated from Plotly 5.24. |
px-fig-scatter_map |
Create scatter_map figure. |
px-fig-scatter_geo |
Create scatter_geo figure. |
px-fig-line |
Create line figure. |
px-fig-line_3d |
Create line_3d figure. |
px-fig-line_polar |
Create line_polar figure. |
px-fig-line_ternary |
Create line_ternary figure. |
px-fig-line_mapbox |
Create line_mapbox figure. Deprecated from Plotly 5.24. |
px-fig-line_map |
Create line_map figure. |
px-fig-line_geo |
Create line_geo figure. |
px-fig-area |
Create area figure. |
px-fig-bar |
Create bar figure. |
px-fig-timeline |
Create timeline figure. |
px-fig-bar_polar |
Create bar_polar figure. |
px-fig-violin |
Create violin figure. |
px-fig-box |
Create box figure. |
px-fig-ecdf |
Create ecdf figure. |
px-fig-strip |
Create strip figure. |
px-fig-histogram |
Create histogram figure. |
px-fig-pie |
Create pie figure. |
px-fig-treemap |
Create treemap figure. |
px-fig-sunburst |
Create sunburst figure. |
px-fig-icicle |
Create icicle figure. |
px-fig-funnel |
Create funnel figure. |
px-fig-funnel_area |
Create funnel_area figure. |
px-fig-scatter_matrix |
Create scatter_matrix figure. |
px-fig-parallel_coordinates |
Create parallel_coordinates figure. |
px-fig-parallel_categories |
Create parallel_categories figure. |
px-fig-choropleth |
Create choropleth figure. |
px-fig-choropleth_mapbox |
Create choropleth_mapbox figure. Deprecated from Plotly 5.24. |
px-fig-choropleth_map |
Create choropleth_map figure. |
px-fig-density_contour |
Create density_contour figure. |
px-fig-density_heatmap |
Create density_heatmap figure. |
px-fig-density_mapbox |
Create density_mapbox figure. Deprecated from Plotly 5.24. |
px-fig-density_map |
Create density_map figure. |
px-fig-imshow |
Create imshow figure. |
|
|
Plotly provides a number of functions for adjusting the layout and data trace style of an existing figure. The following snippets are triggered with px-update and provide features for easily updating these figure components.
| Prefix |
Description |
px-update-autorange |
Update the axis range of an existing figure. Provides a placeholder for update_xaxes() or update_yaxes() functions in addition to a placeholder for the autorange argument. Use this snippet to reverse the direction of an axis using autorange='reversed'. |
px-update-margin |
Update layout margins of an existing figure. Use this snippet to make better use of your display area by adjusting the white space around a plot. Provides placeholders for the top (t), bottom (b), left (l), and right (r) margins. Set all zero to maximize the plot area. |
px-update-marker |
Update trace marker symbol, color and size of an existing figure. Provides placeholders for marker_color, marker_opacity, marker_symbol, and marker_size with arguments presented in option lists where appropriate. |
px-update-rangeselector |
Add a rangeselector to an existing figure. A rangeselector adds a button control to set the axis range to a specified interval. Provides placeholders for count, step, and stepmode with arguments presented in option lists where appropriate. Use this snippet to help navigate a long time series dataset. |
px-update-rangeslider |
Add a rangeslider to the x axis of an existing figure. A rangeslider adds controls to interactively scroll and set the axis range. Provides placeholders for xaxis_rangeslider_visible and yaxis_fixedrange. Use this snippet to help navigate a long time series dataset. |
px-update-scaleratio |
Update axis layout of an existing figure, anchoring the y axis to the x axis, and fixing the scale ratio between them. Provides a placeholder for yaxis_scaleratio. Use this snippet to configure a scatter plot for geospatial data, avoiding distortion by fixing the scales at 1:1. |
px-update-text |
Update trace text position, font color, and font size of an existing figure. Provides placeholders for textposition, textfont_color, and textfont_size with arguments presented in option lists where appropriate. |
px-update-scene-aspectratio |
Update the aspect ratios of a 3d scene in an existing figure. Provides placeholders for x, y, and z aspect ratios of the scene layout component. Use this snippet to configure the appearance of a 3d surface plot, or a 3d scatter plot. |
px-update-scene-aspectmode |
Update the aspect mode of a 3d scene in an existing figure. Provides a placeholder for the aspectmode of a scene layout component to control how the scene's aspect ratio is determined. Use this snippet to configure the appearance of a 3d surface plot, or a 3d scatter plot. |
px-update-scattermatrix-parts |
Update the visibility of the parts of a scatter matrix figure. Provides placeholders for diagonal_visible, showlowerhalf, and showupperhalf to configure which of the diagonal, upper, or lower parts are shown. Use this snippet to customize the display of a scatter matrix by showing or hiding specific parts. |
|
|
A number of Plotly function arguments take their values from extensive option lists. The following snippets are triggered with px-args and provide features allowing you to easily select valid argument values from lists of available options.
Some argument snippets, like px-args-template, px-args-mapbox_style, and px-args-projection, provide arguments for functions that create figures (see Plotly Express Figure Snippets), others provide arguments for use in different contexts: px-args-renderer for the figure show() method, and px-args-marker_symbol for the figure update_traces() method.
| Prefix |
Description |
px-args-color_continuous_scale |
Choose a color scale from list of named Plotly options including normal and reversed (*_r) scales. You can provide this argument when creating a Plotly Express figure or to the update_traces() method to set the scale for color posting. |
px-args-mapbox_style |
Choose figure mapbox_style argument from option list. You can provide this argument when creating scatter_mapbox, line_mapbox, choropleth_mapbox, or density_mapbox figures if you need to style the underlying cultural/satellite imagery. Some options also require an access token, refer to the documentation (see References) for more information. Deprecated from Plotly 5.24. |
px-args-map_style |
Choose figure map_style argument from option list. You can provide this argument when creating scatter_map, line_map, choropleth_map, or density_map figures if you need to style the underlying cultural/satellite imagery. |
px-args-marginal |
Choose marginal distribution style from list of options. You can provide this argument when creating a histogram or ecdf figure. |
px-args-marginal_x |
Choose x-axis marginal distribution style from list of options. You can provide this argument when creating a scatter, density_contour, or density_heatmap figure. |
px-args-marginal_y |
Choose y-axis marginal distribution style from list of options. You can provide this argument when creating a scatter, density_contour, or density_heatmap figure. |
px-args-marker_color |
Choose marker color from list of named CSS options. You can provide this argument to the figure update_traces() method to set the marker color of a scatter figure. |
px-args-marker_symbol |
Choose marker symbol and optional modifiers from option lists. This snippet uses two placeholders to navigate the available marker shapes - the first selects the base symbol type, and the second selects an optional modifier. You can provide this argument to the figure update_traces() method to set the marker symbol of a scatter figure. |
px-args-projection |
Choose geographic map projection argument from option list. You can provide this argument when creating scatter_geo and line_geo figures if you need to choose a specific map projection. |
px-args-rangeselector-button |
Create rangeselector button and choose parameters from lists of options. You can add the result to the list of rangeselector buttons eg. generated with px-update-rangeselector. |
px-args-renderer |
Choose figure renderer argument from option list. You can provide this argument to the figure show() method to override the default renderer setting. |
px-args-scrollzoom |
Configure zoom on mouse scrolling. You can provide this argument to the figure show() method to override the default behaviour. |
px-args-template |
Choose figure template argument from option list. You can provide this argument when creating any Plotly Express figure to override the default template setting. |
px-args-trendline |
Choose a trendline (regression) function from list of options. You can provide this argument when creating a scatter or density_contour figure. |
px-args-trendline_color_override |
Choose a trendline color from list of named CSS options. You can provide this argument when creating a scatter or density_contour figure. |
px-args-trendline_options-lowess |
Choose options for fitting a locally weighted regression (lowess) trendline. Provides a placeholder for the fraction parameter which controls the smoothness of the trendline. The smoothing fraction varies between 0 (minimal smoothing) and 1 (maximum smoothing). You can provide this argument when creating a scatter or density_contour figure. |
px-args-trendline_options-ols |
Choose options for fitting an ordinary least-squares (ols) trendline. Provides placeholders add_constant (if True: fit an intercept, if False: intercept fixed at origin), log_x (if True: apply logarithmic transform to x variable), and log_y (if True: apply logarithmic transform to y variable). You can provide this argument when creating a scatter or density_contour figure. |
px-args-trendline_scope |
Choose a trendline scope from list of options. The scope controls whether the regression is performed on each data trace individually (trace) or on all the data taken together (overall). You can provide this argument when creating a scatter or density_contour figure. |
|
|
Release Notes
Plotly Version
The snippets provided by this extension were developed using Plotly 5.24 but will also produce working Python code for earlier versions of Plotly. The known exceptions are:
px.scatter_mapbox, px.line_mapbox, px.choropleth_mapbox, and px.density_mapbox are deprecated starting from Plotly 5.24.
px.scatter_map, px.line_map, px.choropleth_map, and px.density_map are introduced from Plotly 5.24, and will completely replace the corresponding mapbox figure types.
px.icicle introduced from Plotly 5.0.0.
px.ecdf introduced from Plotly 5.2.1.
Editor Support for Snippets
Snippets for producing Python code, including those provided by this extension, are supported in the Python file (.py) editor and in the notebook (.ipynb) editor.
Snippets and IntelliSense
When triggered, the default behaviour of IntelliSense is to show snippets along with other context dependent suggestions. This may result in a long list of suggestions in the IntelliSense pop-up, particularly if the snippet trigger provided by this extension (px) also matches other symbols in your editor.
It's easy to modify this behaviour using your Visual Studio Code settings. To access the relevant settings go to Preferences > Settings and type snippets in the Search settings field as shown below:
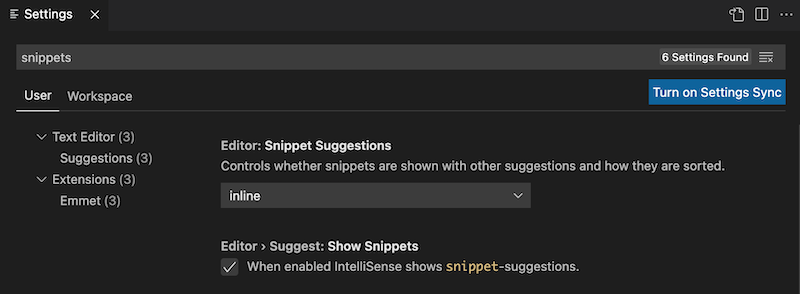
You can control whether snippets are shown with other suggestions and how they are sorted using the Editor: Snippet Suggestions dropdown. Choose one of the options to control how snippet suggestions are shown in the IntelliSense popup:
| Option |
Intellisense |
top |
Show snippet suggestions on top of other suggestions. |
bottom |
Show snippet suggestions below other suggestions. |
inline |
Show snippet suggestions with other suggestions (default). |
none |
Do not show snippet suggestions. |
|
|
You can also use the Editor > Suggest: Show Snippets checkbox to enable or disable snippets in IntelliSense suggestions. When snippets are disabled in IntelliSense they are still accessible through the Command Palette Insert Snippet command.
Reference
Plotly Express
For more information about Plotly Express and for a gallery of Python examples visit https://plotly.com/python/plotly-express/
Plotly Express Python API
For more information on the Python interface to Plotly Express visit https://plotly.com/python-api-reference/plotly.express.html
Plotly is a registered trademark of Plotly Technologies Inc., registered in the United States.
Plotly Express snippet tree
This tree represents the complete hierarchy of all snippets available in the Plotly Express snippets extension, organized by their functional categories. The top-level branches represent the main workflow steps, while leaf nodes represent specific visualization and configuration snippets.
px
├── px-setup
│   ├── px-setup
│   └── px-setup-mapbox_token
├── px-read
│   ├── px-read-csv
│   ├── px-read-excel
│   ├── px-read-feather
│   ├── px-read-geojson
│   ├── px-read-parquet
│   └── px-read-plotly
├── px-fig
│   ├── px-fig-scatter
│   ├── px-fig-scatter_3d
│   ├── px-fig-scatter_polar
│   ├── px-fig-scatter_ternary
│   ├── px-fig-scatter_mapbox
│   ├── px-fig-scatter_map
│   ├── px-fig-scatter_geo
│   ├── px-fig-line
│   ├── px-fig-line_3d
│   ├── px-fig-line_polar
│   ├── px-fig-line_ternary
│   ├── px-fig-line_mapbox
│   ├── px-fig-line_map
│   ├── px-fig-line_geo
│   ├── px-fig-area
│   ├── px-fig-bar
│   ├── px-fig-timeline
│   ├── px-fig-bar_polar
│   ├── px-fig-violin
│   ├── px-fig-box
│   ├── px-fig-ecdf
│   ├── px-fig-strip
│   ├── px-fig-histogram
│   ├── px-fig-pie
│   ├── px-fig-treemap
│   ├── px-fig-sunburst
│   ├── px-fig-icicle
│   ├── px-fig-funnel
│   ├── px-fig-funnel_area
│   ├── px-fig-scatter_matrix
│   ├── px-fig-parallel_coordinates
│   ├── px-fig-parallel_categories
│   ├── px-fig-choropleth
│   ├── px-fig-choropleth_mapbox
│   ├── px-fig-choropleth_map
│   ├── px-fig-density_contour
│   ├── px-fig-density_heatmap
│   ├── px-fig-density_mapbox
│   ├── px-fig-density_map
│   └── px-fig-imshow
├── px-update
│   ├── px-update-autorange
│   ├── px-update-margin
│   ├── px-update-marker
│   ├── px-update-rangeselector
│   ├── px-update-rangeslider
│   ├── px-update-scaleratio
│   ├── px-update-text
│   ├── px-update-scene-aspectratio
│   ├── px-update-scene-aspectmode
│   └── px-update-scattermatrix-parts
└── px-args
    ├── px-args-color_continuous_scale
    ├── px-args-mapbox_style
    ├── px-args-map_style
    ├── px-args-marginal
    ├── px-args-marginal_x
    ├── px-args-marginal_y
    ├── px-args-marker_color
    ├── px-args-marker_symbol
    ├── px-args-projection
    ├── px-args-rangeselector-button
    ├── px-args-renderer
    ├── px-args-scrollzoom
    ├── px-args-template
    ├── px-args-trendline
    ├── px-args-trendline_color_override
    ├── px-args-trendline_options-lowess
    ├── px-args-trendline_options-ols
    └── px-args-trendline_scope
Copyright © 2021-2025 Analytic Signal Limited, all rights reserved.
