perfanno-vscode


Perfanno-vscode is a simple extension that allows users to annotate buffers using perf or py-spy output information. The result is a beautiful heatmap showing developers where performance bottlenecks are slowing down their program.
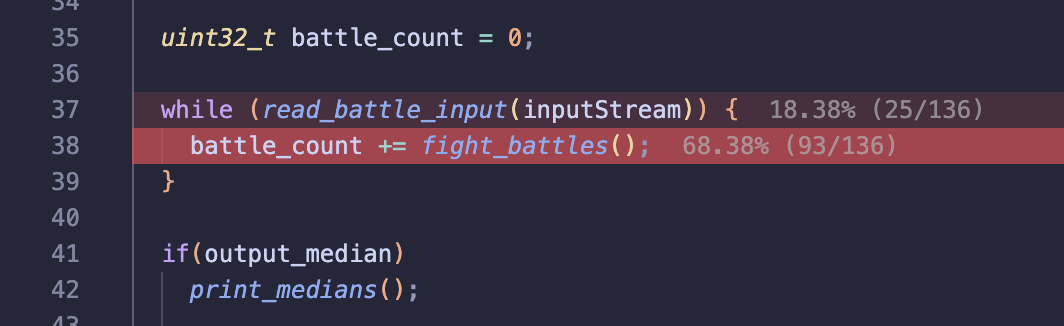
 from https://github.com/MalTeeez/python-perfanno-example
Notes
- Most of the processing algorithm is taken directly from https://github.com/t-troebst/perfanno.nvim. I am not the original author of the code. I ported it to vscode/typescript and added a few features.
- This extension is still in beta. It is not expansive in any way, but it does the job simply and effectively.
- Only C++ programs on MacOS (with perf on Ubuntu) have been tested. But anything that perf can profile should work.
- Python profiling via py-spy raw output is also supported.
- Please report any issues you may find.
Workflow
- Generate profiling information:
perf record --call-graph dwarf ./my_program --some-arg < some_input_etc
optionally, use the following alias by adding it to your `.bashrc` or `.zshrc`:
alias perf_record="perf record --call-graph dwarf"
and run:
perf_record ./my_program --some-arg < some_input_etc
Customization:
-e flag can be used to specify the event to profile. By default, it records cpu-cycles. See perf list for a list of events.-F flag can be used to specify the frequency of the event. For example, -F 1000 will sample every 1000 events.- And many more. See
man perf-record for more information.
- Generate a report:
perf report -g folded,0,caller,srcline,branch,count --no-children --full-source-path --stdio -i perf.data > perf.out
again, you can also use the following alias:
alias perf_report="perf report -g folded,0,caller,srcline,branch,count --no-children --full-source-path --stdio -i perf.data > perf.out"
and run:
perf_report
This command will always be the same. Therefore, if desired, one can chain both commands like so:
perf_record ./my_program --some-arg < some_input_etc && perf_report
- (optional) If you are doing remote development and want to see the heatmap on your local machine, you can use
scp to copy the perf.out file to your local machine. Then, run sed -i '' "s:{REMOTE_DIRECTORY}:{LOCAL_DIRECTORY}:g" "perf.out" to replace any instances of the remote directory with the local directory in the perf report.
- Open a source file in vscode and run the
perfanno.readFile (Perfanno: Read File) command using the command palette. Select the perf.out file generated in the previous step. Success!
Py-Spy Workflow
Perfanno also supports py-spy raw output for profiling Python programs. See https://github.com/MalTeeez/python-perfanno-example/blob/main/tools/perf.sh for an example script.
- Profile your Python program with py-spy using the
raw format and --full-filenames:
py-spy record --full-filenames --idle --native --rate 198 --format raw -o pyspy.txt -- python my_script.py
Customization:
--rate sets the sampling rate in Hz.--native includes native (C/C++) call frames in the output.--idle includes idle threads in the profile.--pid can be used instead of -- to attach to an already-running process.
- Open a source file in vscode and run the
perfanno.readPySpyFile (Perfanno: Read Py-Spy File) command using the command palette. Select the raw output file generated in the previous step.
Extension Commands
perfanno.readFile: Prompts for a perf report file and annotates buffers with the perf information.perfanno.readPySpyFile: Prompts for a py-spy raw output file and annotates buffers with the profiling information.perfanno.pickEvent: Select a perf event to annotate.perfanno.clearHighlights: Clears all annotations and highlights.perfanno.clearStoredFilePaths: Clears stored default paths to report files.perfanno.highlightLine: Highlights the current line. Used to test certain highlighter capabilities.
Extension Settings
perfanno.perfFile: Perf data file to search for in project root. Will prompt with finder if file does not exist. Can be a file path.perfanno.pyspyFile: Py-Spy raw file to search for in project root. Will prompt with finder if file does not exist. Can be a file path.perfanno.eventOutputType: Specifies the output format for virtual text when annotating.perfanno.localRelative: Whether to show count relative to enclosing symbol (high sample count recommended).perfanno.highlightColor: The color of the highlight.perfanno.minimumThreshold: The minimum percentage threshold for annotating.perfanno.onlyLocalLeaf: Collapse each trace to its deepest in-workspace frame.
