⬛ Blackbox
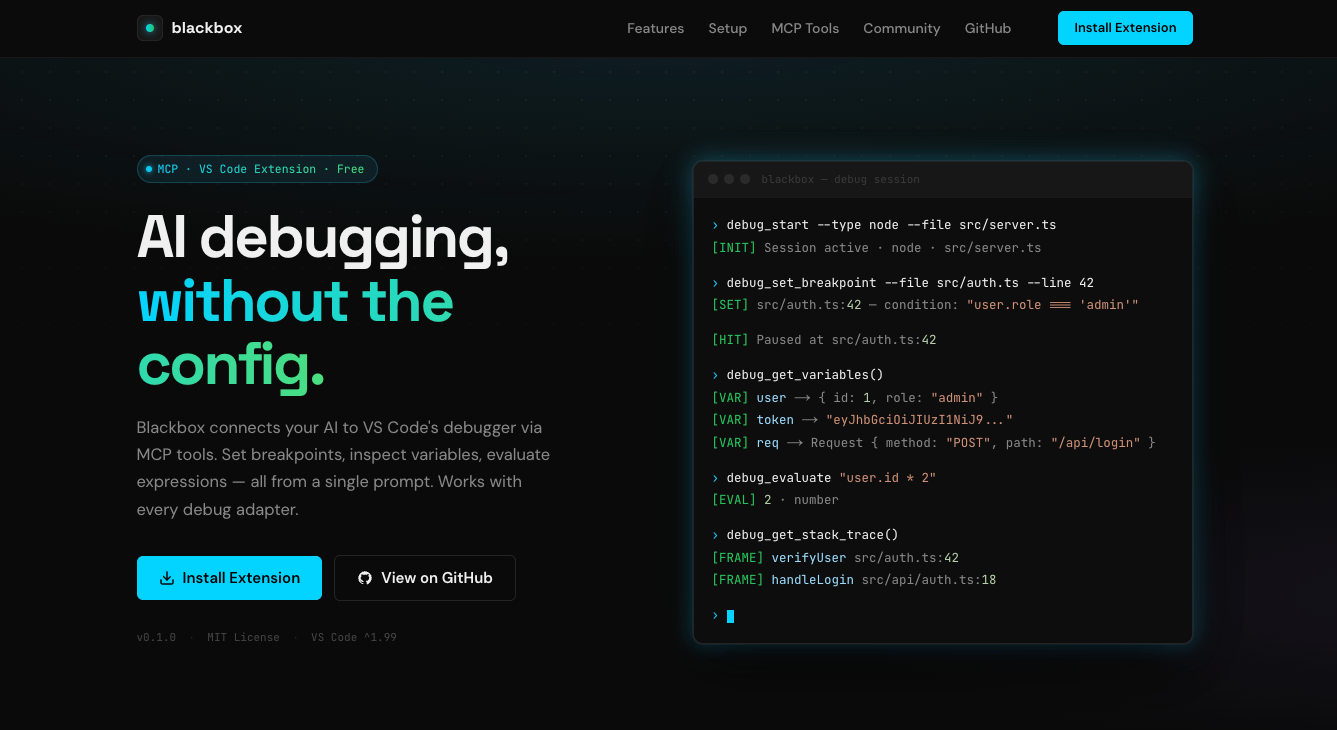
AI-driven debugging for any language — set breakpoints, start/stop debug sessions, inspect variables, and navigate code via MCP tools.


Overview
Blackbox works seamlessly with any Debug Adapter Protocol (DAP) compatible debugger, including PHP, Node.js, Python, Go, C/C++, Java, and more.
Pre-release — This extension is under active development. Install the pre-release version to get the latest features.
Made with ❤️ by Akash Aman
✨ Features
🛑 Breakpoint Management
- Set, remove, and list breakpoints with conditions and log messages.
- Batch operations for multiple breakpoints at once.
🐞 Debug Session Control
- Start, stop, and restart debug sessions for any language.
- Continue, pause, step over, step into, and step out.
- Language-agnostic — works with any VS Code debug adapter.
🔍 Variable Inspection
- Get all variables in the current scope.
- Deep inspect nested objects and arrays.
- Evaluate arbitrary expressions at breakpoints.
- Persistent watch expressions across steps.
📁 Editor & Workspace
- Open files at specific lines.
- Find files by glob pattern.
- Get diagnostics (errors/warnings) from all language services.
⚙️ How It Works
Blackbox exposes debugging tools to AI models through two transport paths:
- VS Code Chat — Tools are available as
#tool_name references in Copilot Chat.
- MCP Server — A stdio-based MCP server for external AI clients (Cursor, Claude Desktop, etc.).
🛠️ MCP Server Configuration
{
  "servers": {
    "blackbox": {
      "type": "stdio",
      "command": "node",
      "args": [
        "/Users/<user>/.vscode/extensions/akash-cx.blackbox-debug-<version>/out/mcp/server.js"
      ]
    }
  }
}
- Example: if the user is on MacOS is akashaman and version of blackbox is 0.1.0 then the path will be:
{
  "servers": {
    "blackbox": {
      "type": "stdio",
      "command": "node",
      "args": [
        "/Users/akashaman/.vscode/extensions/akash-cx.blackbox-debug-0.1.0/out/mcp/server.js"
      ]
    }
  }
}
📋 Requirements
- VS Code 1.99.0 or later.
- A debug adapter extension for your language (e.g., PHP Debug, Node.js Debugger).
📝 License
This project is MIT licensed.