CANdb StudioIntroductionCANdb Studio is a Visual Studio Code extension for working with
What this project isThe repository builds the
The extension parses and serializes DBC text through a domain model (nodes, messages, a global signal pool, value tables, and attributes) so edits stay consistent with typical CANdb-style workflows. Why This ExistsModern tooling should meet automotive and embedded engineers where they already work. Visual Studio Code is widely used across teams, so this project brings DBC-first editing and exploration into that environment instead of treating If you work with CAN and DBC, the goal is simple: open a Prerequisites
InstallationMarketplace or
|
| Command | Purpose |
|---|---|
| Open CAN Database | Pick a .dbc from disk and load it into the extension |
| Open CAN Signal Lab / Close CAN Signal Lab… | Open or close the Signal Lab panel |
| Connect to CAN Bus / Disconnect from CAN Bus | Adapter-dependent connection |
| Start CAN Monitor / Stop CAN Monitor | Frame logging while connected |
| Transmit CAN Message | Send a frame using the loaded database (when supported) |
Exact behavior for bus commands depends on your adapter and drivers.
Developing the extension
| Command | Description |
|---|---|
npm run compile |
Build webview-ui (Vite) and bundle the extension (webpack). |
npm run watch |
Webpack watch; rebuild the webview when webview-ui/ changes. |
npm run lint |
ESLint on src/. |
npm test |
Compile tests, full compile, lint, then vscode-test. |
Features
DBC language
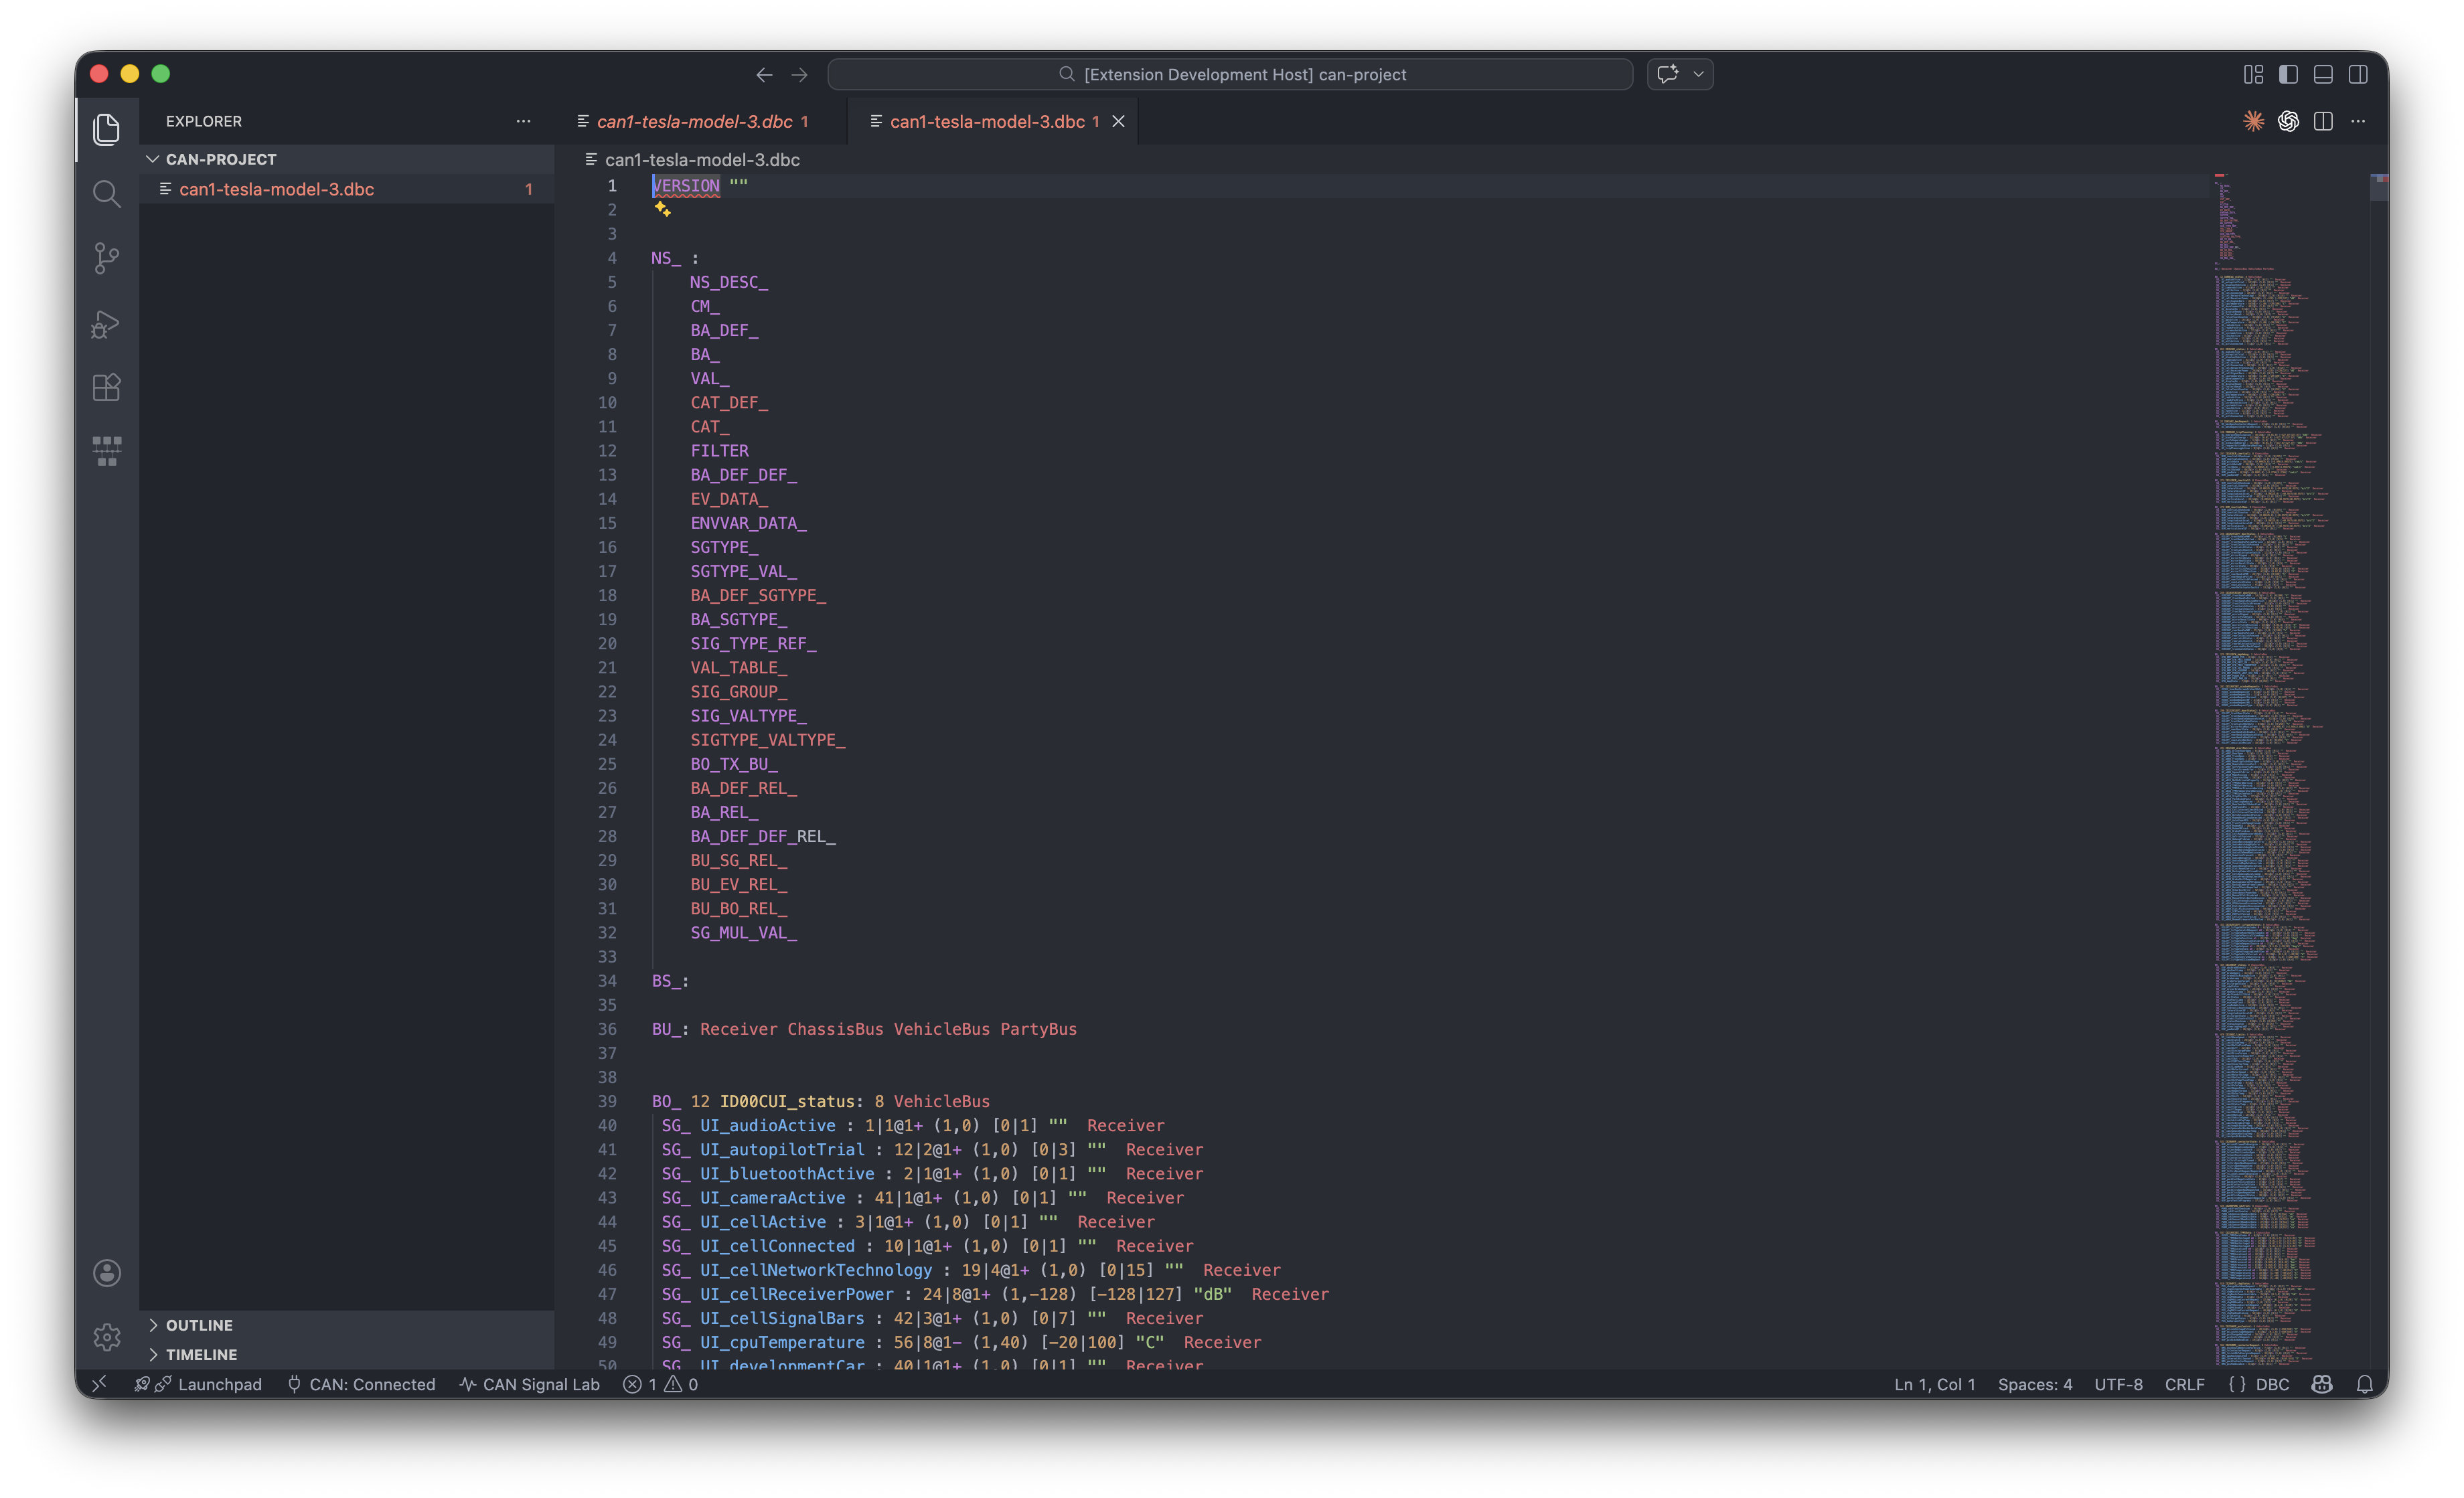
The extension registers the dbc language for *.dbc files and ships a TextMate grammar (syntaxes/dbc.tmLanguage.json) so keywords, comments, strings, and common DBC constructs get basic syntax coloring in the text editor.
- Activation: Opening or focusing a
.dbcfile loads the language support. - Custom editor: For the full structured experience, use CAN Database Editor (see below); use Text view from that editor if you prefer the raw file in the default editor.
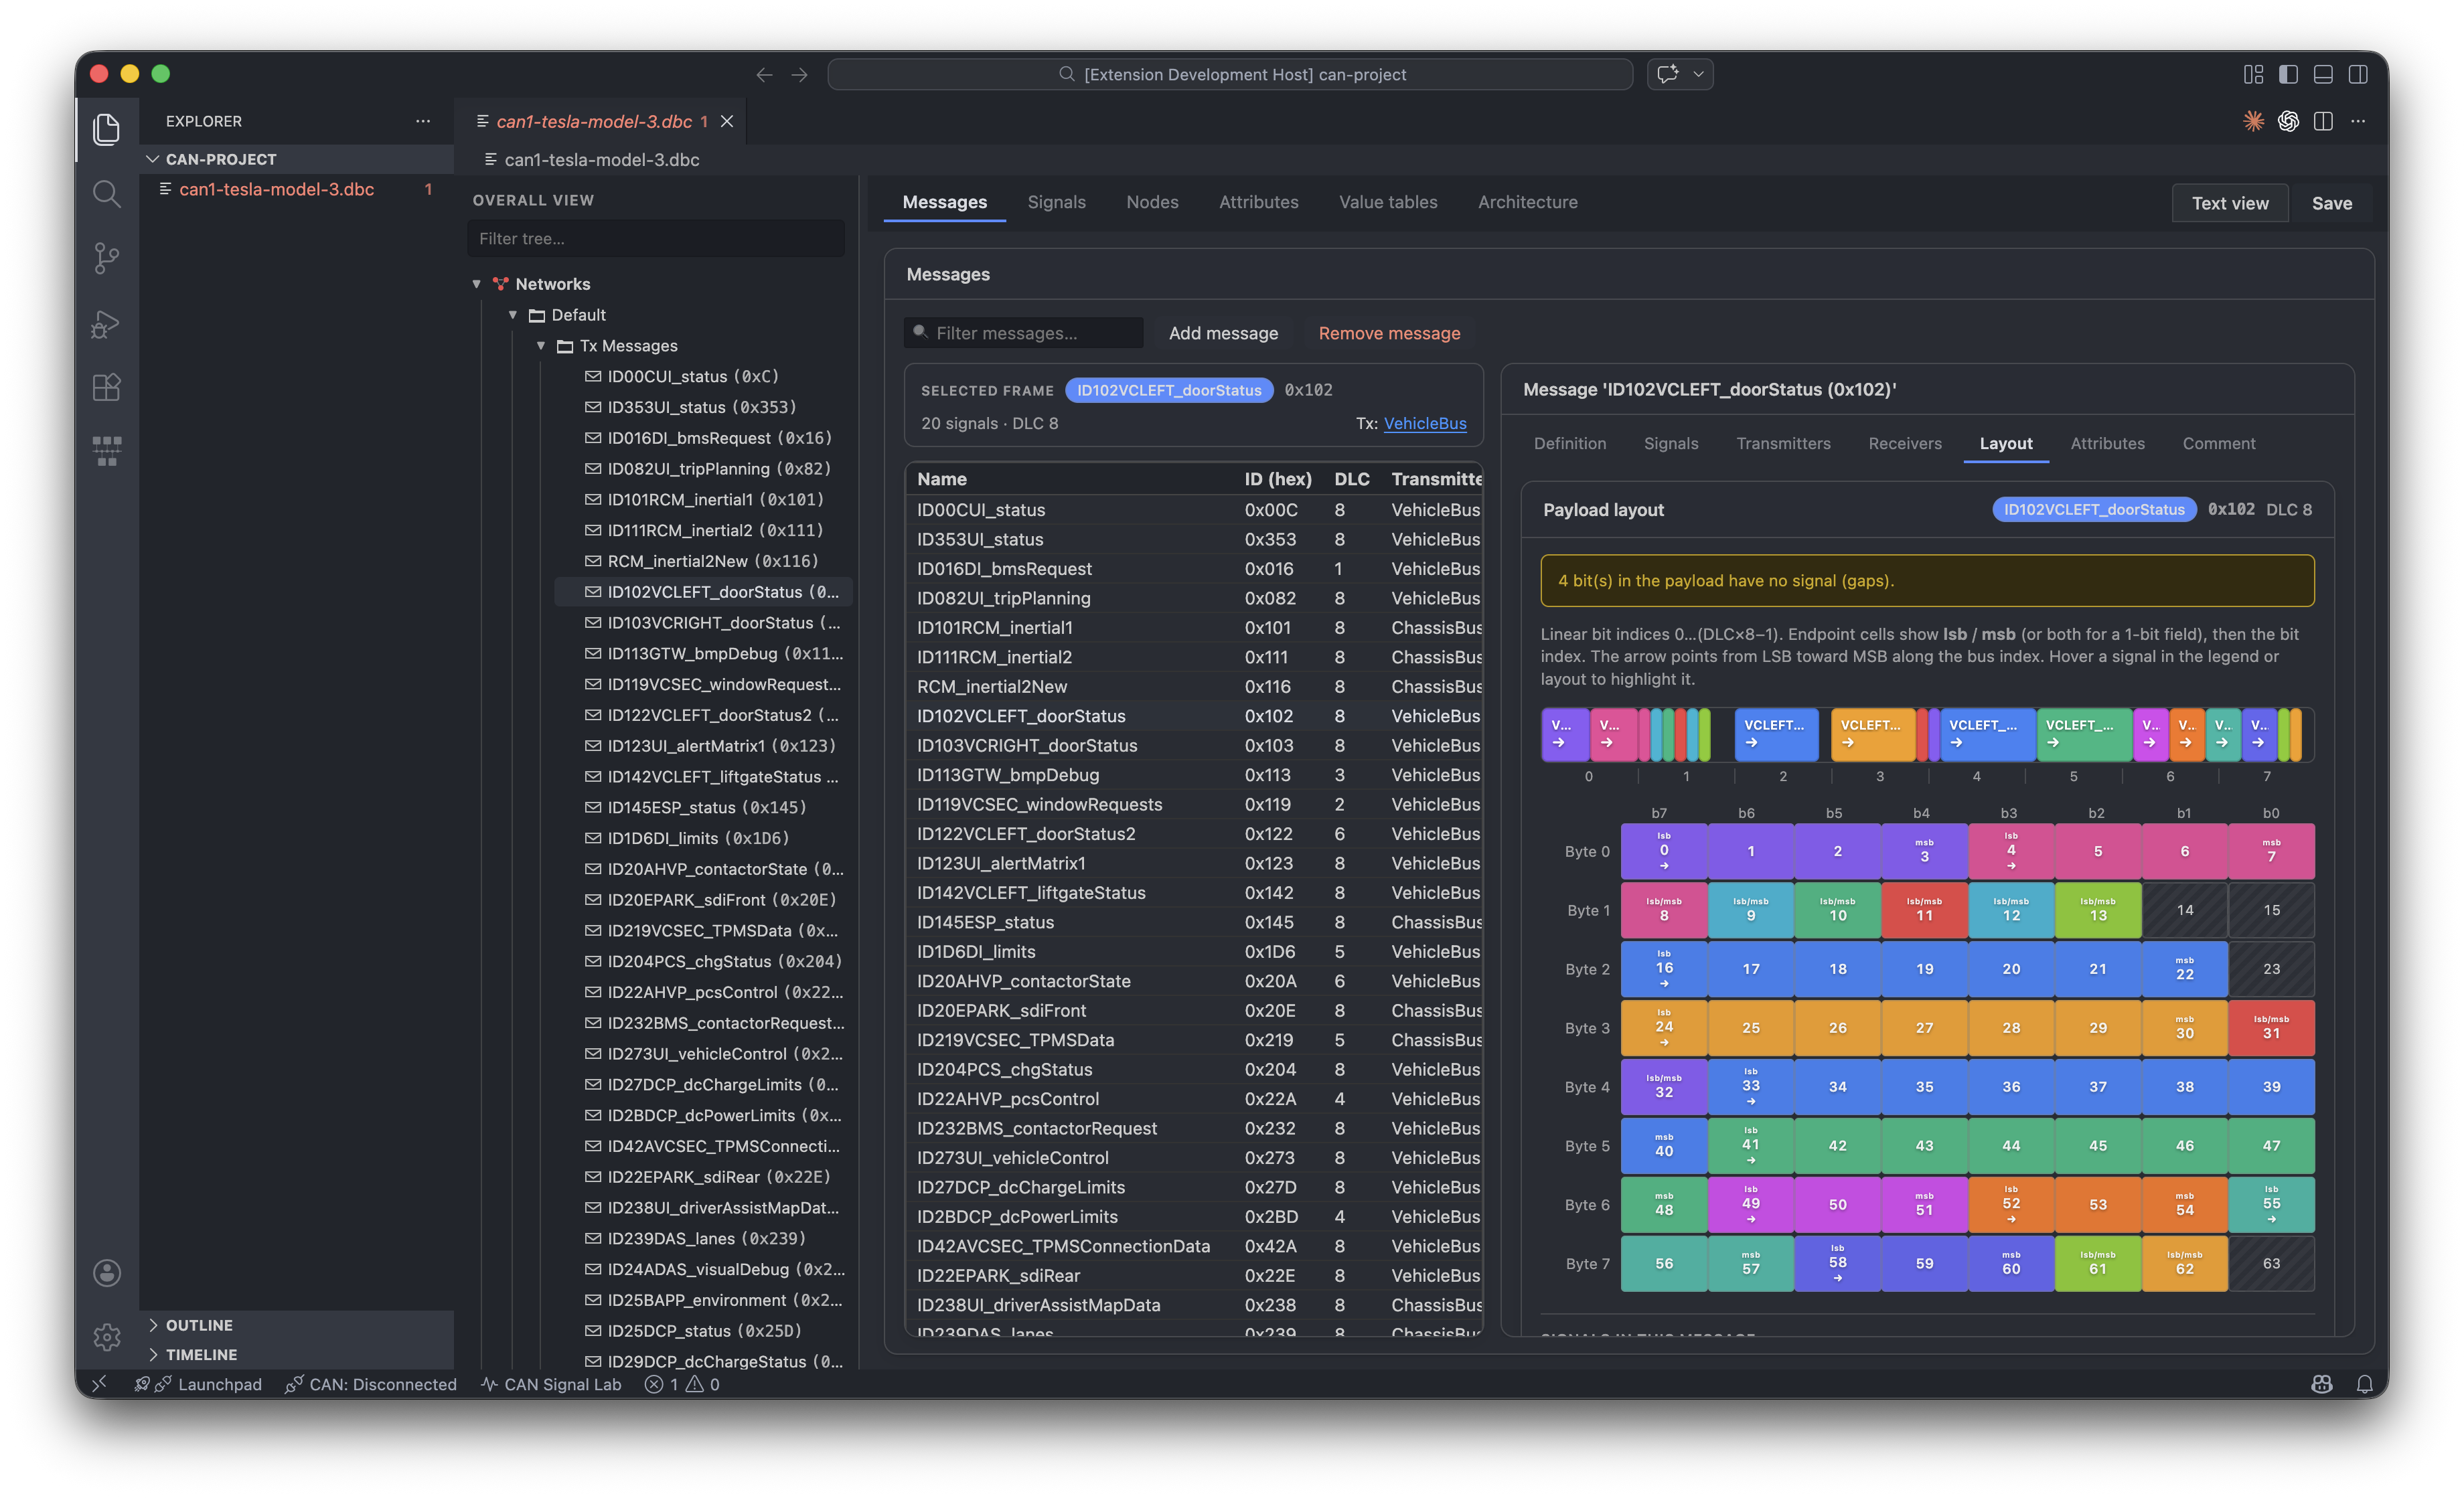
CAN Database Visual Editor
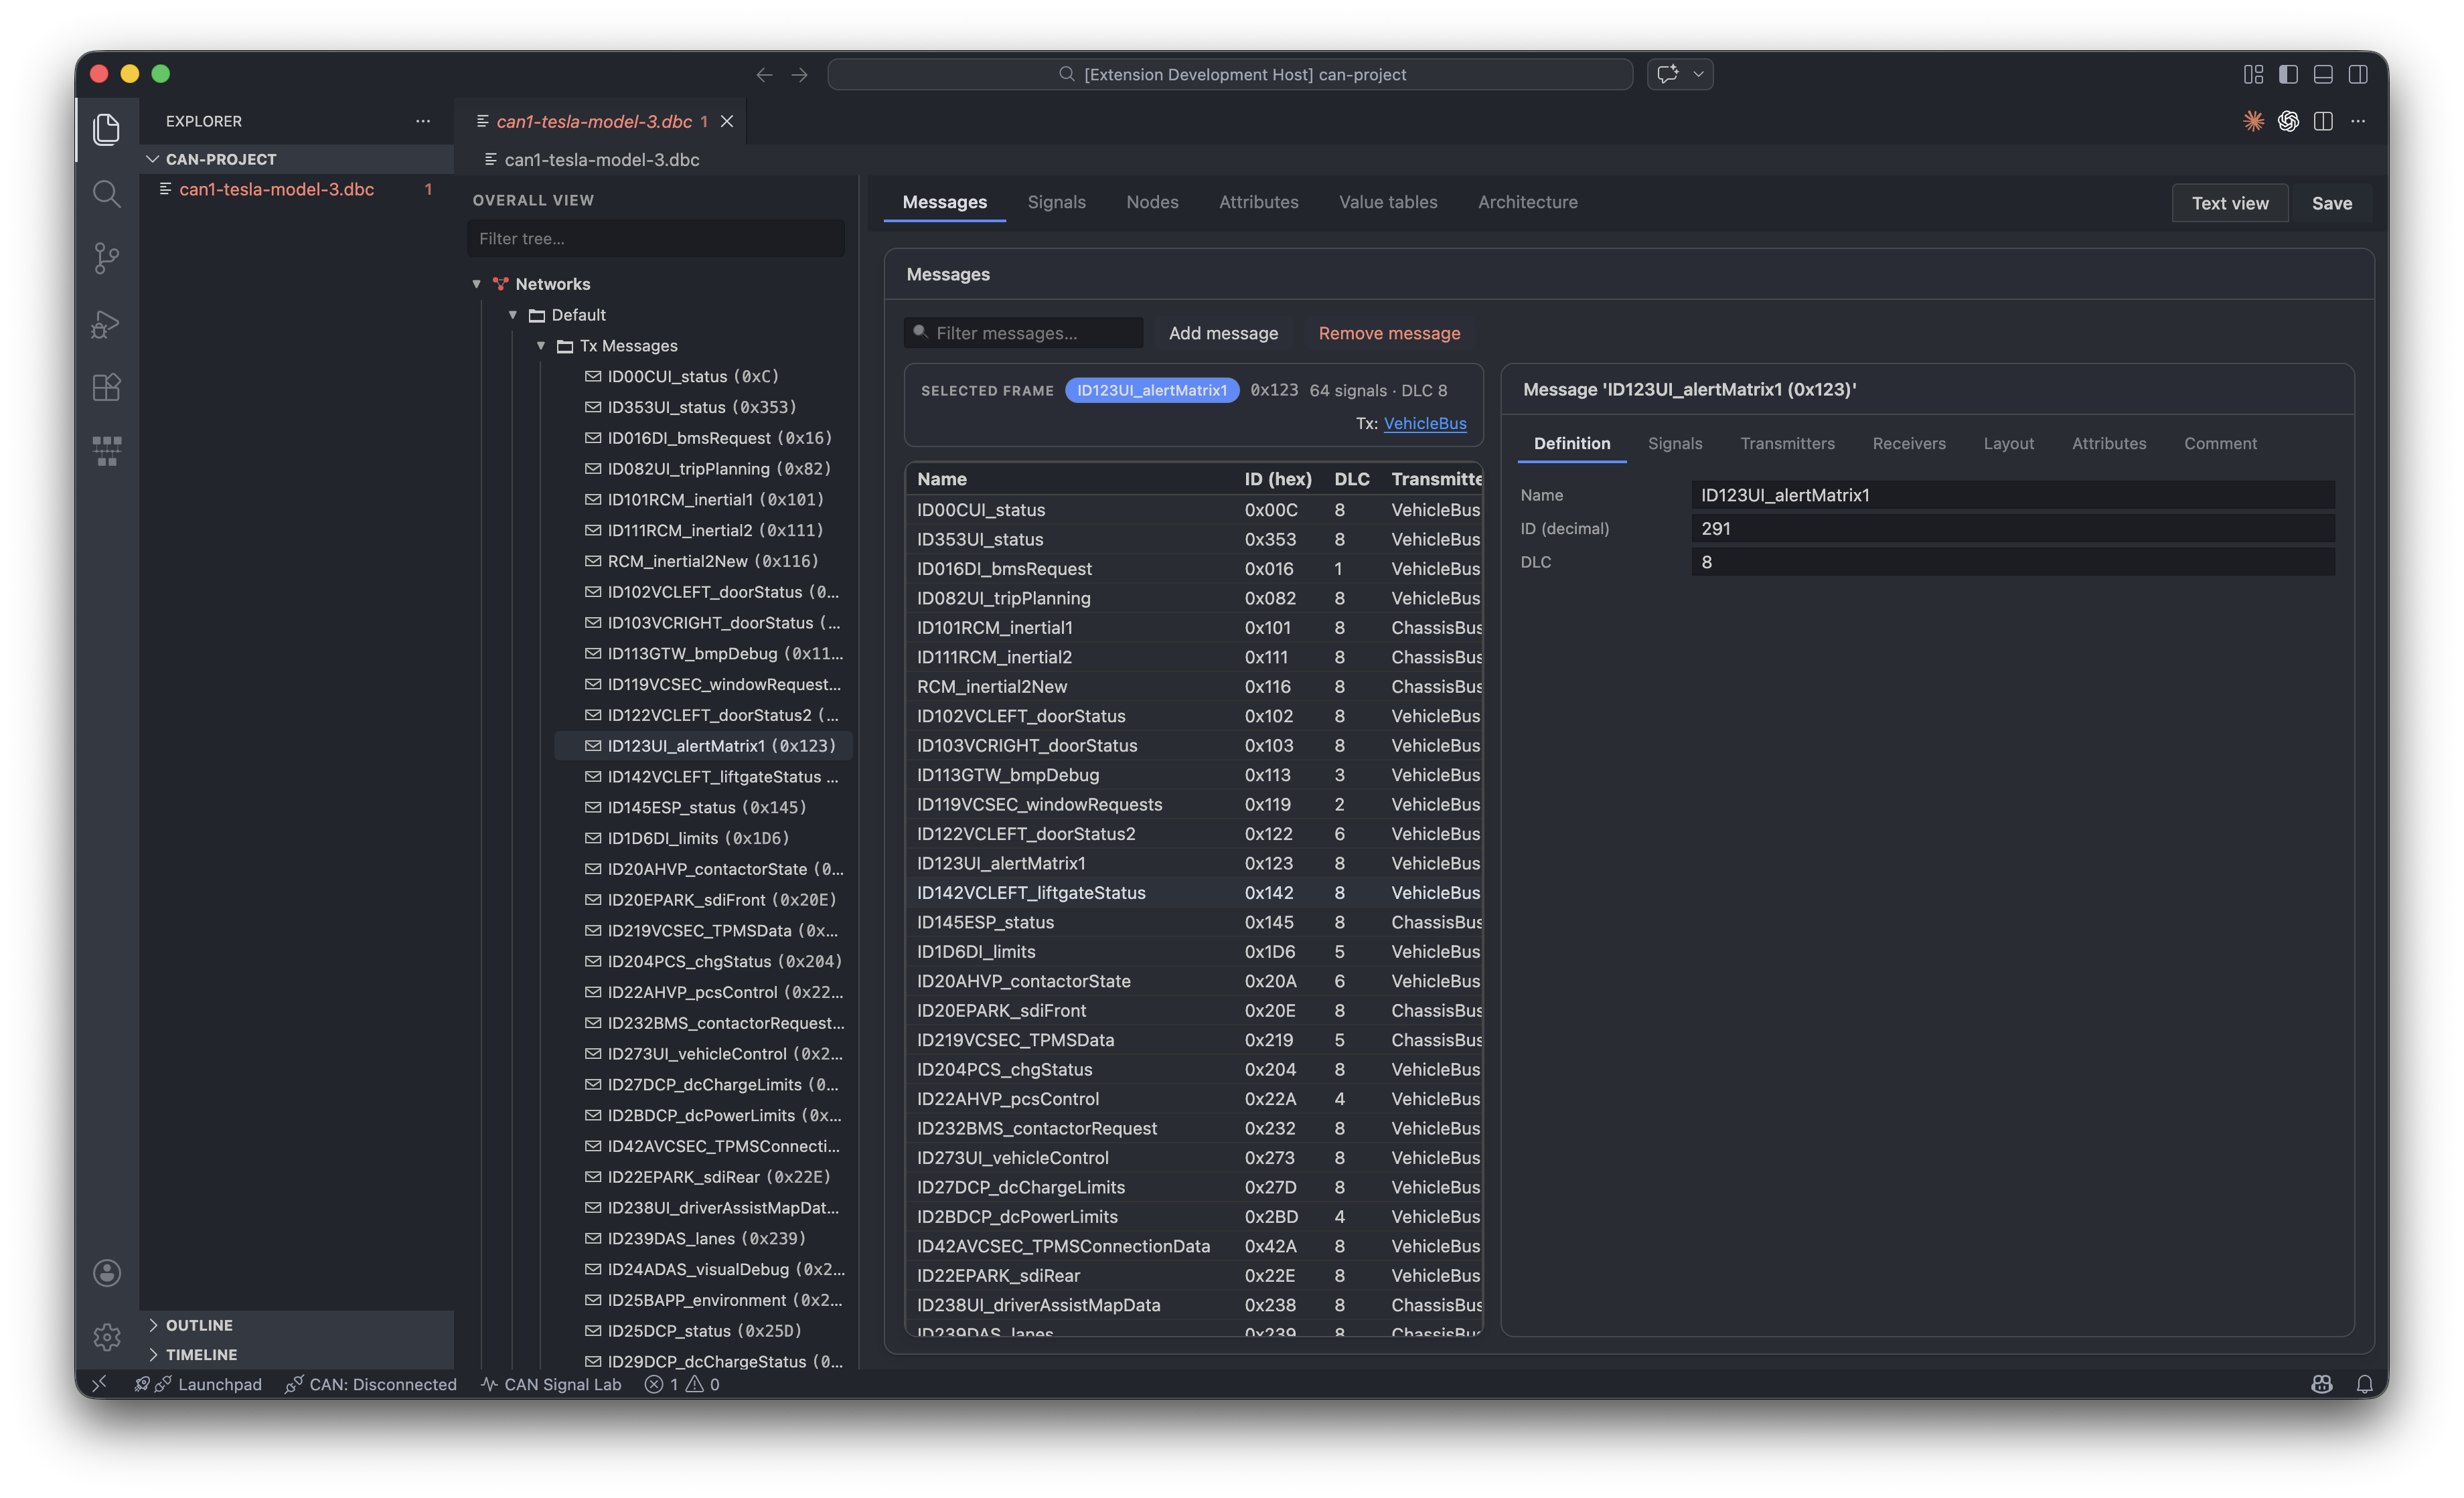
Opening a .dbc with CAN Database Editor loads the Svelte-based UI. It stays in sync with the file on disk: edits go through the same parse → domain model → serialize path as save operations.
Layout
- Left: Resizable database explorer (version, messages, signals, nodes, attributes, environment variables). Selecting an item jumps to the matching Messages, Signals, Nodes, or Attributes tab when relevant.
- Top tabs:
- Messages — Frames, DLC, transmitters, linked signals, bit layout navigation.
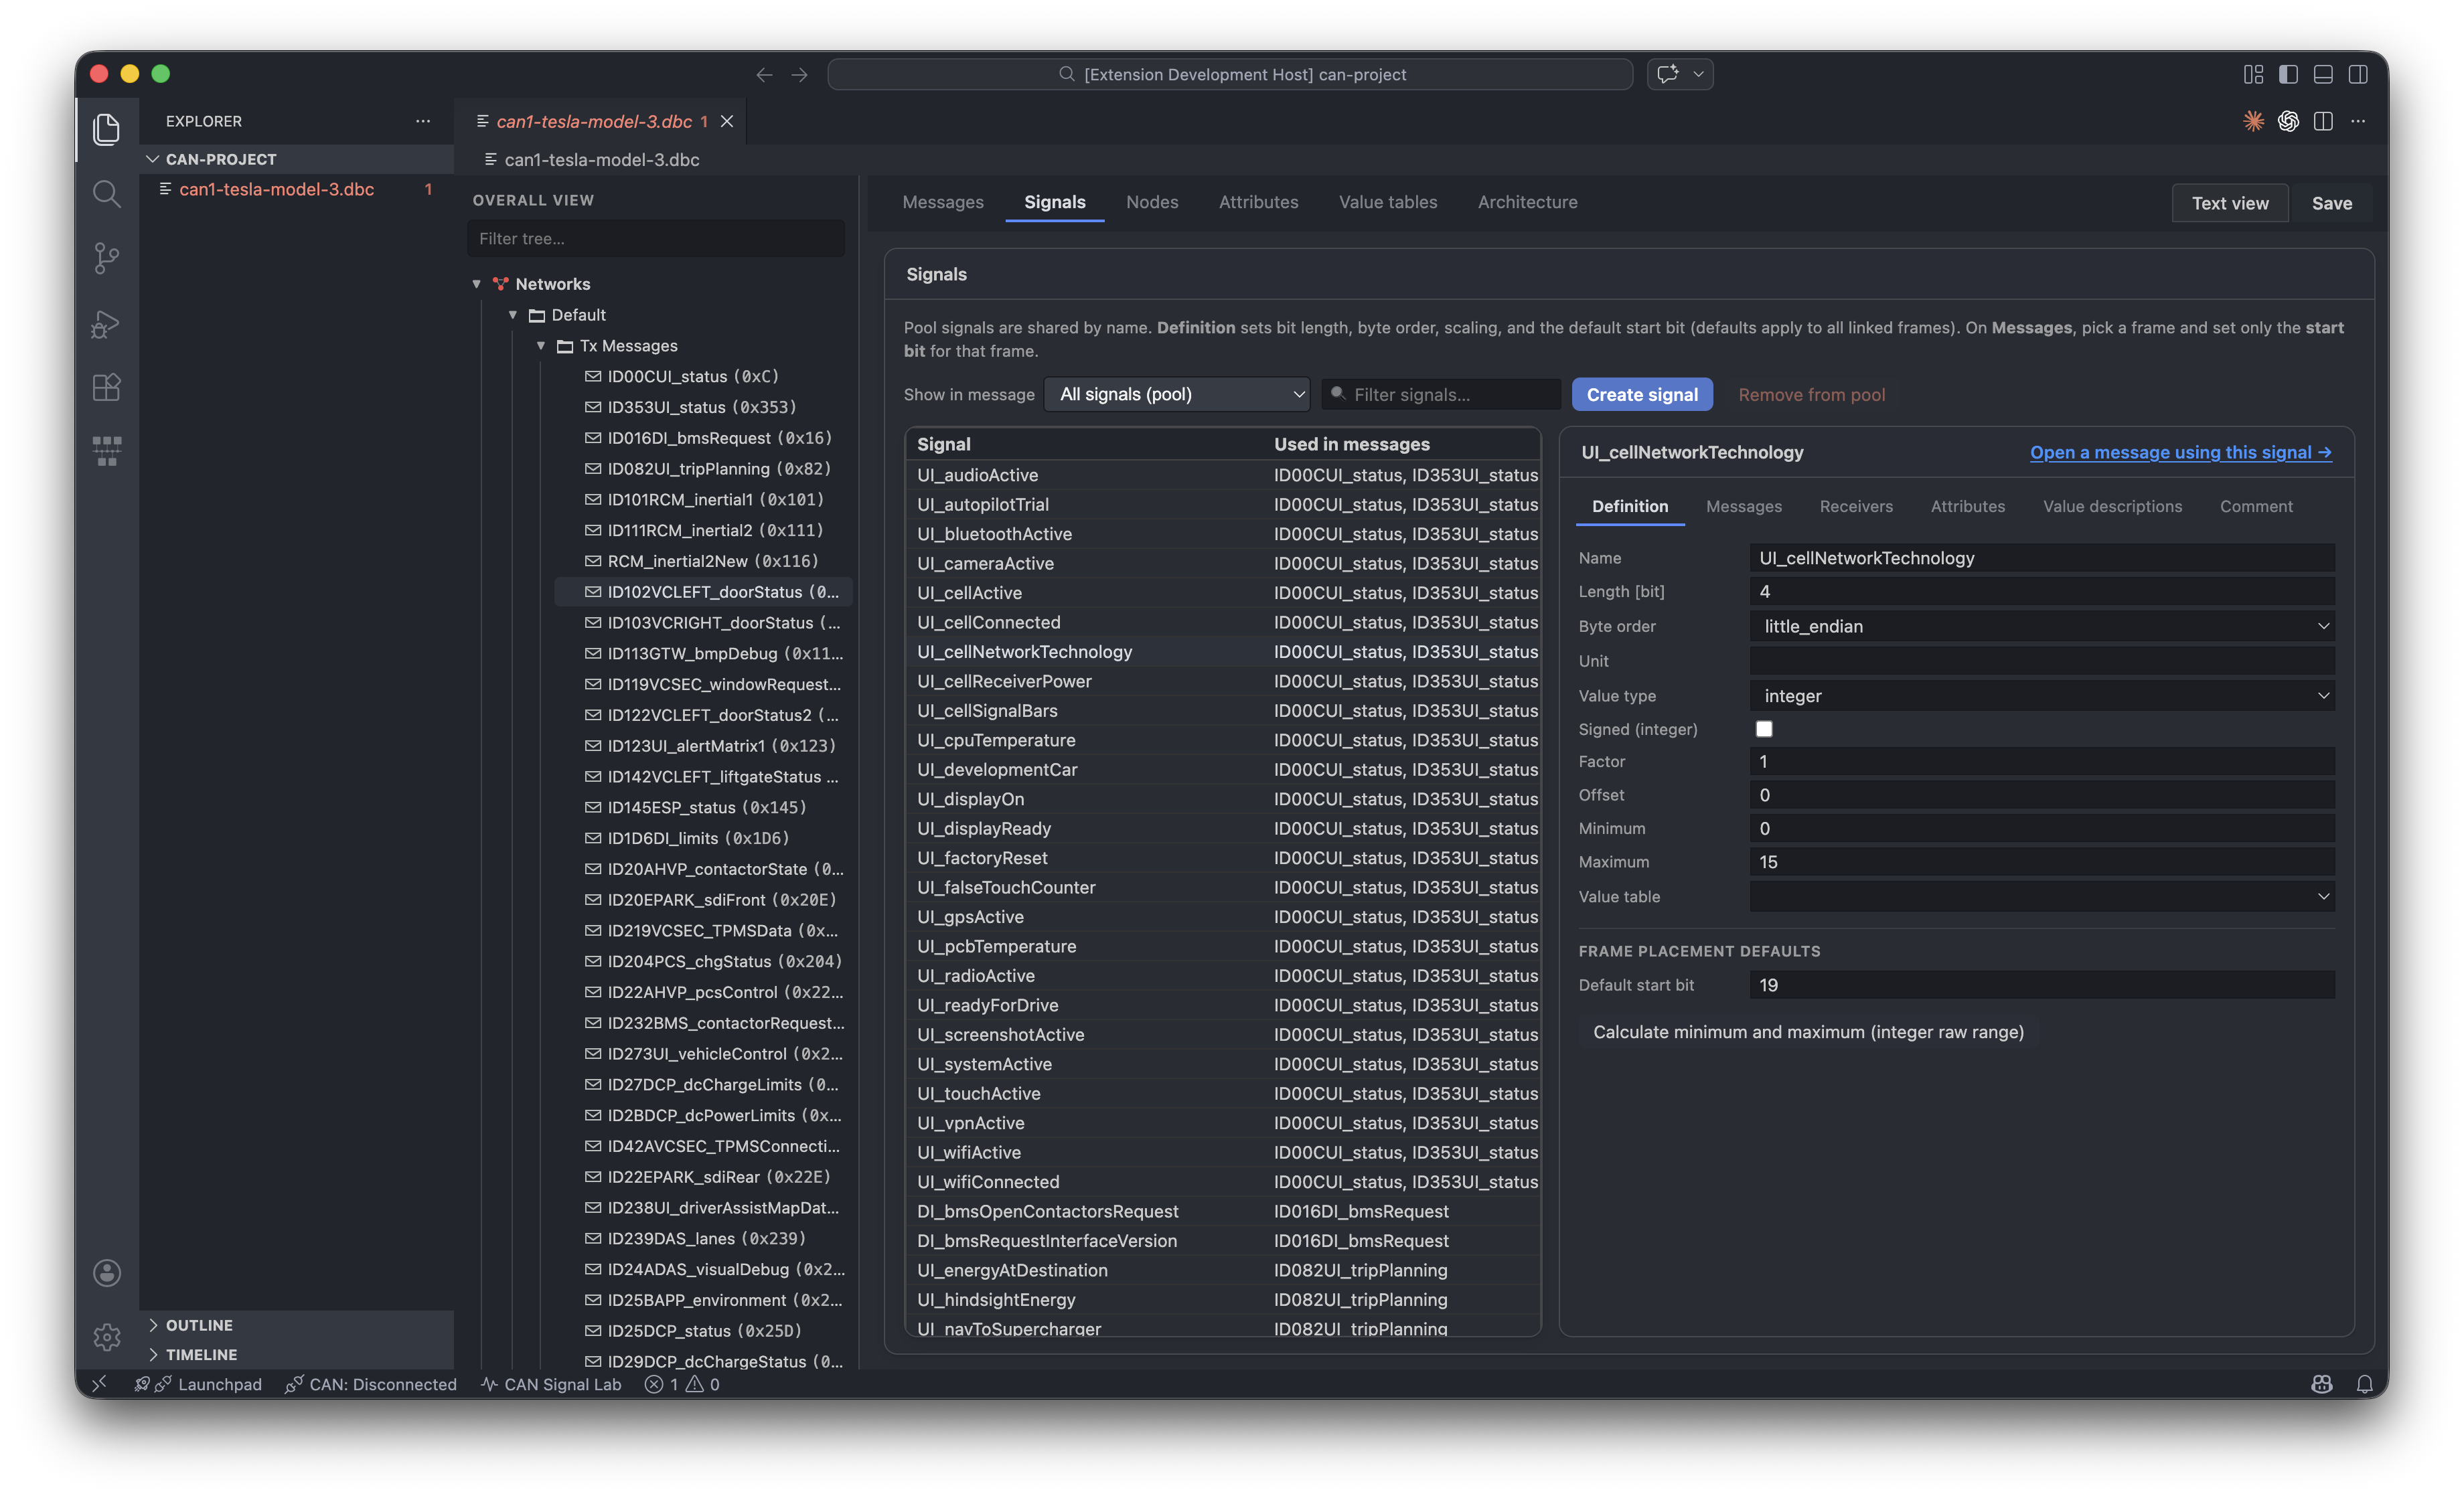
- Signals — Global signal pool, units, scaling, value tables, links to messages.
- Nodes — ECU / node list and metadata.
- Attributes — Attribute definitions and values where exposed in the UI.
- Value tables —
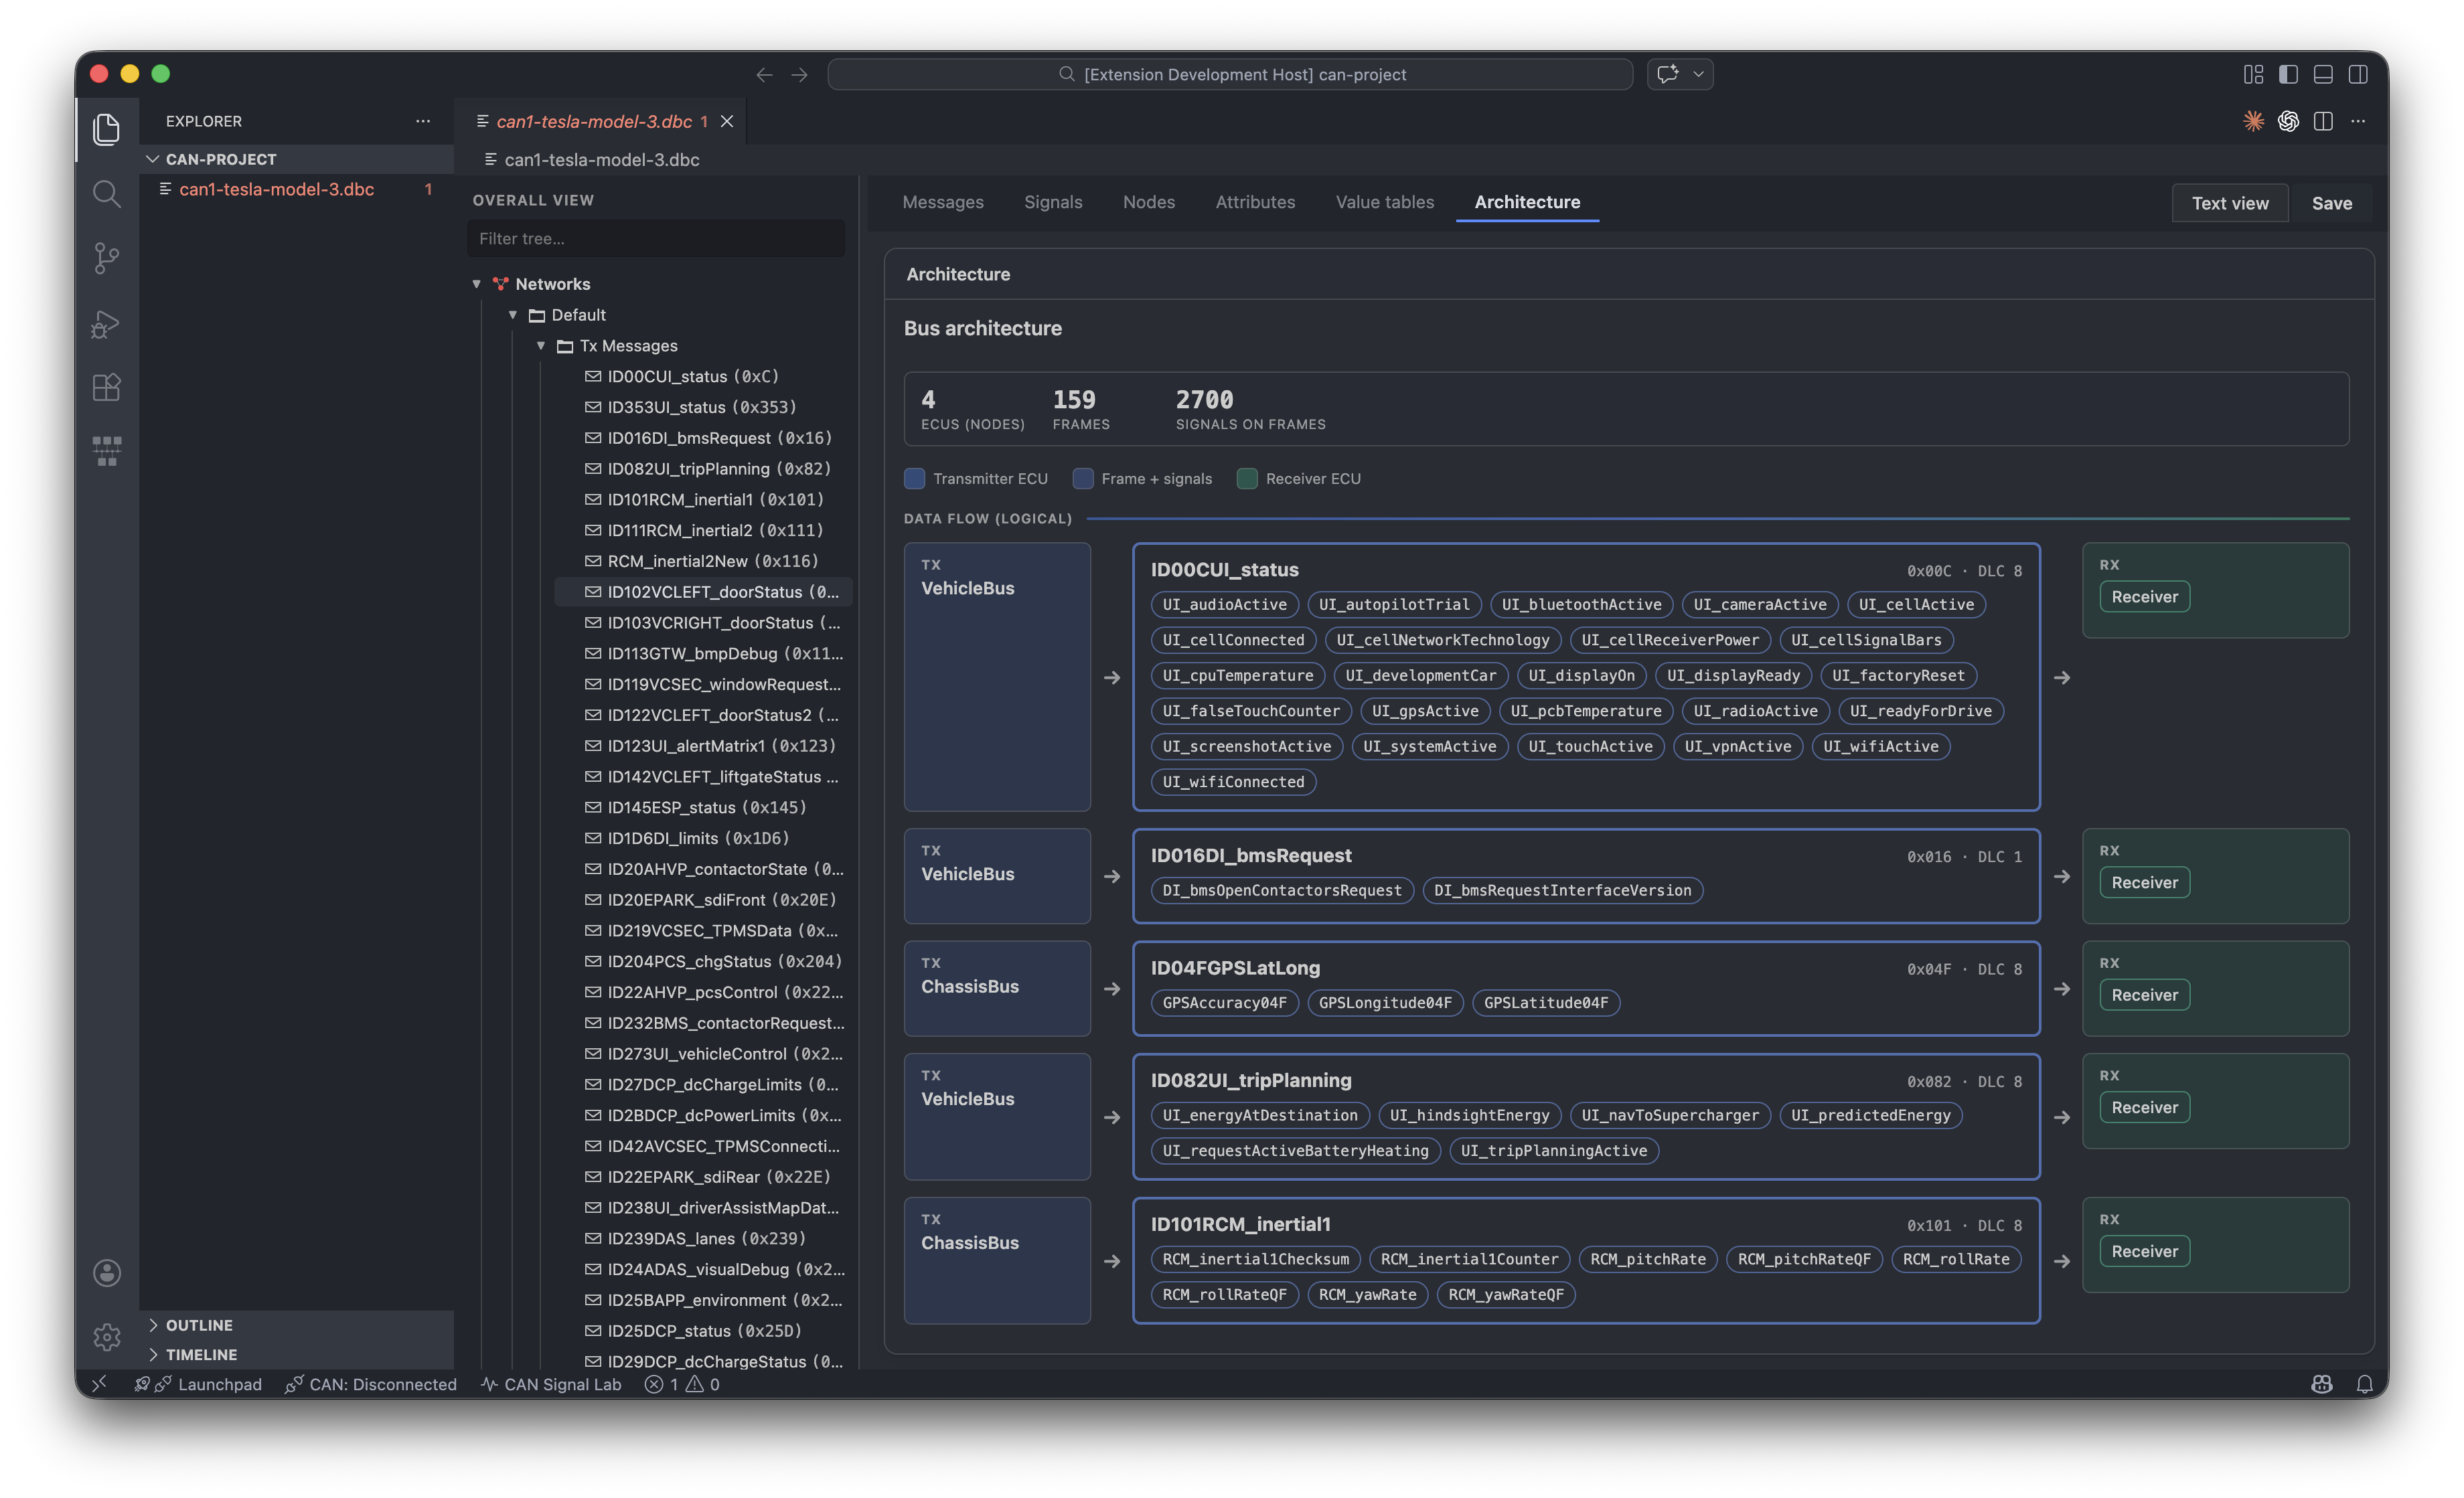
VAL_TABLE_/ enumerated value editing. - Architecture — High-level overview (version, nodes, frames) and navigation into detail tabs.
- Text view — Opens the same file in the default text editor for hand-editing raw DBC.
- Save — Writes the serialized database back to the
.dbcfile.
CAN Database Explorer
In the activity bar, open CANdb Studio → CAN Database. This tree view shows the active database for bus decode — the same session you pick in CAN Signal Lab. If you unlink decode there, the sidebar tree empties until you select another loaded .dbc. Top level: nodes, messages (expand a message for per-frame layout), signals (full global pool, A–Z), then unlinked signals (pool entries not on any frame).
Use it when you want a compact sidebar overview without opening the full custom editor, or alongside other editors.
CAN Signal Lab
Signal Lab combines monitoring, transmit, and charts in one place.
- Open: Command CANdb Studio: Open CAN Signal Lab, status bar shortcuts where provided, or the full editor-area CAN Signal Lab panel.
- Panels:
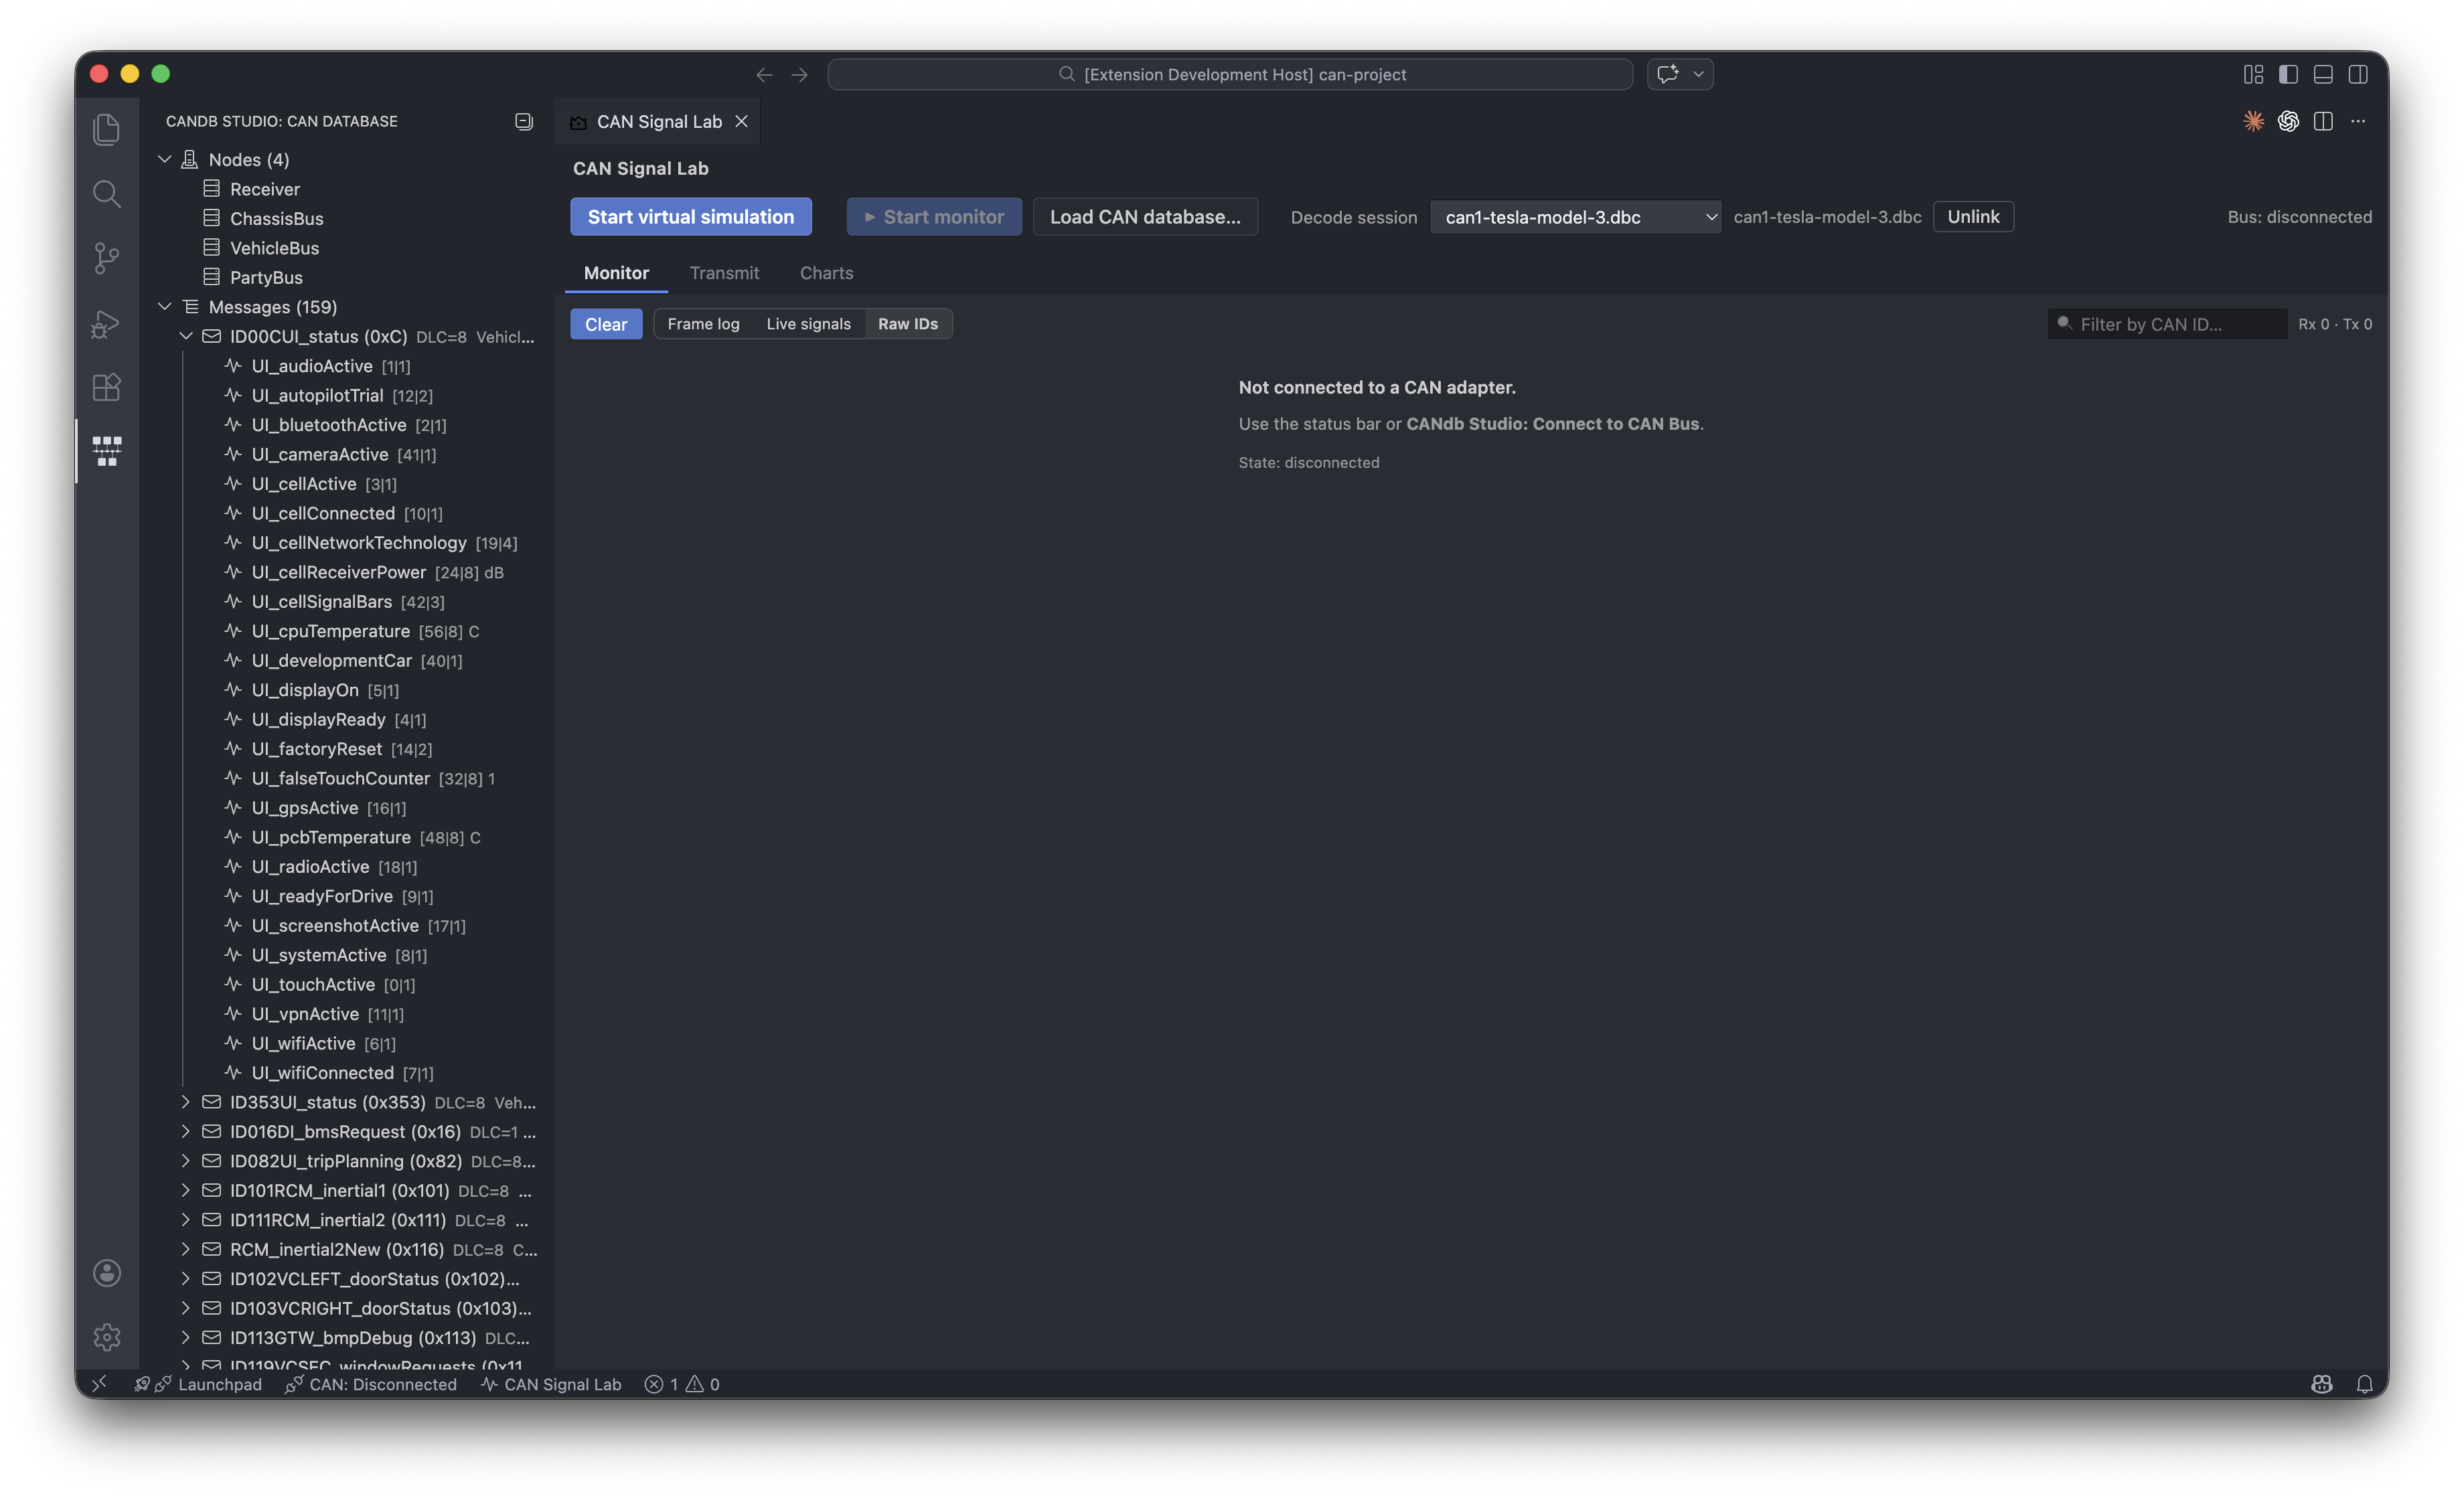
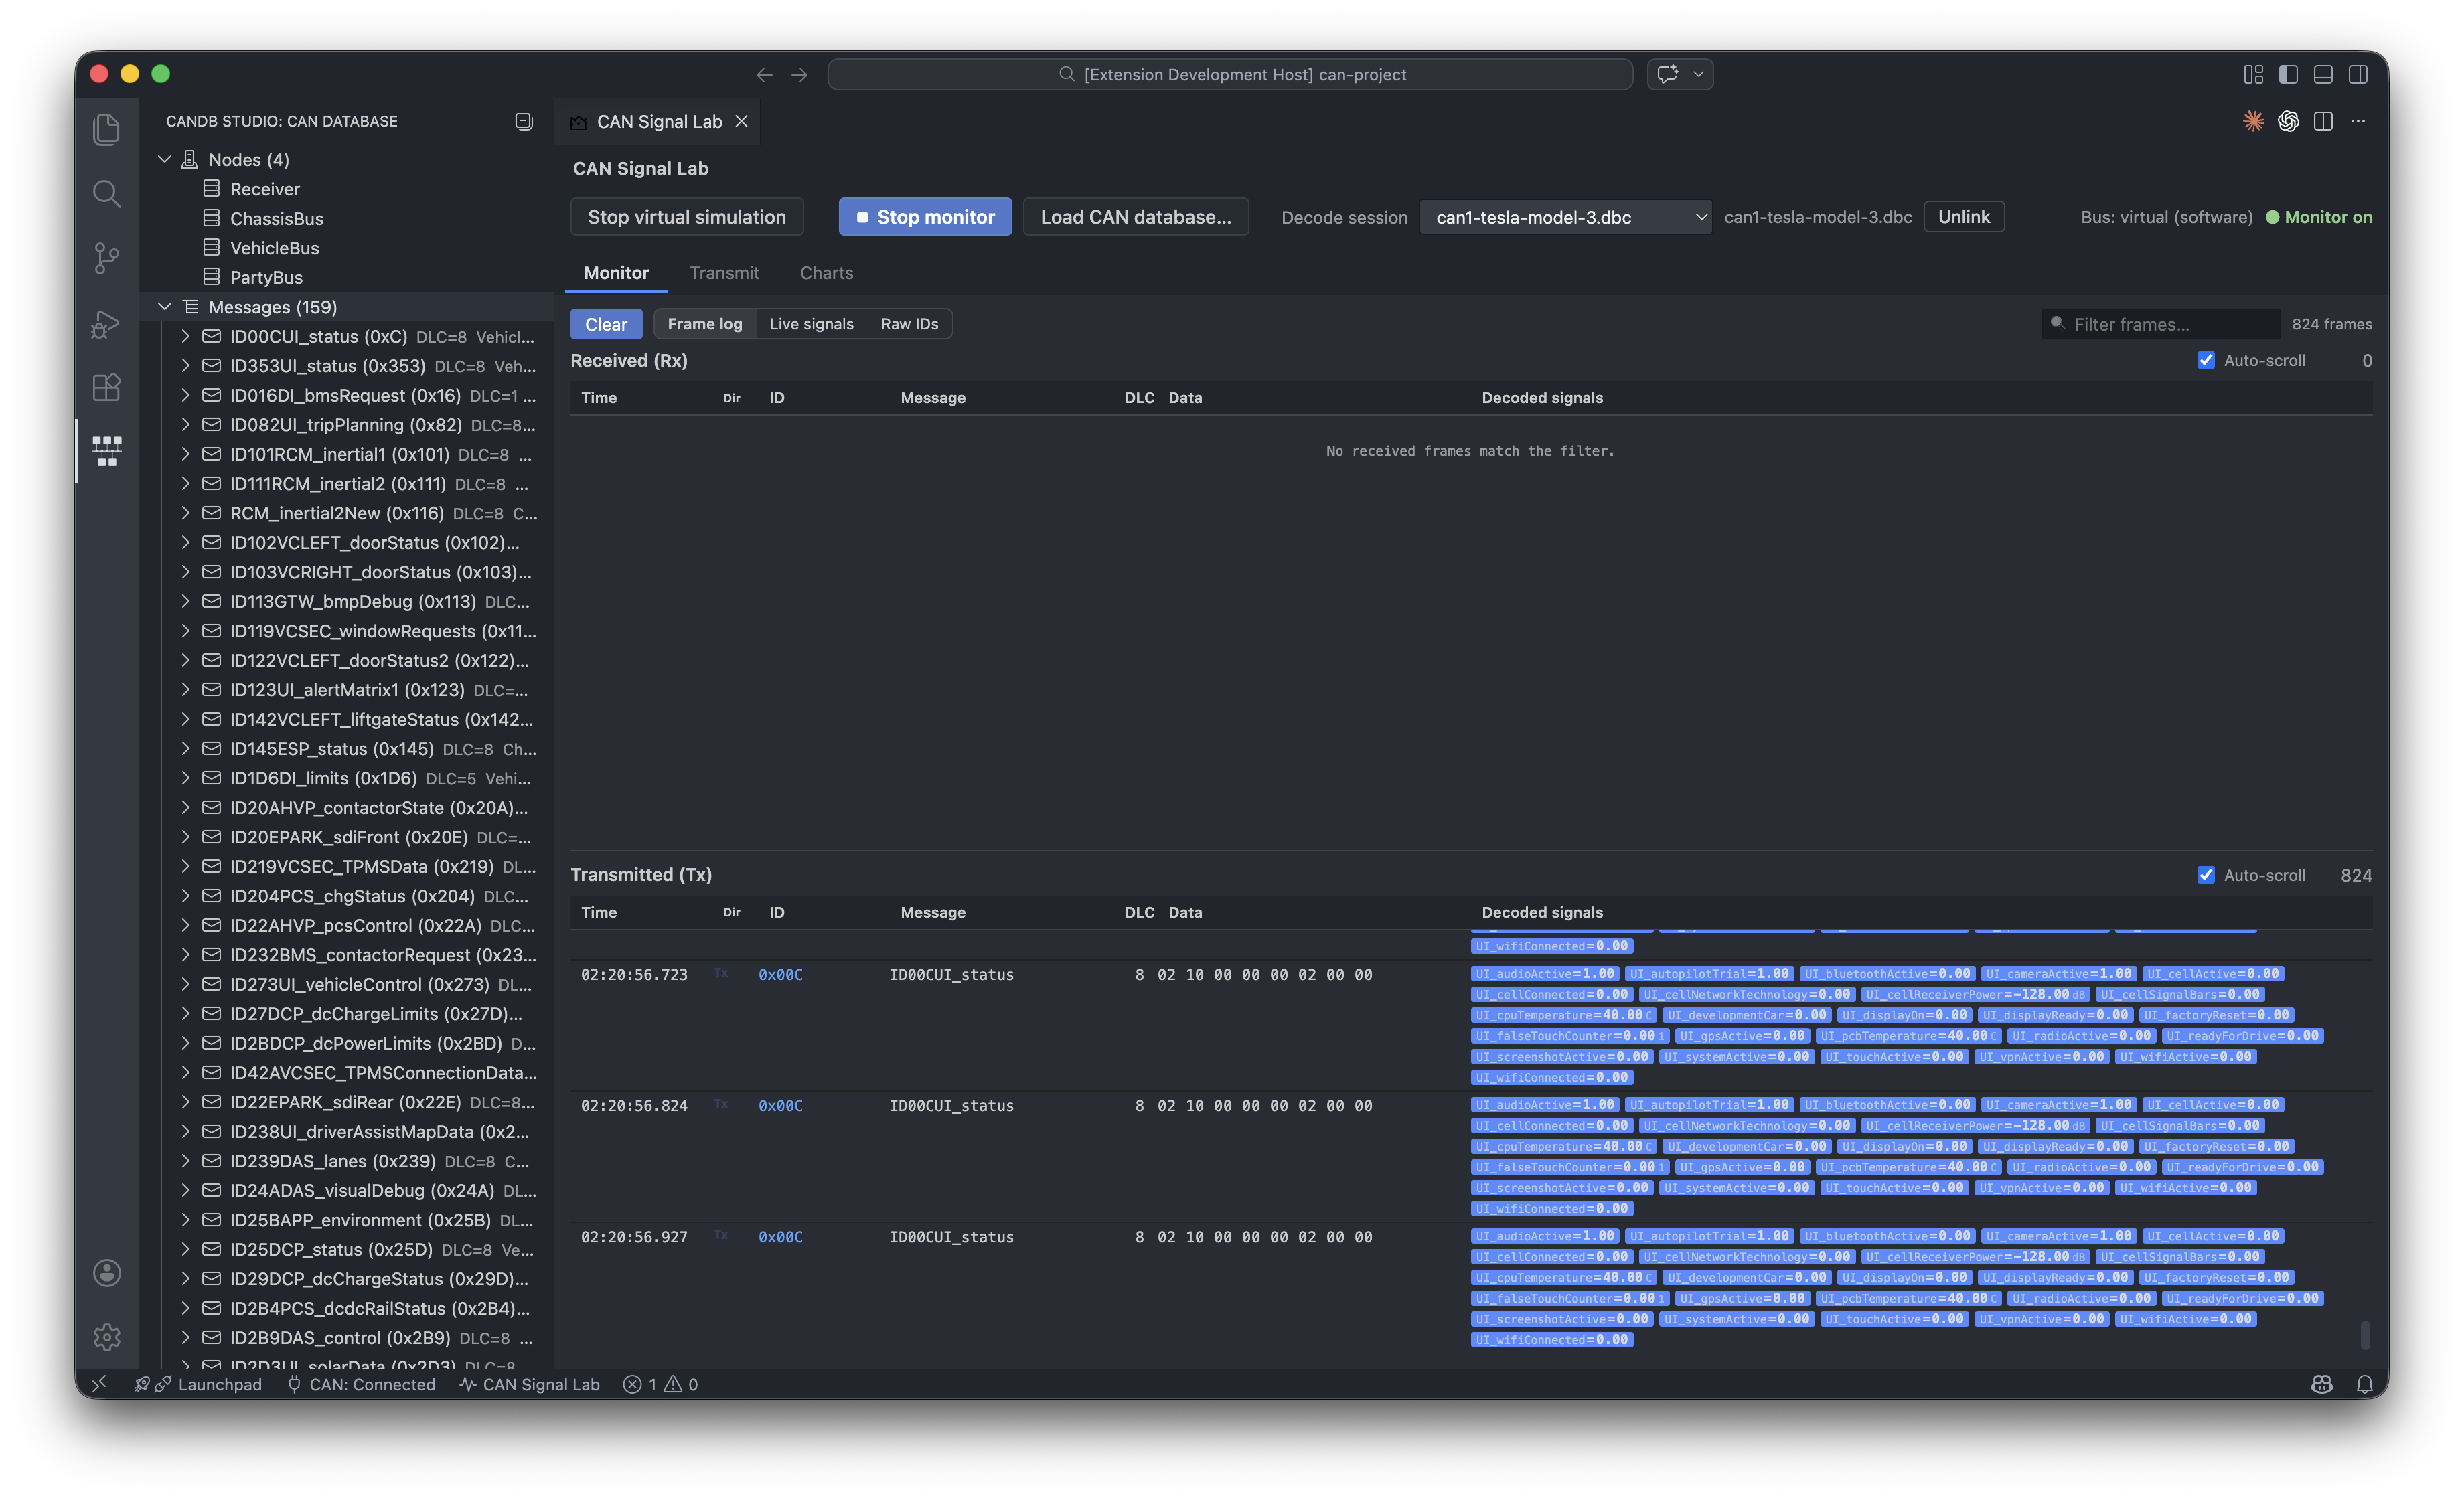
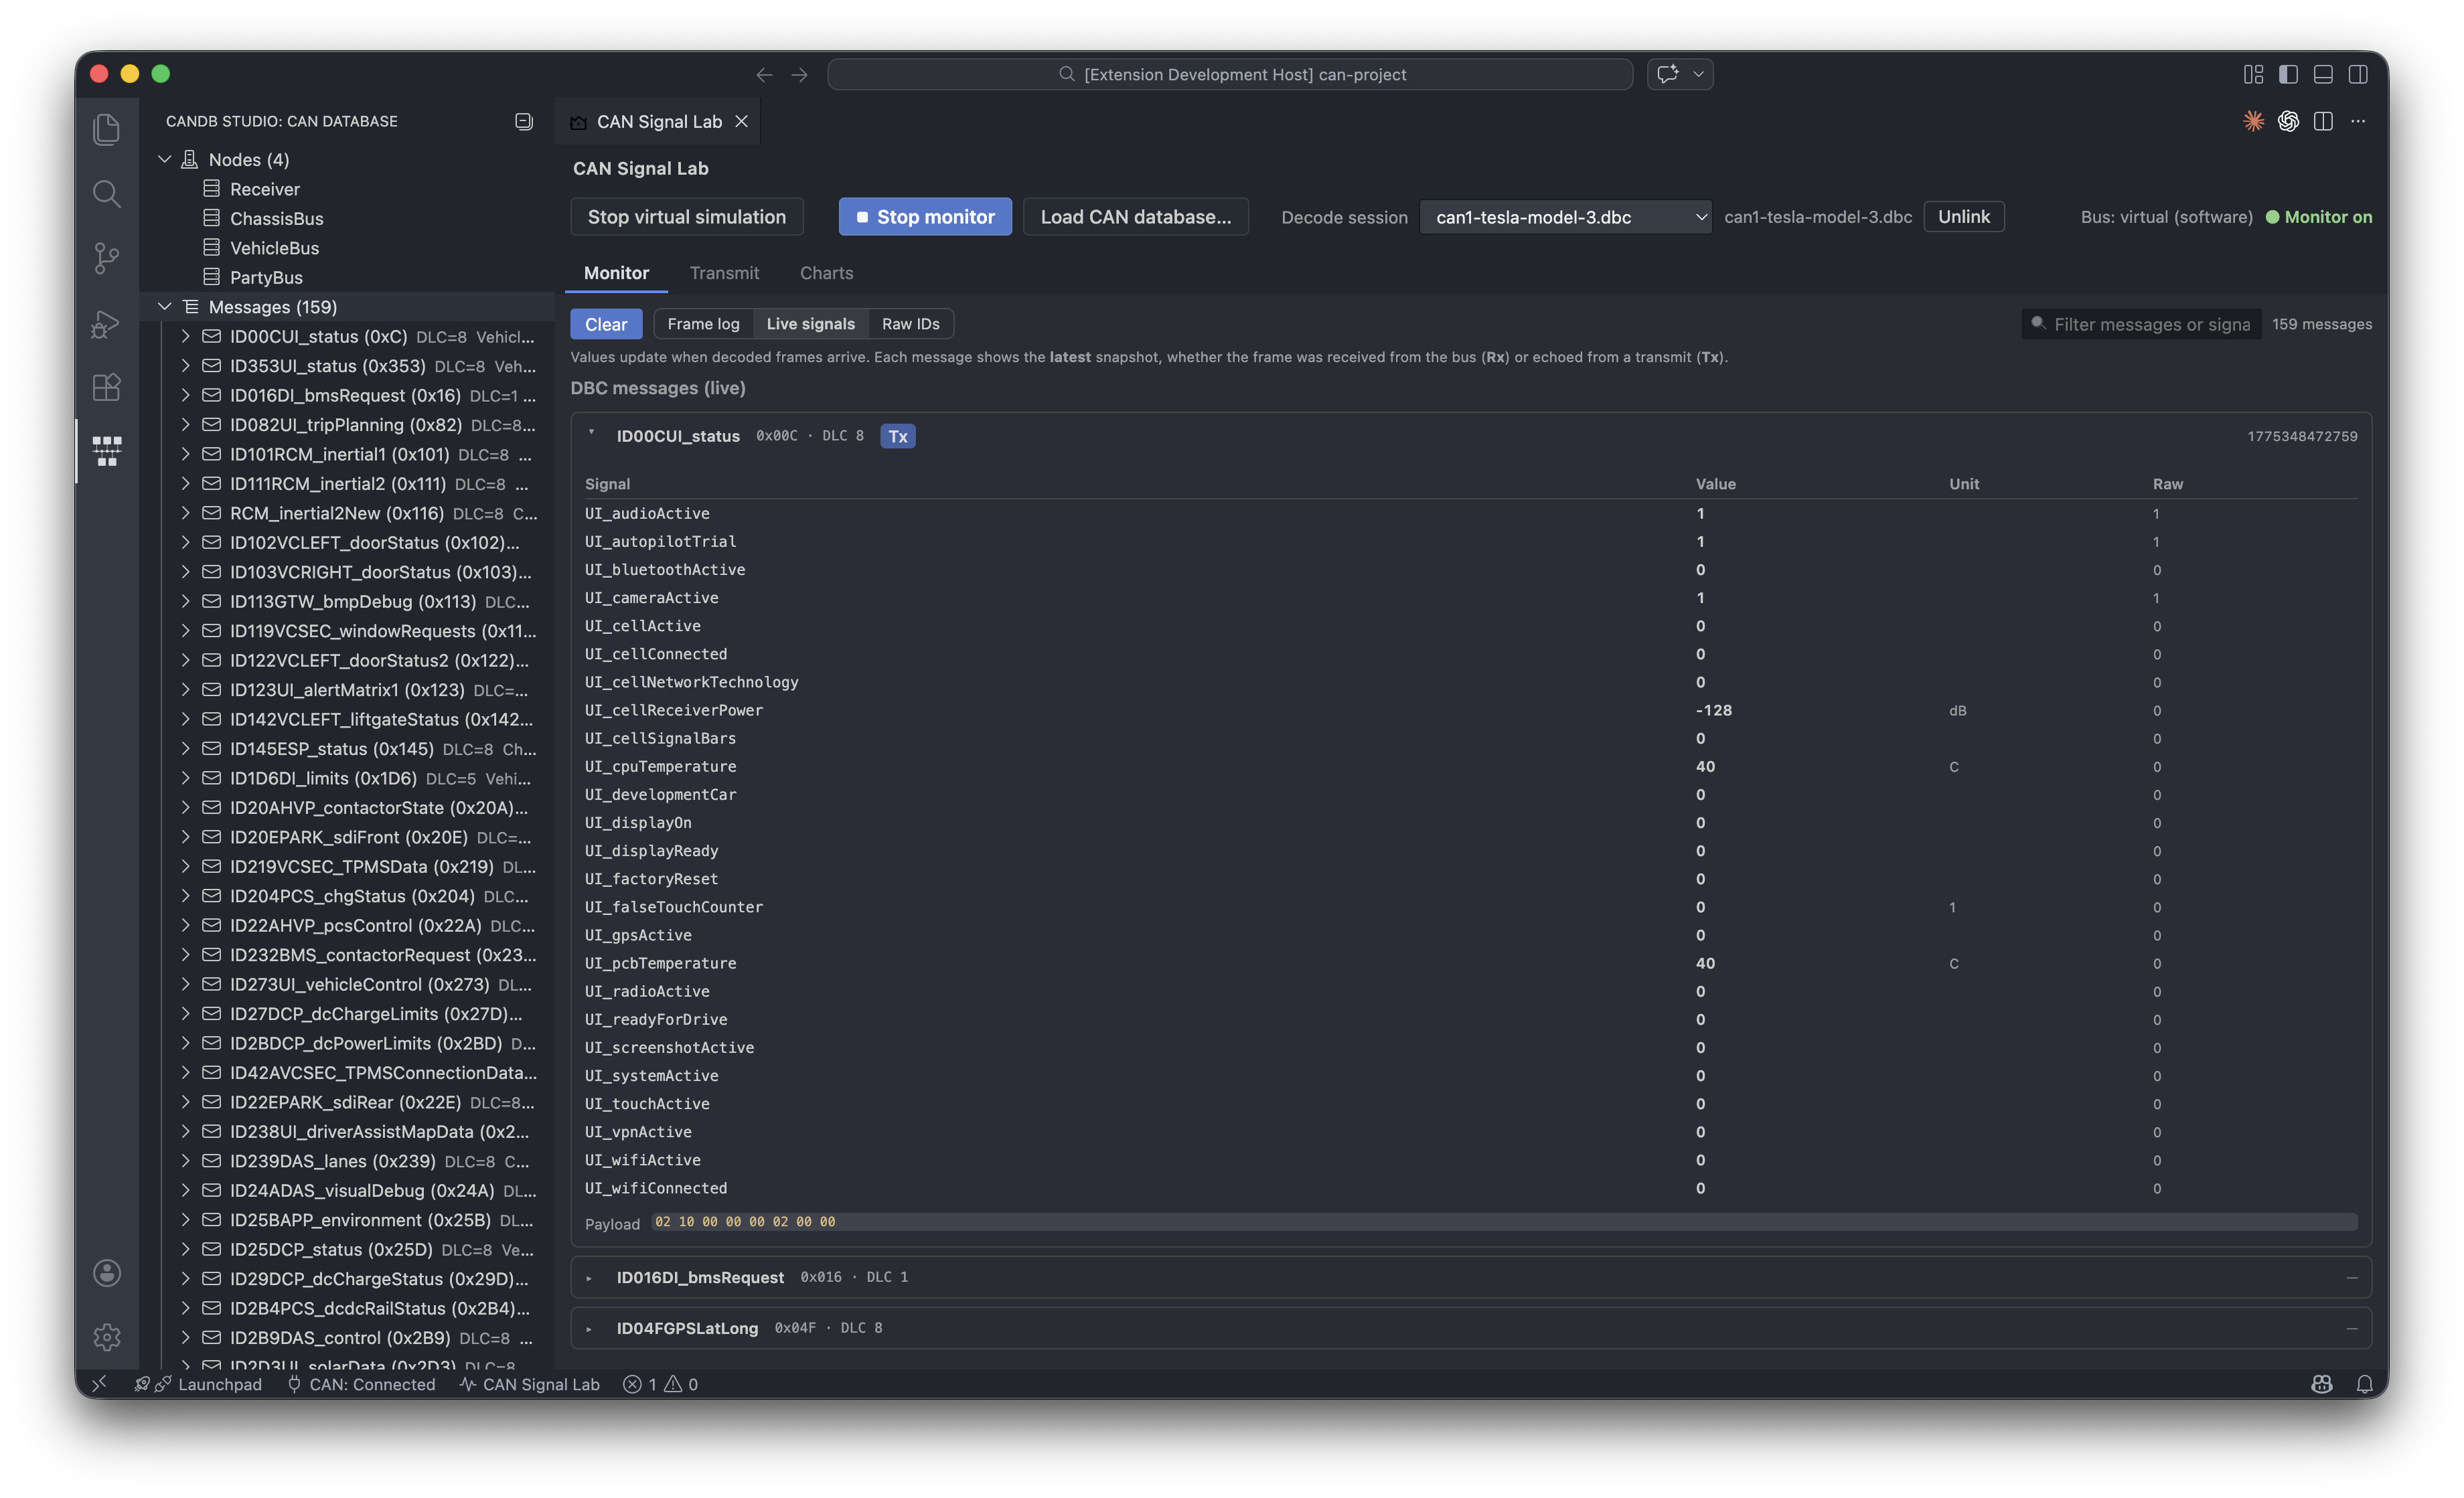
- Monitor — Live frame list when a bus connection and monitor are active; decoding uses the loaded database when a session is attached.
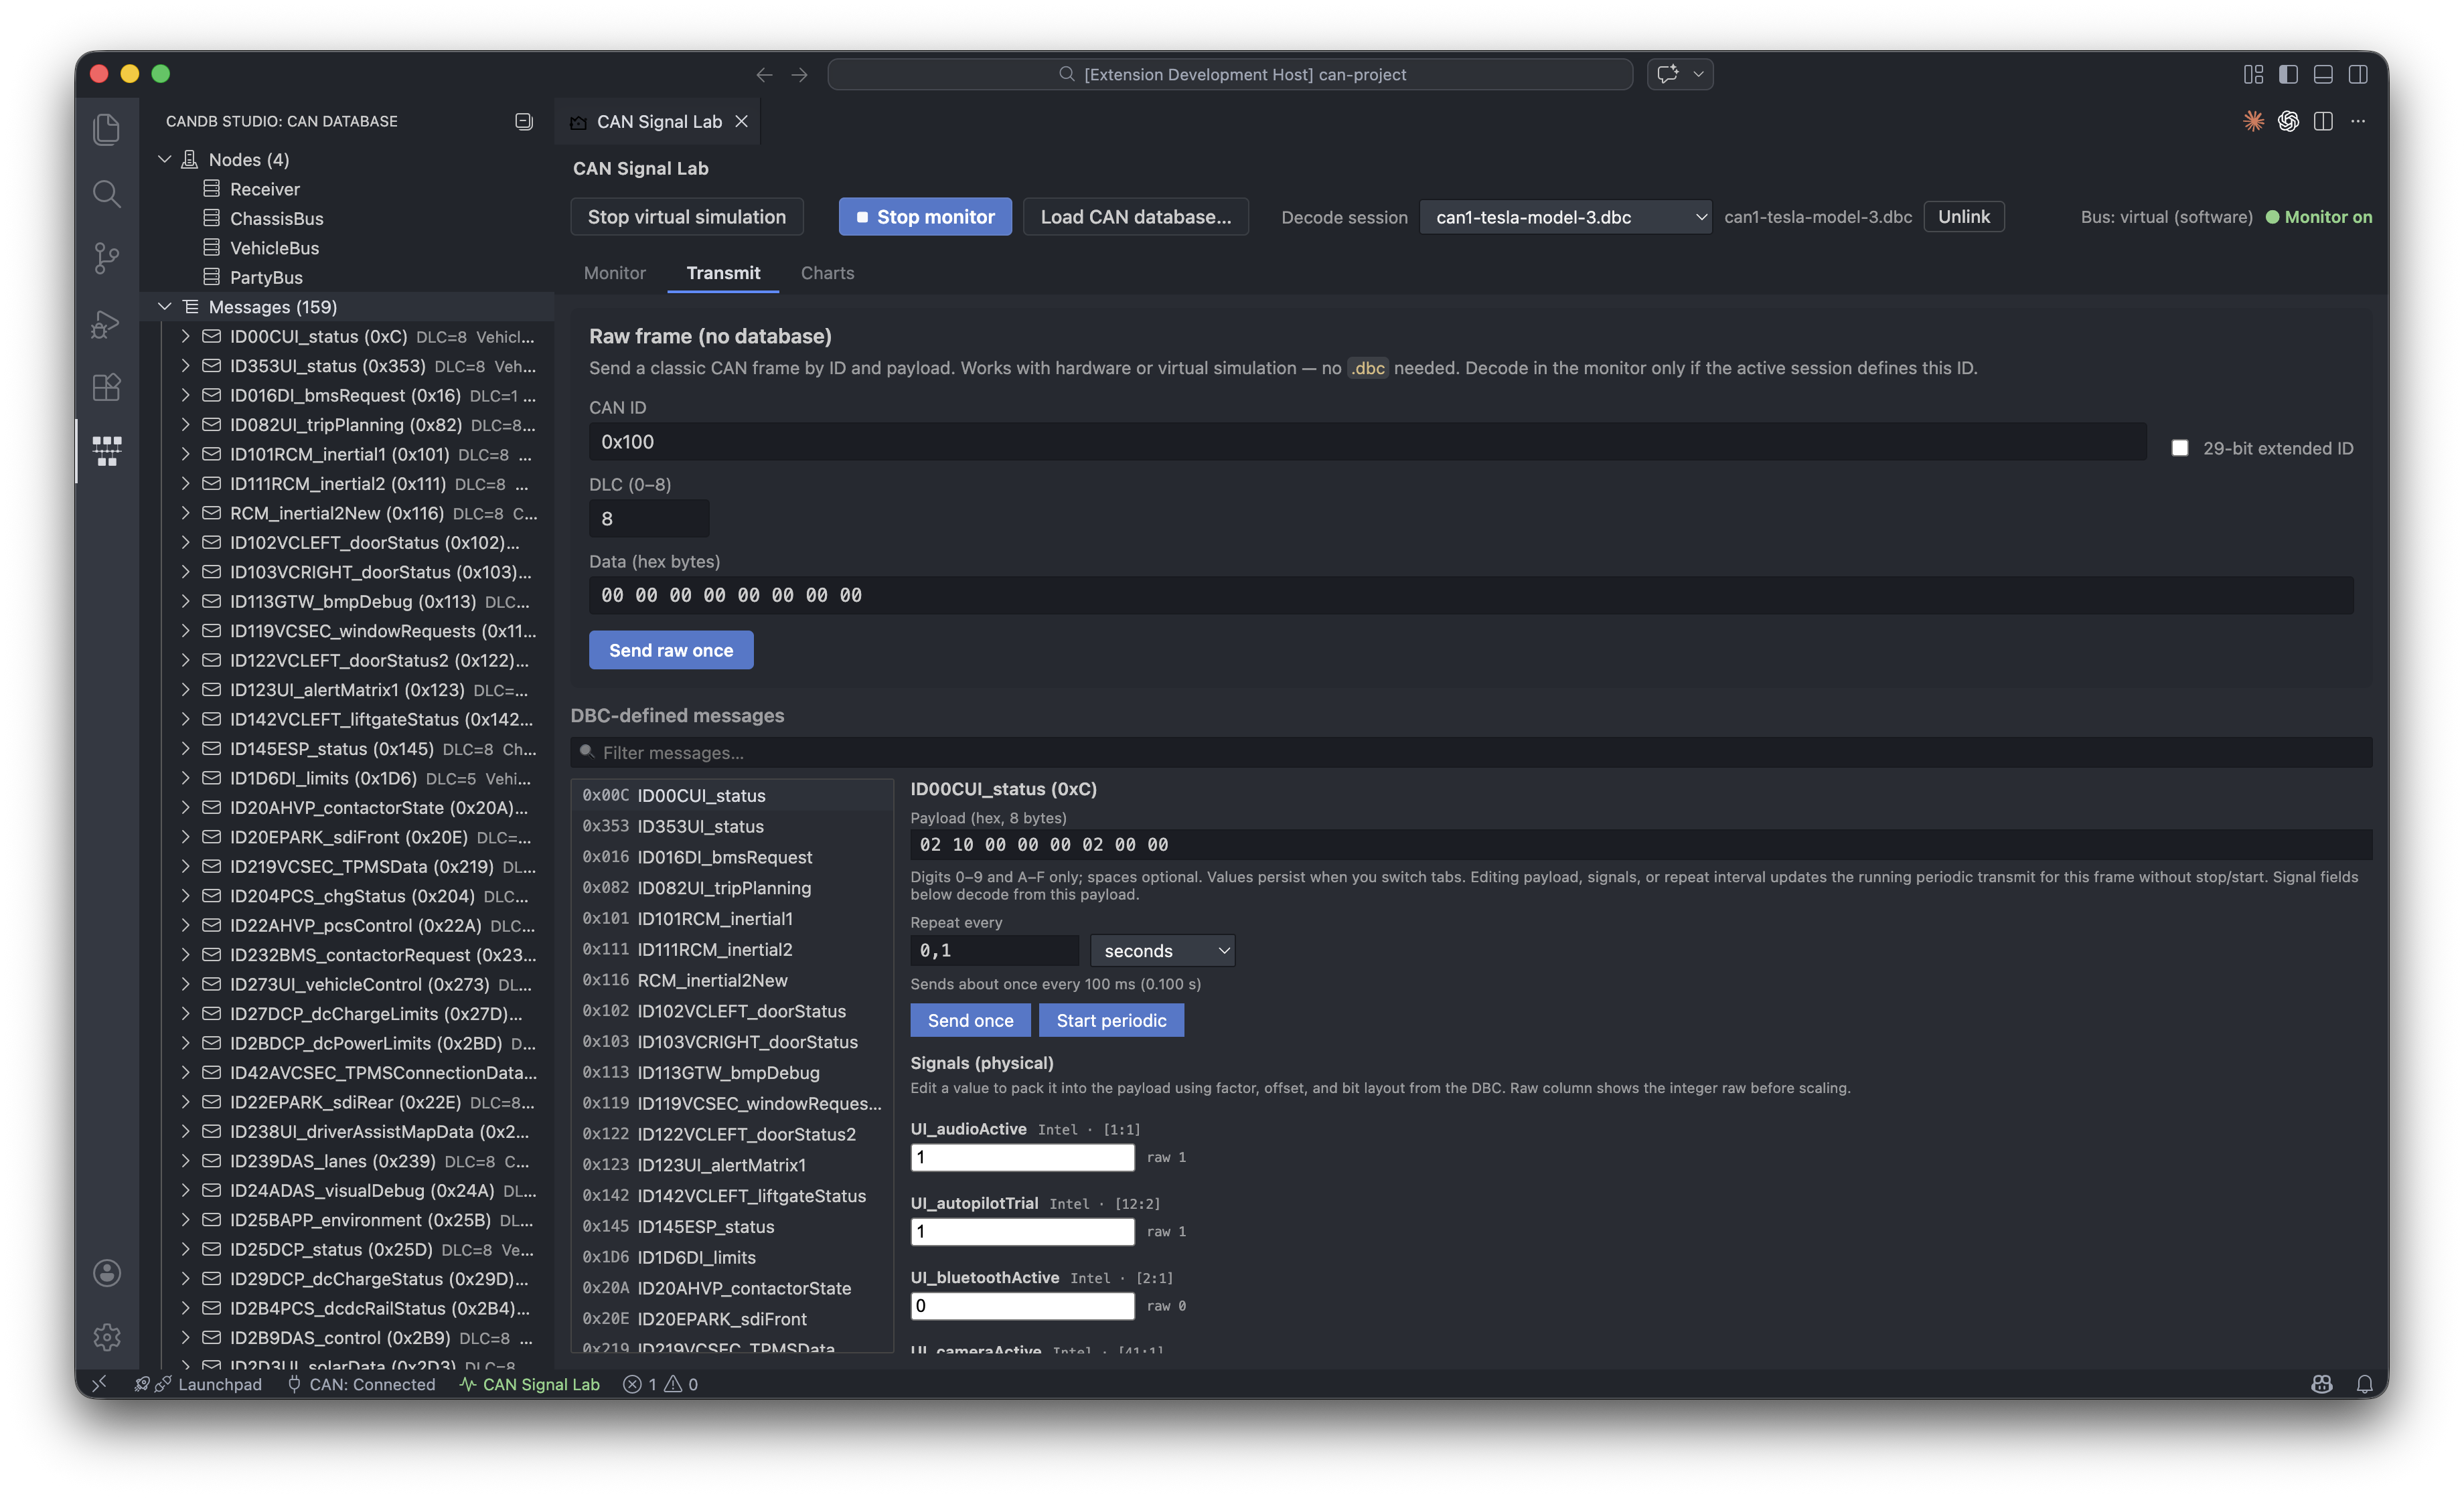
- Transmit — Build and send frames from message definitions in the loaded
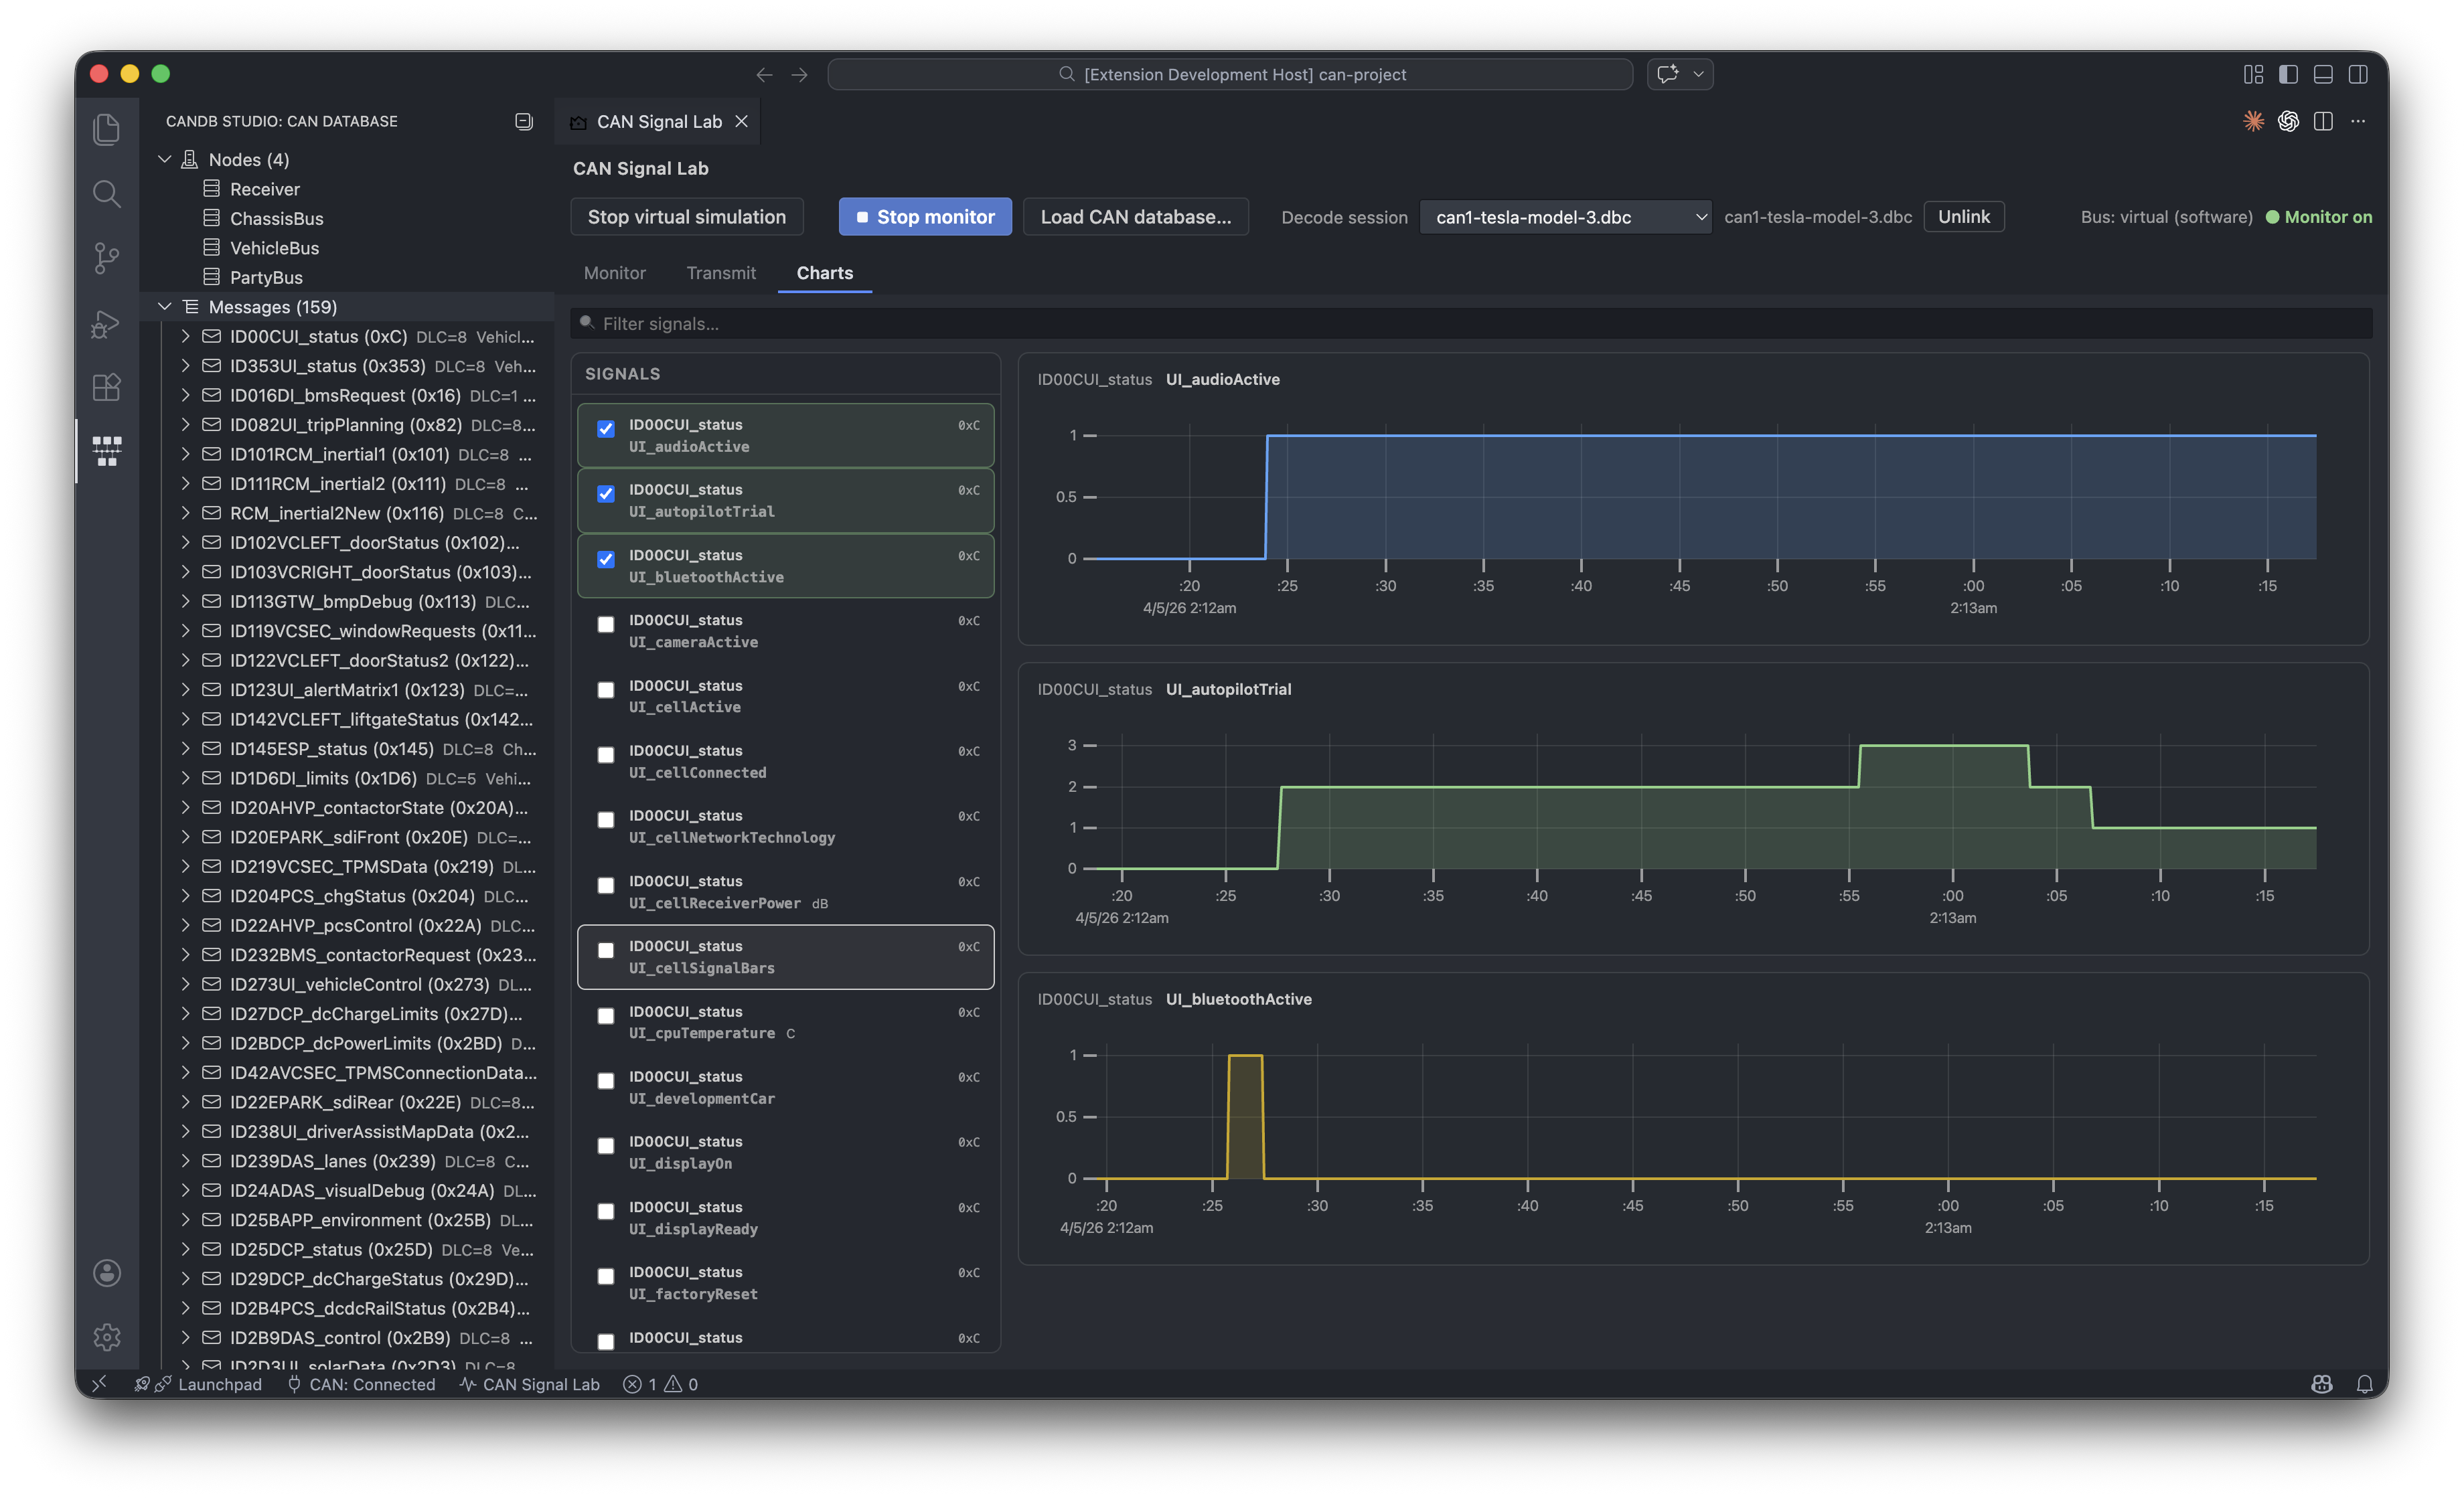
.dbc(ID, DLC, signal layout). Requires a loaded database and a working connection path. - Charts — Signal visualization over time (when data is available).
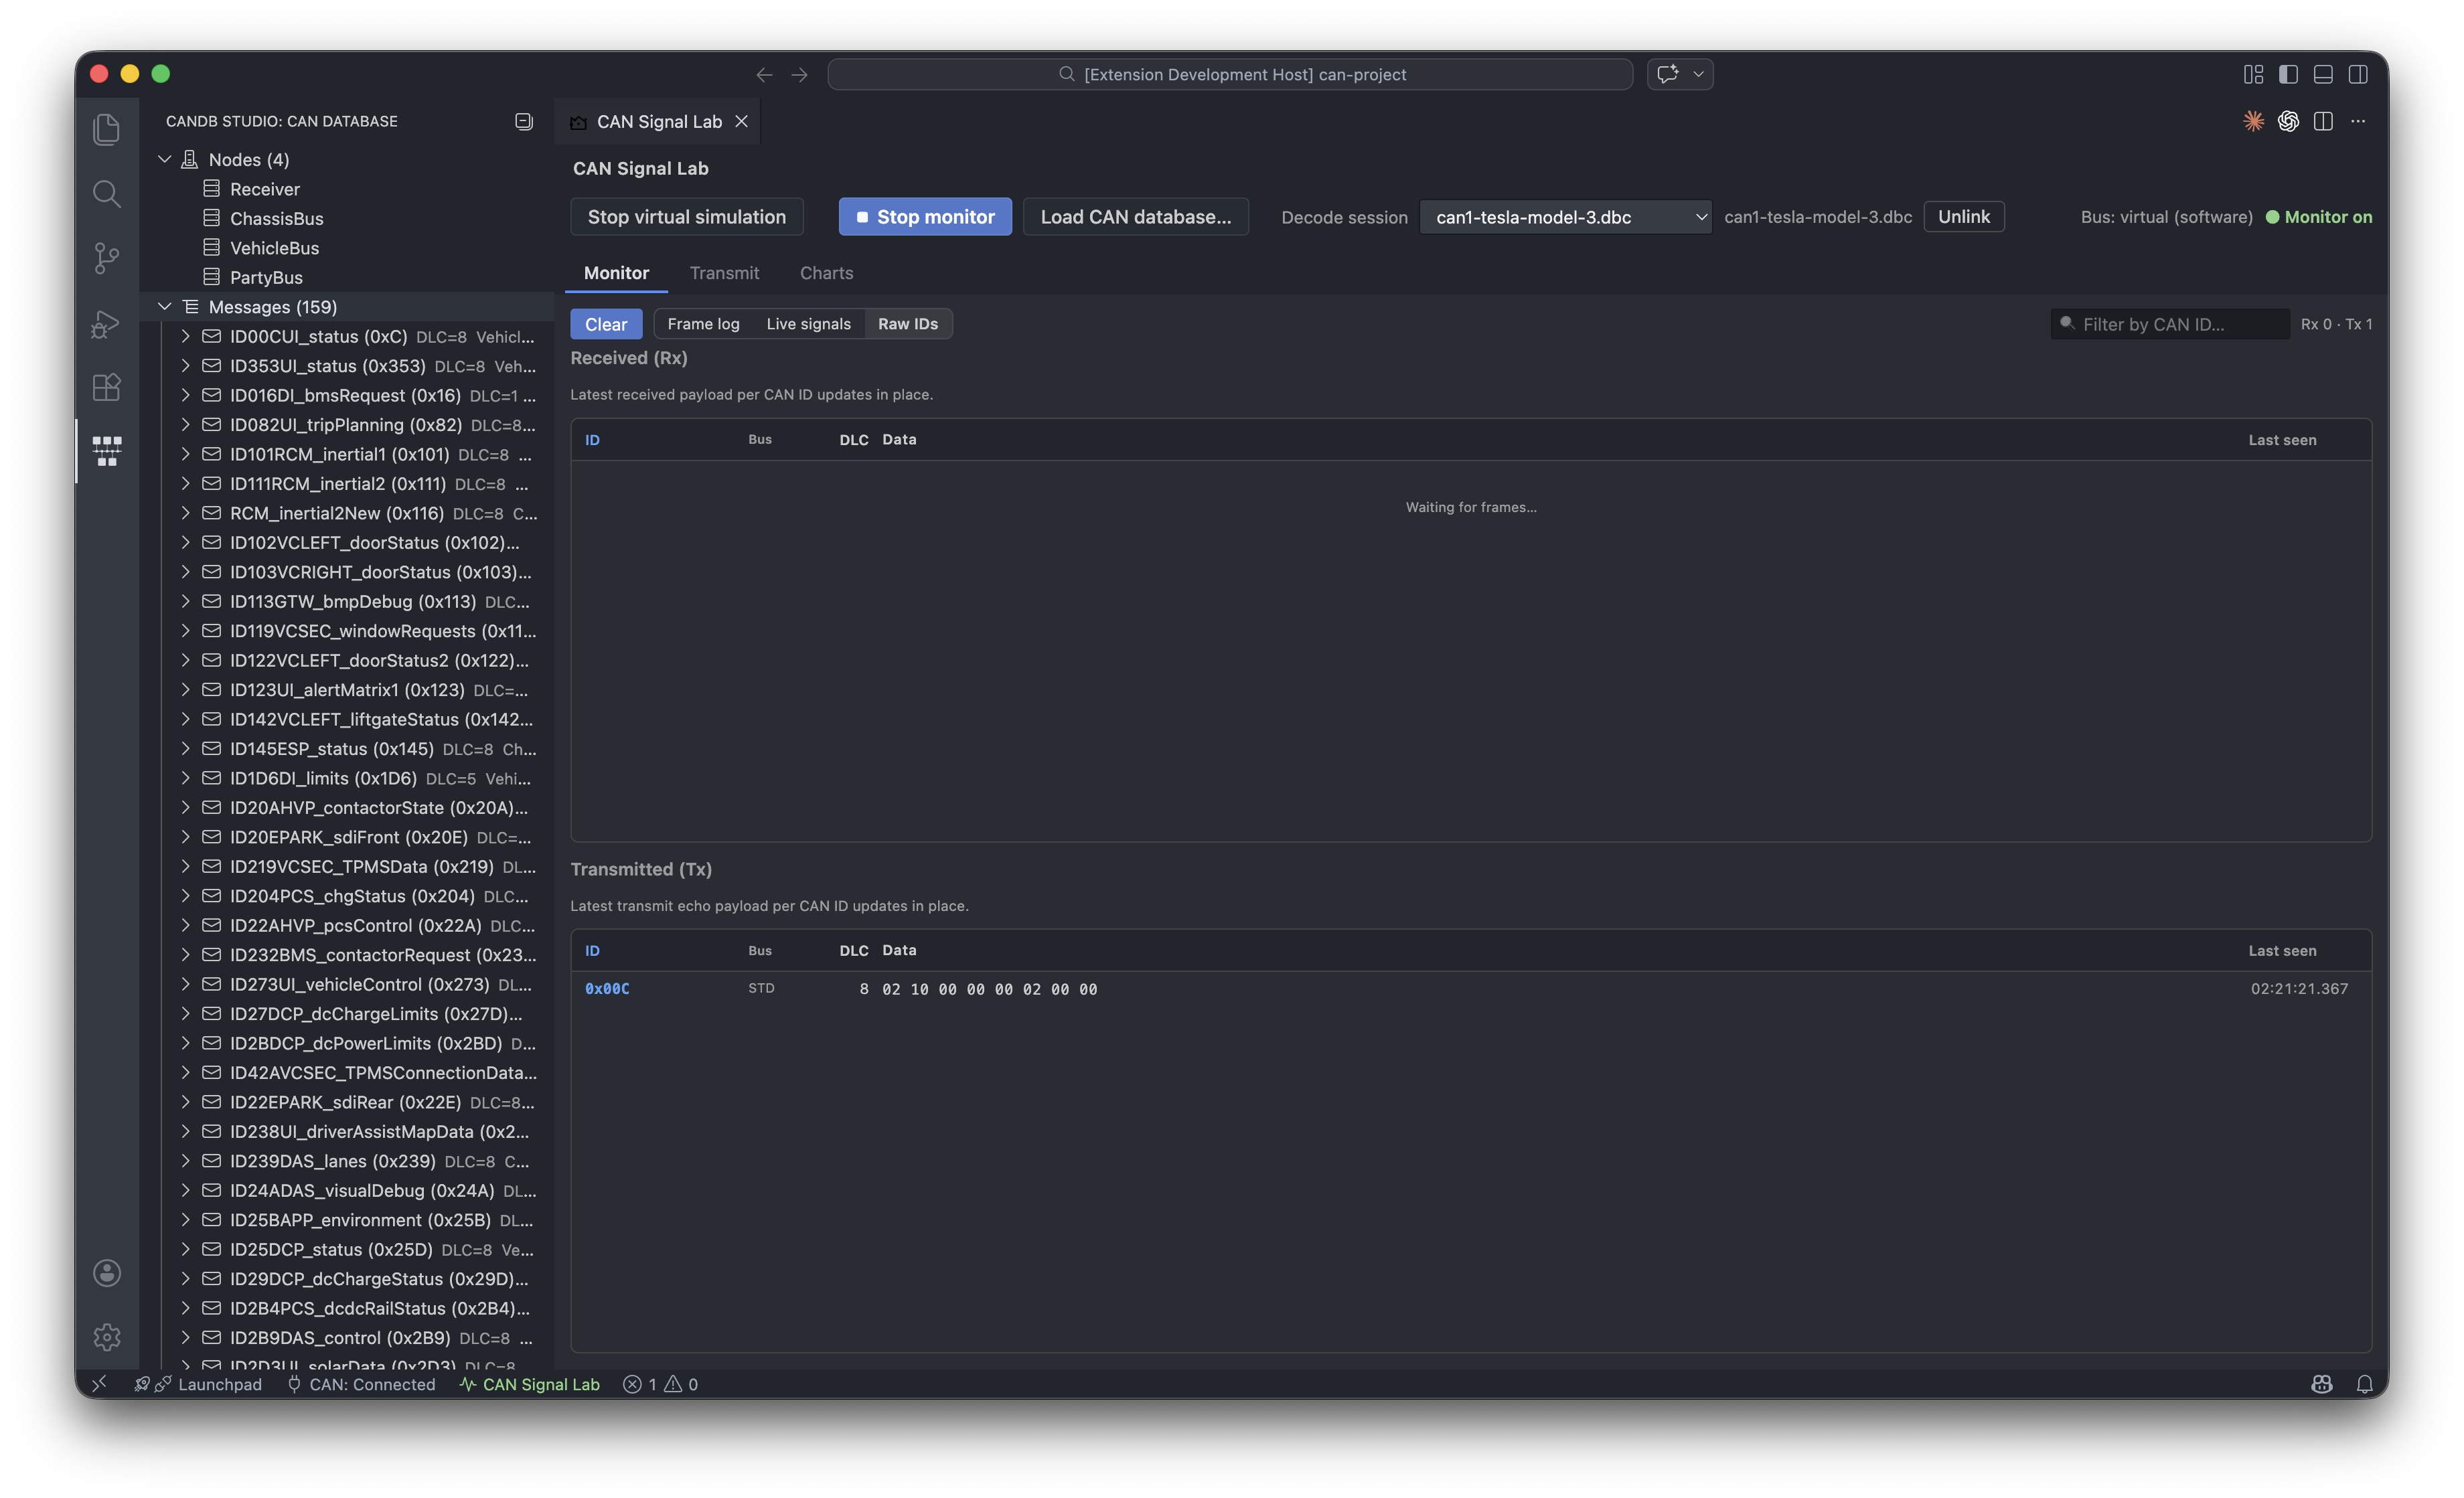
If no database is attached for decoding, traffic may appear as raw IDs and payloads until you load a session / database—see in-UI hints.
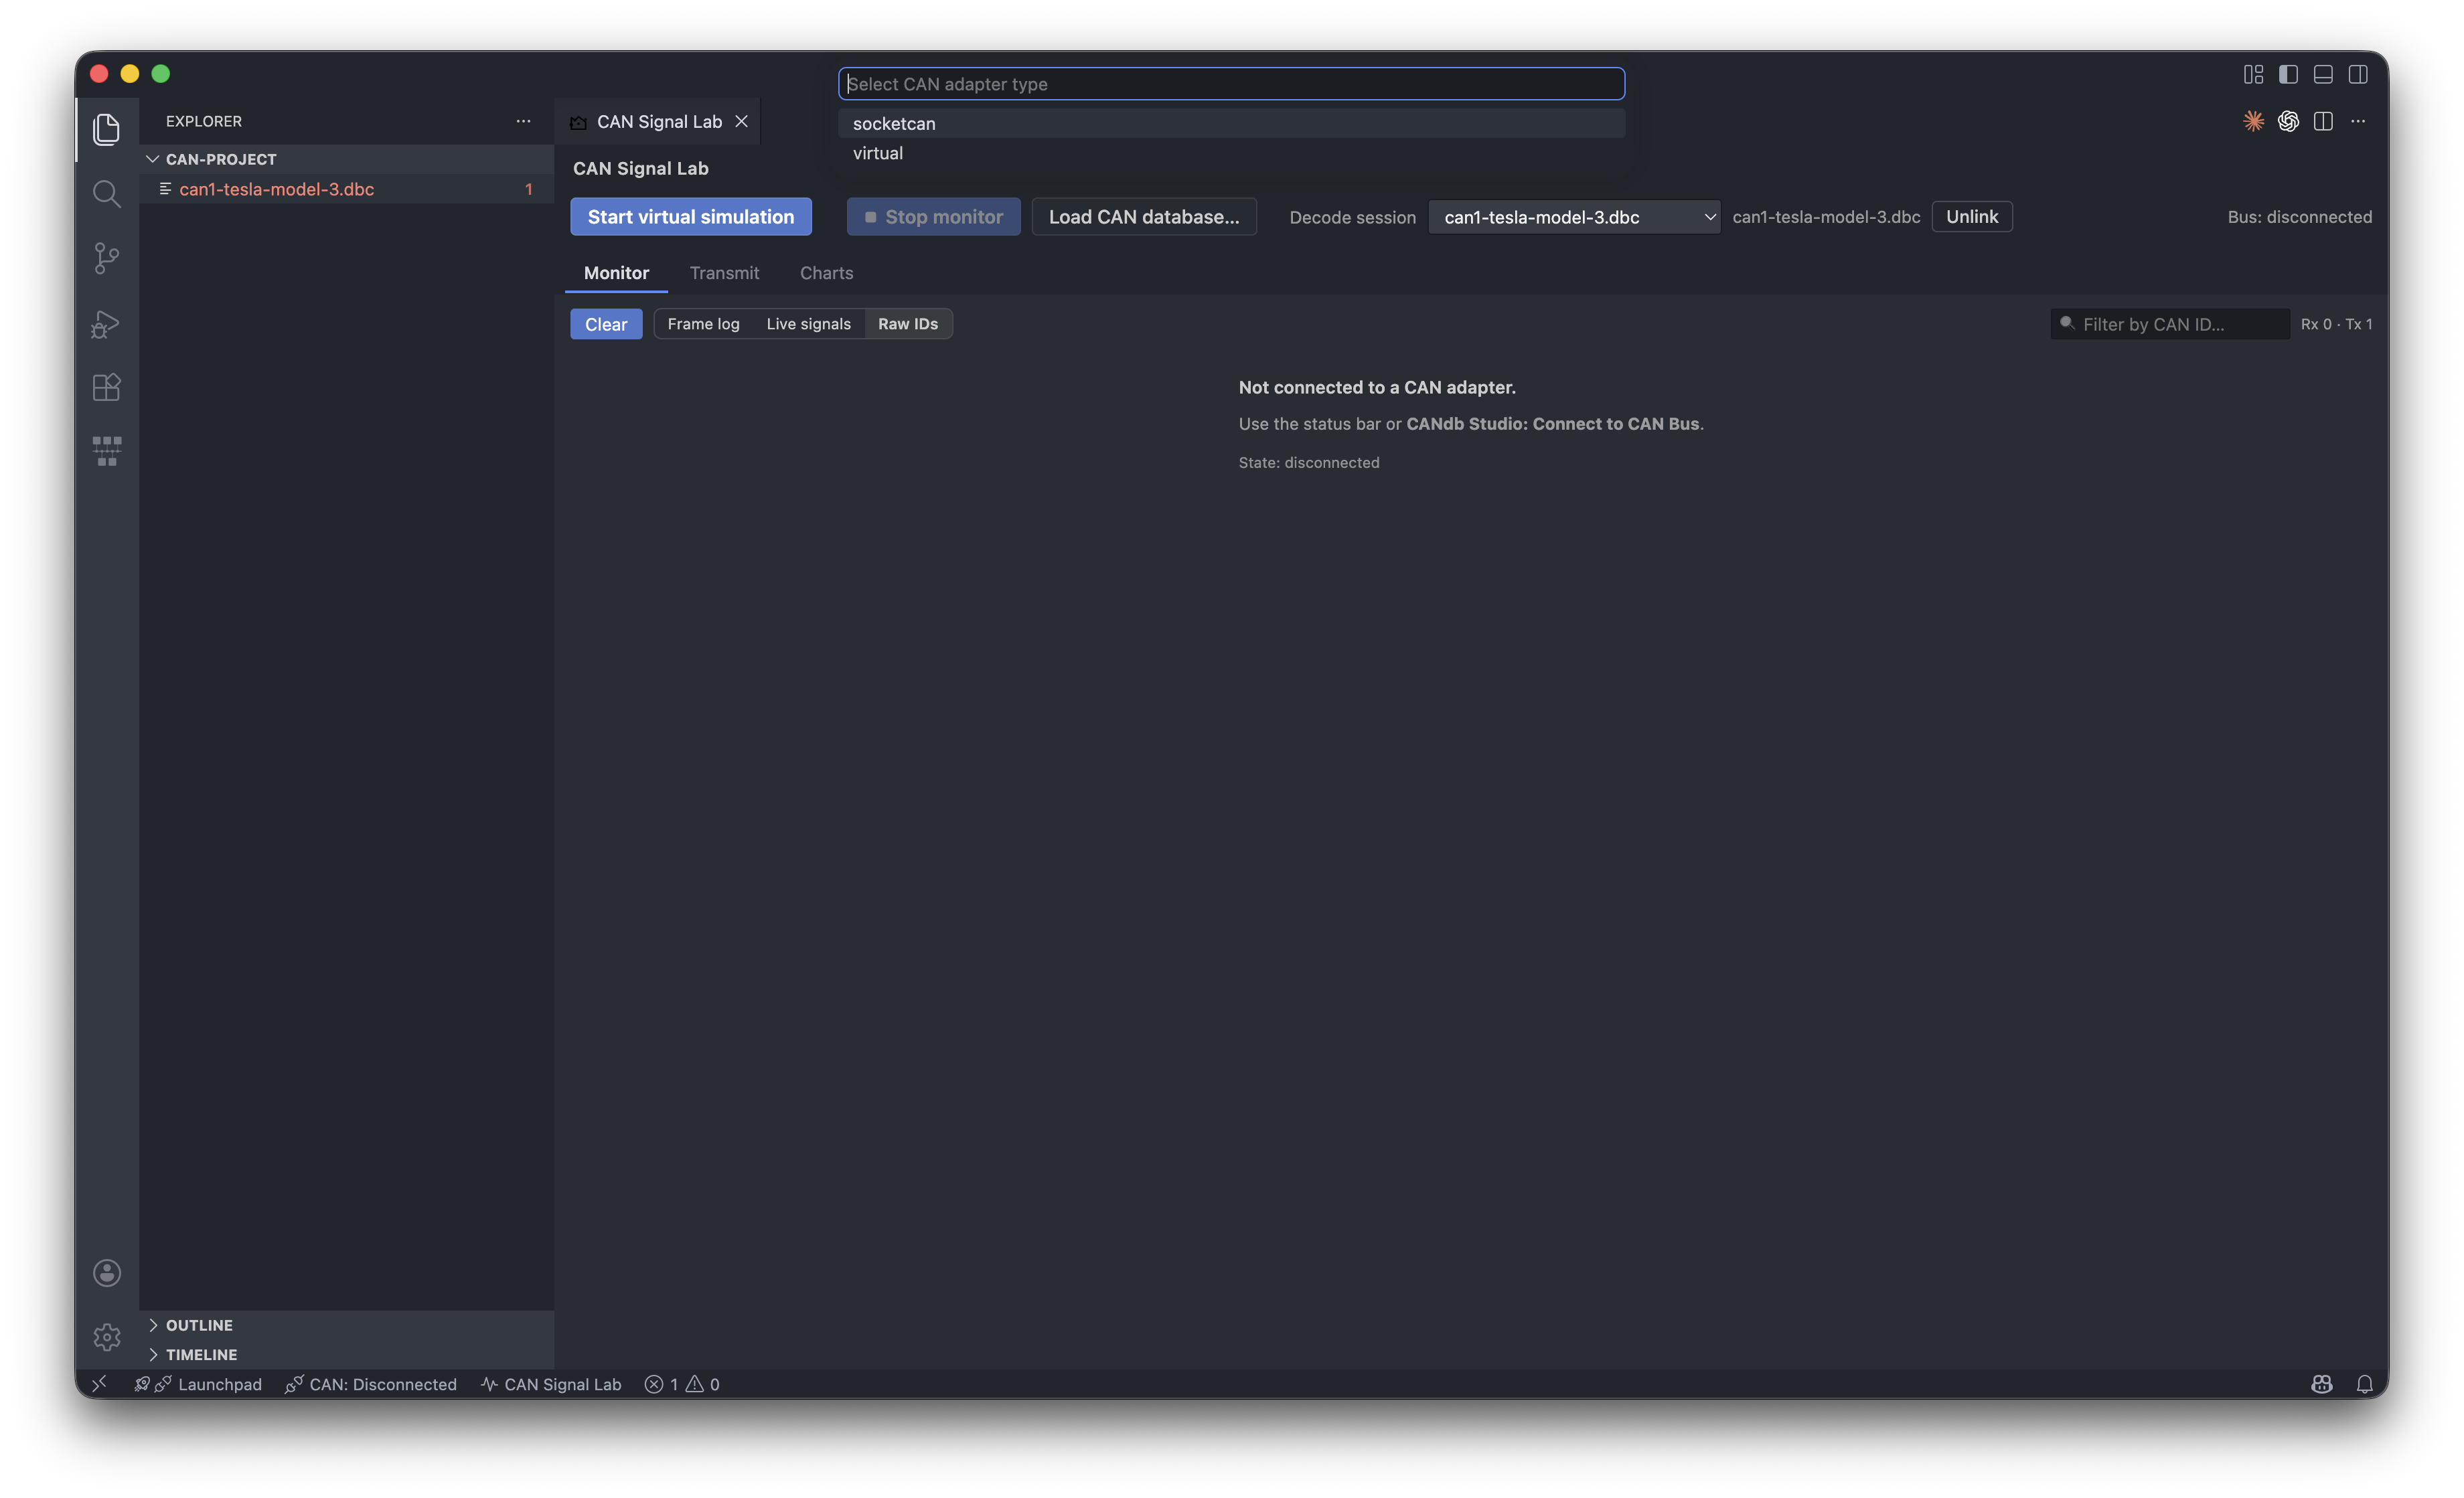
The screenshots below follow the Monitor → Transmit → Charts layout described above: first the Monitor tab (frame log, live signals, then raw IDs), then Transmit, then Charts (virtual bus).
Bus Connection
Connect to CAN Bus walks you through choosing an adapter type and channel (as implemented in the extension). When connected:
- The status bar and Signal Lab UI reflect connection state.
- Start / Stop CAN Monitor controls frame capture.
- Transmit CAN Message sends using your adapter where supported.
Adapter support is pluggable in code but hardware-specific in practice: install vendor drivers, use a supported channel name, and verify on your machine before relying on it in production.
[!NOTE]
Bus (0.1.0): The connect flow lists SocketCAN and virtual. Virtual (software) loopback works end-to-end (monitor / transmit / charts). SocketCAN appears in the UI but the backend is not implemented yet—real interfaces such ascan0will not connect until that ships. Other adapter families (PCAN, Vector, SLCAN, USB‑CAN, …) are not available yet—see Upcoming features (Multi CAN adapter support).DBC decode/encode: Intel (little-endian) layout is covered by tests. Motorola (big-endian) is still a stub—do not rely on correct physical values for Motorola signals in this release.
Upcoming Features
- Multi CAN adapter support (hardware backends beyond the current SocketCAN / virtual options)
- Data recording
.blfdata support
Release Notes
See CHANGELOG.md.
Contributing
See CONTRIBUTING.md for ways to help improve the extension.
Code of Conduct
See CODE_OF_CONDUCT.md.
Donation
If this extension saves you time, you can support continued development with a cup of coffee.
Credits
Demonstration recordings can be captured with tools such as Chronicler.
License
This project is licensed under the MIT License. See LICENSE.
Copyright (c) 2026 afri-bit.