Portviz — Port & Process Inspector for VS Code
See every listening port, who owns it, and whether it's exposed — right inside VS Code.
Features
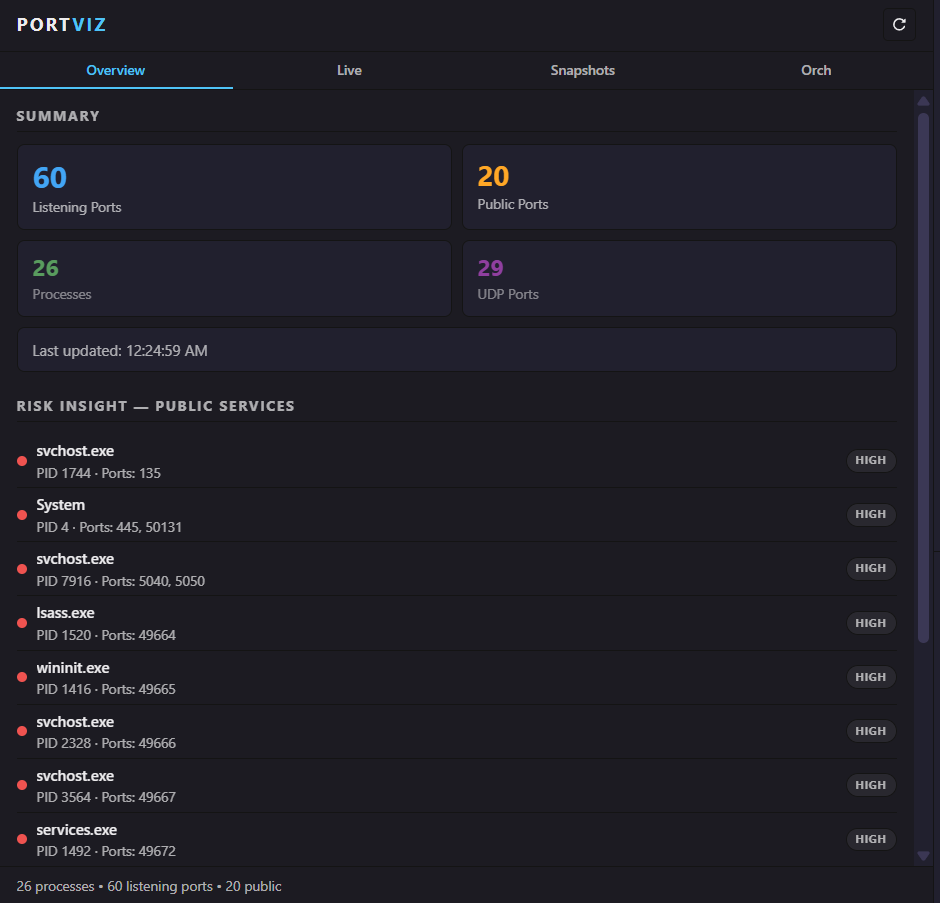
📊 Overview
At-a-glance summary of your machine's port activity — listening ports, public exposure count, process count, UDP ports, and a risk insight panel ranking publicly-exposed services by severity.
🔴 Live Monitoring
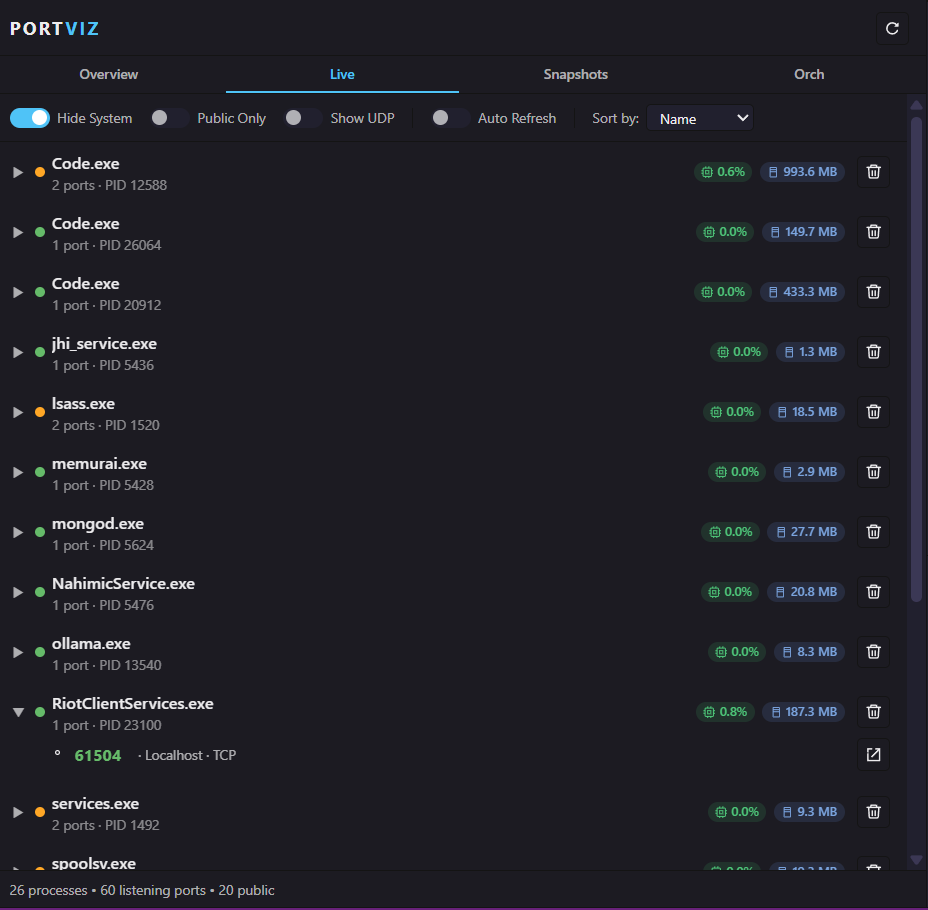
- Expandable process list — click any process to see its ports
- Live CPU % and memory badges per process
- Auto-detected framework hints (~40 frameworks, ~15 well-known ports)
- Filter: hide system processes, public-only, show UDP
- Sort by name, PID, or port count
- One-click kill with confirmation dialog
- Open in browser for any TCP port
- Auto-refresh with configurable interval
📸 Snapshots
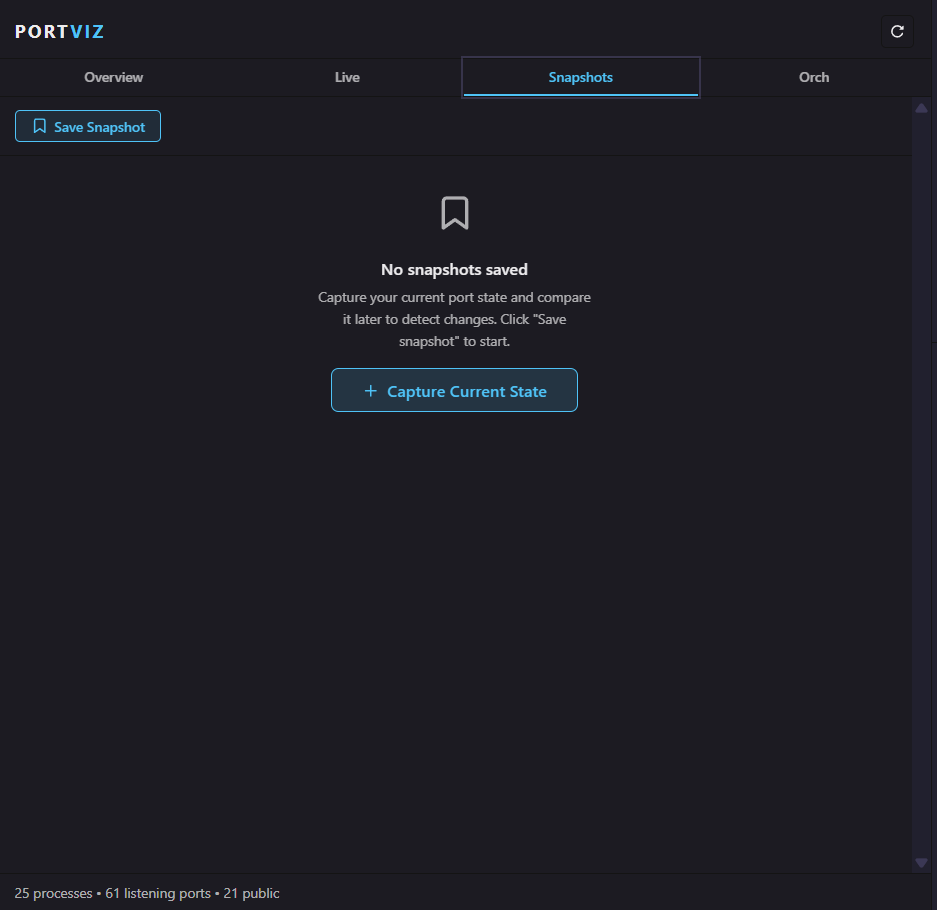
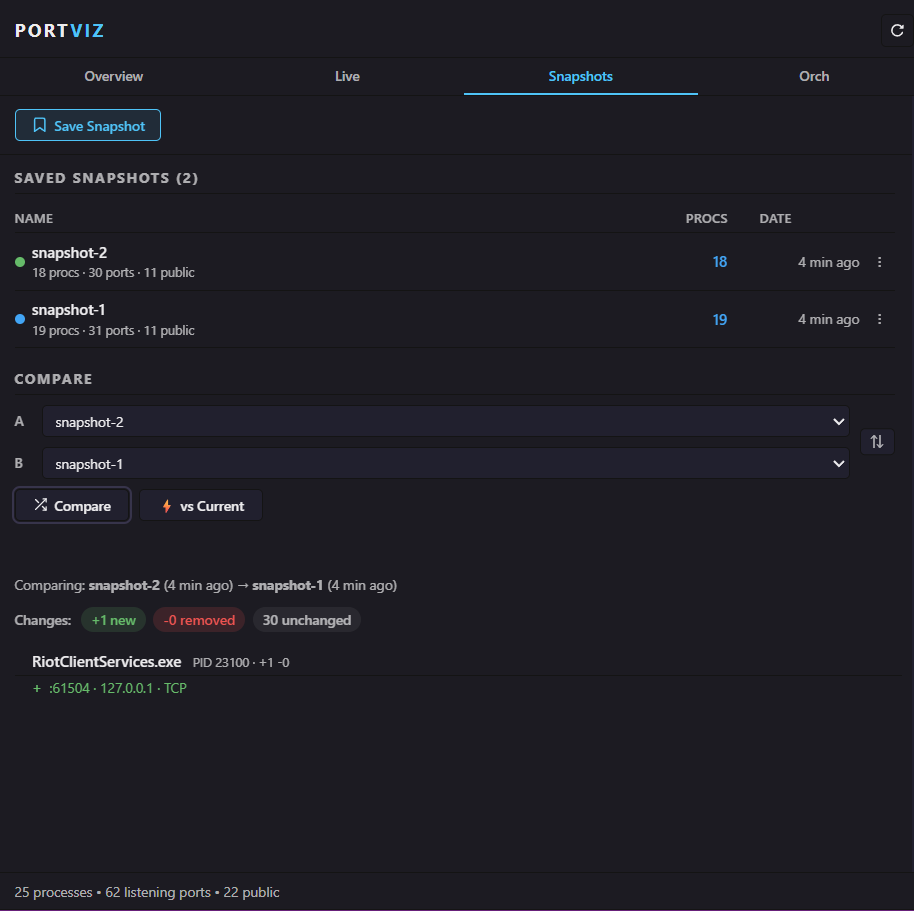
- Save, rename, and delete named snapshots
- Compare any two snapshots — or a snapshot vs current live state
- Grouped diff view: see added/removed/unchanged ports per process
- Swap compare direction with one click
- Configurable max snapshot limit
⚙️ Orchestration
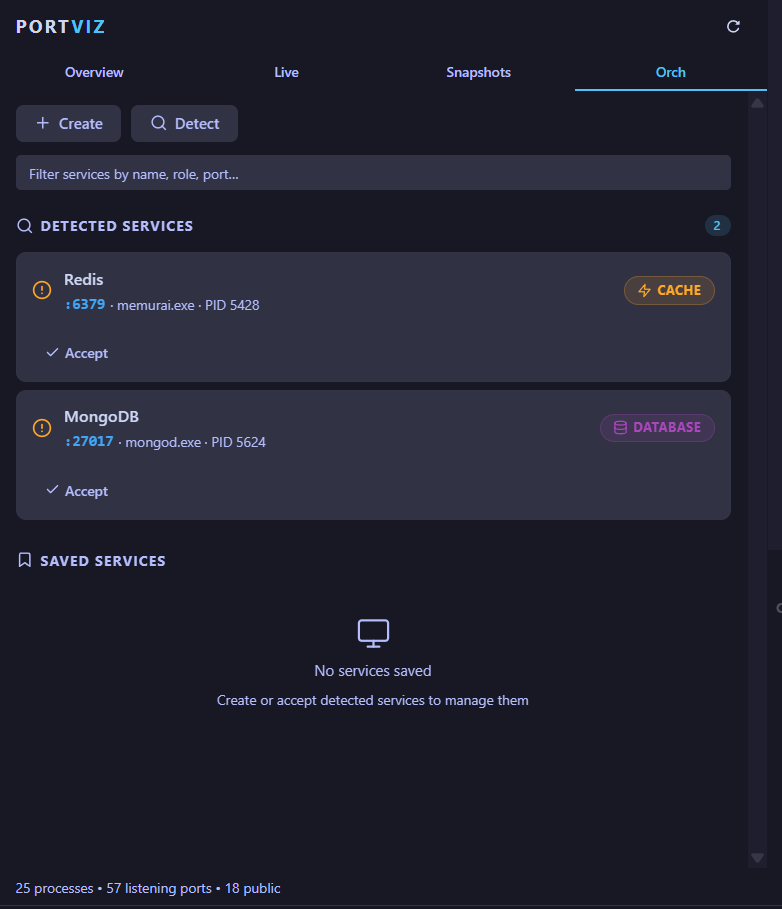
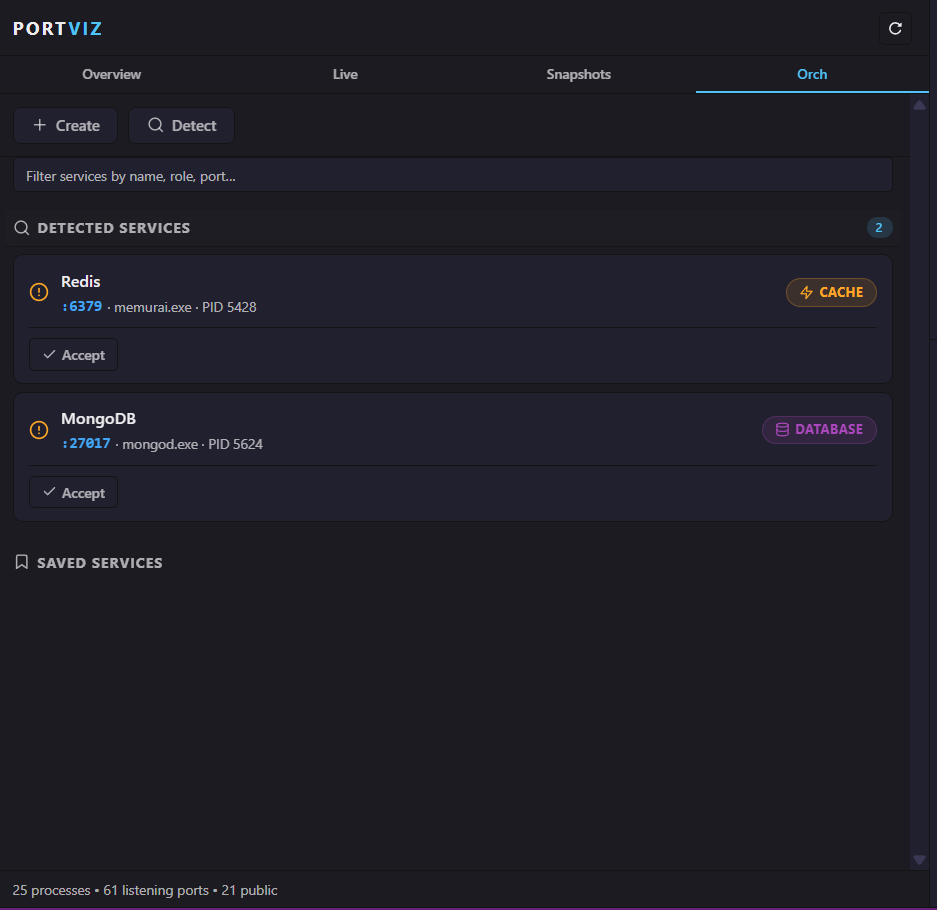
- Auto-detect running dev services by matching ports and processes
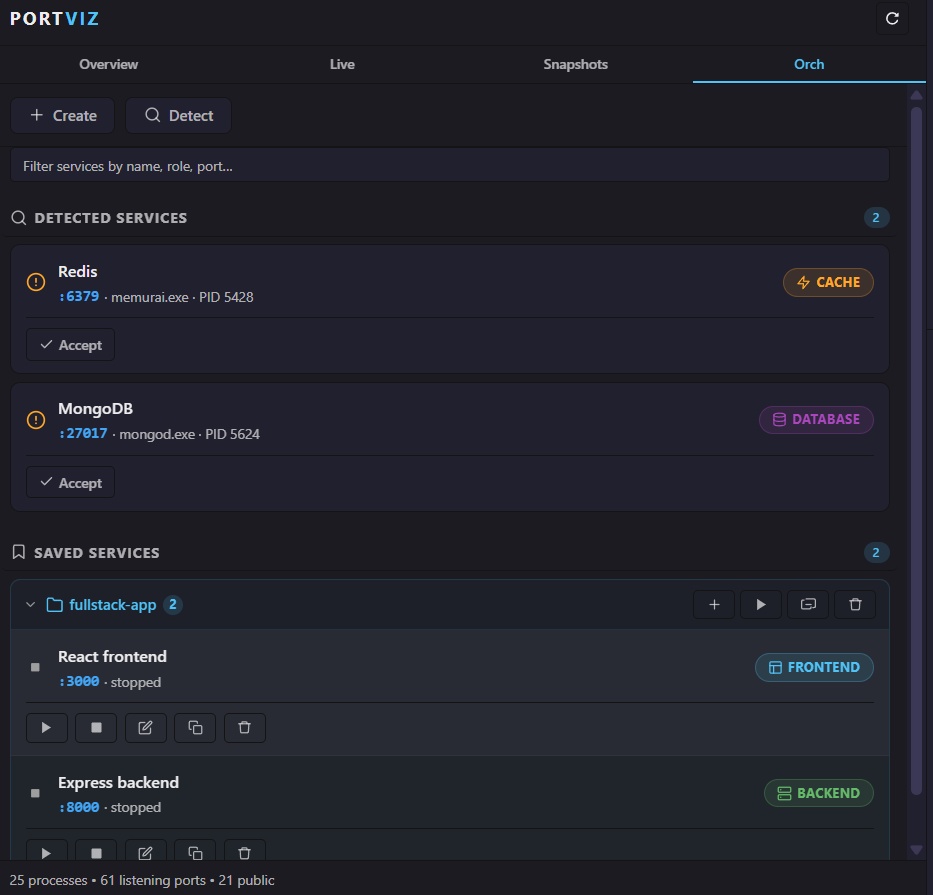
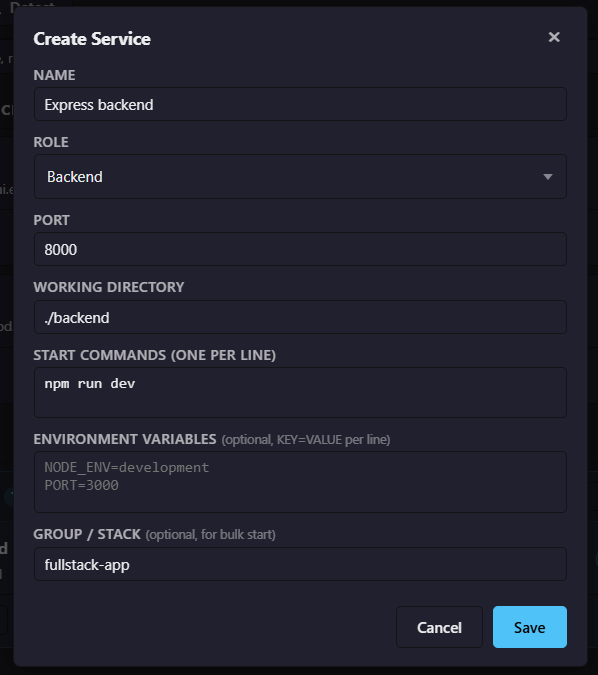
- Create / edit / duplicate / delete service definitions
- Configure: name, role, port, working directory, start commands, env vars, group
- Start / stop services via integrated VS Code terminals
- Service stacks — group services, bulk start, ungroup, or delete
- Status tracking: running · starting · stopped · error
- Timeout detection for startup failures
- Free-text search/filter across all services
🔔 Notifications
- Port opened / port closed toasts (opt-in)
- Public port warning when a service binds to
0.0.0.0 (on by default)
- Watch list — monitor specific ports for up/down alerts
- Service start timeout errors
- Kill result confirmations
📈 Resource Monitor
- Per-process CPU % and memory badges in the Live tab
- Cross-platform: Windows (PowerShell/CIM), macOS/Linux (
ps)
- Configurable poll interval, can be disabled
Requirements
- Portviz CLI installed and on your
PATH (pip install portviz)
- VS Code 1.80+
Extension Settings
Search portviz in Settings to configure:
| Setting |
Default |
Description |
portviz.autoRefreshInterval |
5 s |
Live tab auto-refresh rate |
portviz.cliTimeout |
15 s |
CLI call timeout |
portviz.serviceStartTimeout |
30 s |
Wait for a service to start listening |
portviz.maxSnapshots |
15 |
Max saved snapshots |
portviz.notifications.portOpened |
false |
Toast on new port |
portviz.notifications.portClosed |
false |
Toast on port close |
portviz.notifications.publicPort |
true |
Warn on 0.0.0.0 bind |
portviz.resourceMonitor.enabled |
true |
Per-process CPU/memory polling |
portviz.resourceMonitor.refreshInterval |
10 s |
Resource poll rate |
Known Issues
- Killing system-level processes on Windows may require running VS Code as Administrator.
- Resource monitor data may lag slightly behind port data due to separate polling intervals.
Release Notes
1.0.4
- Added orchestration empty state screenshot
- Reordered orchestration screenshots for clarity
- All orchestration images now have equal height
1.0.1
- Fixed marketplace image URLs
1.0.0
- Initial release with Overview, Live, Snapshots, and Orchestration tabs
- Snapshot diff — compare two snapshots or snapshot vs current
- Service detection, CRUD, and stack management
- Per-process CPU & memory badges
- Port open/close/public notifications
- Configurable auto-refresh, timeouts, and limits
| |
