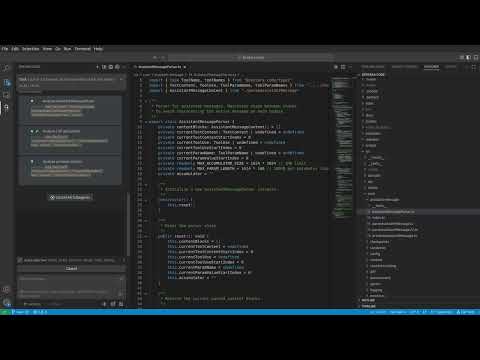
AI Code and AI debug two-in-one: Zentara Code
Zentara Code is your all-in-one AI coding assistant and AI debugger, seamlessly integrated into Visual Studio Code. Whether you're writing new features or fixing bugs, Zentara Code streamlines the process by combining intelligent code generation with powerful runtime AI debugging capabilities.
More Info
📑 Table of Contents

Overview
Zentara Code goes beyond simple code generation. It's an intelligent agent that can:
- Write code: Generate code based on your requirements.
- Use LLM to Debug autonomously: Utilize a full suite of runtime debugging tools to diagnose and fix issues in the code it writes, or in existing codebases.
- Integrate with VS Code: Seamlessly works within your VS Code environment, using its familiar debugging interfaces.
Zentara Code's powerful AI debugging operations are primarily utilized when it operates in Code Mode (for writing and then debugging code) and Debug Mode (for focused debugging tasks). For general information about Zentara Code's broader capabilities as a coding agent (forked from Roo-Code), please refer to the Roo-Code documentation at https://github.com/RooCodeInc/Roo-Code
This empowers developers by automating complex coding and debugging tasks, allowing for faster development cycles and more robust software.
Core Capabilities
- AI-Powered Code Generation & Modification:
- Understands natural language prompts to create and modify code.
- Integrated Runtime AI Debugging:
- Full Debug Session Control: Programmatically launches, and quits debugging sessions.
- Precise Execution Control: Steps through code (over, into, out), sets execution pointers, and runs to specific lines.
- Advanced Breakpoint Management: Sets, removes, and configures conditional, temporary, and standard breakpoints.
- In-Depth State Inspection: Examines call stacks, inspects variables (locals, arguments, globals), and views source code in context.
- Dynamic Code Evaluation: Evaluates expressions and executes statements during a debug session to understand and alter program state.
- Intelligent Exception Handling:
- When a program or test run in a debugging session encounters an error or exception, Zentara Code can analyze the exception information from the debugger.
- It then intelligently decides on the next steps, such as performing a stack trace, reading stack frame variables, or navigating up the call stack to investigate the root cause.
- Enhanced Pytest Debugging:
- Zentara Code overrides the default pytest behavior of silencing assertion errors during test runs.
- It catches these errors immediately, allowing for real-time, interactive debugging of pytest failures. Instead of waiting for a summary at the end, exceptions bubble up, enabling Zentara Code to react contextually (e.g., by inspecting state at the point of failure).
- Language-Agnostic Debugging:
- Leverages the Debug Adapter Protocol (DAP) to debug any programming language that has a DAP-compliant debugger available in VS Code. This means Zentara Code is not limited to specific languages but can adapt to your project's needs.
- VS Code Native Experience: Integrates seamlessly with VS Code's debugging infrastructure, providing a familiar and powerful experience.
Detailed Debugging Operations
Zentara Code provides a rich set of granular AI debugging operations, allowing for precise control over the debugging process:
Session Management
debug_launch
: Starts a new AI debugging session. You can either provide a direct path to a program/test for a dynamic configuration, or reference a pre-existing configuration by name from your launch.json
file (e.g., "Run Extension"), offering more flexibility.
debug_quit
: Terminates the currently running program and exits the debugger.
Execution Control
debug_continue
: Resumes program execution until the next breakpoint or program end.
debug_next
: Executes the current line and stops at the next line in the current function (steps over calls).
debug_step_in
: Steps into a function call on the current line, or to the next line if no function call.
debug_step_out
: Continues execution until the current function returns, then stops.
debug_jump
: Changes the next line of code that will be executed within the current stack frame.
debug_until
: Continues program execution until it reaches a specified line number in the current source file.
Breakpoint Management
debug_set_breakpoint
: Adds a breakpoint at a specified location.
debug_set_temp_breakpoint
: Adds a temporary breakpoint that is removed after being hit once.
debug_remove_breakpoint
: Removes an existing breakpoint.
debug_remove_all_breakpoints_in_file
: Removes all breakpoints currently set in a specified source file.
debug_disable_breakpoint
: Disables an existing breakpoint without removing it.
debug_enable_breakpoint
: Re-enables a previously disabled breakpoint.
debug_ignore_breakpoint
: Sets or clears an ignore count for a breakpoint (skip N hits).
debug_set_breakpoint_condition
: Sets or clears the condition for an existing breakpoint.
debug_get_active_breakpoints
: Retrieves a list of all currently set breakpoints.
Stack & Source Inspection
debug_stack_trace
: Displays the current call stack of the paused program.
debug_list_source
: Displays lines of source code around the current execution point in a frame.
debug_up
: Moves the debugger's current focus one level up in the call stack.
debug_down
: Moves the debugger's current focus one level down in the call stack.
debug_goto_frame
: Changes the debugger's current focus to a specific stack frame by ID.
debug_get_source
: Retrieves the source code definition for an object, function, or class.
State Inspection & Evaluation
debug_get_stack_frame_variables
: Retrieves variables from specified scopes (Local, Arguments, etc.) within a frame.
debug_get_args
: Retrieves the arguments passed to the function/method of a specified stack frame.
debug_evaluate
: Evaluates an arbitrary expression within the context of a specified stack frame.
debug_pretty_print
: Evaluates an expression and returns a formatted, human-readable string of its value.
debug_whatis
: Evaluates an expression and returns the type of the resulting value.
debug_execute_statement
: Executes a given statement (potentially with side effects) in a frame.
debug_get_last_stop_info
: Retrieves the full body of the last "stopped" event from the debugger.
Getting Started
Zentara Code is a VS Code extension. Here's how you can get started:
1. Install from VS Code Marketplace (Recommended for Users)
- Install latest VS Code. The extension is build for VS Code 1.102 and later
- Open VS Code.
- Install the necessary language extension and language debugger extension. For example for Python, just install Microsoft Python extension, it will automatically install debugpy debugger. Check the debugger manually on any of your script to make sure it works.
- Configure
launch.json
(Optional but Recommended): For a more streamlined experience, you can define debug configurations in your .vscode/launch.json
file. This allows you to launch complex debugging scenarios with a simple name (e.g., "Run Extension", "Debug Current Test File"). You can then instruct Zentara to use these configurations directly, e.g., "Zentara, launch the debugger with the 'Run Extension' config". For TypeScript files, install npm and tsx (by running npm install -g tsx
).
- For Zentara Code to effectively debug Python projects, especially those using Conda environments or specific
pytest
installations, ensure the correct Python interpreter is configured in your VS Code settings (.vscode/settings.json
):
{
"python.defaultInterpreterPath": "/path/to/your/conda/env/bin/python"
}
Replace /path/to/your/conda/env/bin/python
with the actual path to your Python interpreter.
- For python pytest tests: install pytest. If you would like to install pytest in a conda enviroment,remember to point the python interperter in settings.json(see the above point)
- Go to the Extensions view (Ctrl+Shift+X or Cmd+Shift+X).
- Search for "Zentara Code".
- Click "Install".
- Once installed, Zentara Code will be available to assist you.
For more detailed installation instruction, please visit https://zentar.ai, click on the "Install for free" button.
2. Build and Install from Source (For Developers/Contributors)
If you want to contribute or run the latest development version:
Clone the repository:
git clone https://github.com/Zentar-Ai/Zentara-Code.git
cd zentara-code
Install dependencies:
This project uses pnpm. Ensure you have Node.js npm , pnpm installed.
pnpm install
Build the extension:
pnpm vsix
This will typically compile the TypeScript code and package the extension into a .vsix
file in a bin/
directory.
Install the .vsix file in VS Code:
- Go to the Extensions view in VS Code.
- Click the "..." (More Actions) menu in the top-right corner of the Extensions view.
- Select "Install from VSIX..."
- Navigate to and select the generated
.vsix
file.
How to Launch a Debugging Session
There are three primary ways to launch a debugging session with Zentara Code:
a) Automatic Configuration (Python, TypeScript, JavaScript):
Simply provide Zentara with the program path and any necessary arguments.
- If the file is a Python, TypeScript, or JavaScript file, Zentara will automatically create a dynamic debugging configuration and launch the session.
- For other file types, Zentara will inspect your
launch.json
file to find an appropriate existing configuration. If none is found, it will create a new launch configuration in launch.json
. You may need to adjust this configuration and install any necessary debugging dependencies for your environment.
b) Using a launch.json
Configuration:
For more control and for complex projects, you can use a launch.json
file. This is the standard way to configure debugging in VS Code.
- What is
launch.json
? It's a configuration file where you define your debugging setups. You can specify the program to run, arguments, environment variables, and other important settings.
- Where is it? This file is located in a
.vscode
folder at the root of your project (.vscode/launch.json
).
- What if it doesn't exist? If you don't have one, you can ask Zentara to create it for you! For example: "Zentara, create a launch configuration for my current file."
Once you have a launch.json
file with a named configuration (e.g., "Run Extension"), you can instruct Zentara to use it:
- Provide the name of the configuration to Zentara (e.g., "Zentara, launch the debugger with the 'Run Extension' config").
- You can also optionally provide a program name if it's not already specified in the
launch.json
configuration.
c) Manual Launch:
For complex scenarios or when you're already in a manual debugging session, you can launch the debugger yourself using VS Code's standard tools.
- Once the session is active, you can then leverage Zentara for the rest of the debugging process, such as automatically setting breakpoints, evaluating the call stack, and inspecting variables.
Quick Example
Here are a few examples of how you can use Zentara Code to debug different types of projects.
The example scripts (quicksort_buggy.py
, test_quicksort_pytest.py
, merge_sort_buggy.js
, insertion_sort_buggy.ts
, etc.) mentioned in these tutorials can be found in the testdata/
directory of this repository.
These tutorials are condensed versions; for more detailed step-by-step guides, please refer to the corresponding markdown files in the testdata/
directory (e.g., debugging_demo.md
, debugging_demo_pytest.md
).
1. Debugging a Python Script
This tutorial demonstrates debugging a standard Python script. We'll use an example of a buggy quicksort algorithm.
Scenario: You have a Python script, quicksort_buggy.py
, that isn't sorting correctly.
a. Prepare Your Workspace:
- Ensure
testdata/quicksort_buggy.py
(or your target script) is in your workspace.
- (Optional) Create a copy to debug, e.g.,
testdata/quicksort_buggy.debug.py
.
b. Initiate AI Debugging with Zentara Code:
Instruct Zentara Code (e.g., in Code Mode or Debug Mode):
"Zentara, start debugging testdata/quicksort_buggy.debug.py
"
(Zentara Code would use debug_launch
with program: "testdata/quicksort_buggy.debug.py"
)
c. Observe Initial Behavior (Optional):
"Zentara, continue execution and let me know what happens."
(Zentara Code uses debug_continue
)
The script might run to completion, show errors, or fail assertions.
d. Set Breakpoints & Investigate:
Assume an error occurs related to sorting an empty list.
"Zentara, restart the debug session for testdata/quicksort_buggy.debug.py
.
Set a breakpoint at the beginning of the quick_sort
function in testdata/quicksort_buggy.debug.py
.
Also, set a breakpoint where quick_sort
is called for an empty list scenario (likely within the script's own test harness).
Continue execution until the breakpoint for the empty list call is hit."
(Zentara Code uses debug_restart
, debug_set_breakpoint
, then debug_continue
)
e. Step Through and Inspect:
Once paused:
"Zentara, I'm at the breakpoint.
- What are the arguments being passed to
quick_sort
?
- Now, step into the
quick_sort
function."
(Zentara Code uses debug_evaluate
or debug_get_args
, then debug_step_in
)
Inside quick_sort
:
"Zentara, step through the function line by line. Show me the values of low
, high
, and arr
at each step."
(Zentara Code uses debug_next
repeatedly, with debug_evaluate
or debug_get_stack_frame_variables
)
f. Diagnose the Bug:
Based on the debugger's output, you might identify the cause.
"Zentara, it seems the base case for empty lists in quick_sort
is not handled correctly."
2. AI Debugging Python with Pytest
This tutorial shows how to debug Python code using pytest
.
Scenario: You have quicksort_buggy.py
and a test_quicksort_pytest.py
file containing tests for it.
a. Prepare Your Workspace:
- Ensure both
testdata/quicksort_buggy.py
and testdata/test_quicksort_pytest.py
are present.
- It's good practice to have tests import from a copy, e.g.,
testdata/quicksort_buggy.debug.py
. Create this copy.
b. Initiate Pytest Debugging:
"Zentara, debug the tests in testdata/test_quicksort_pytest.py
using pytest."
(Zentara Code uses debug_launch
with program: "testdata/test_quicksort_pytest.py"
, `mode: "pytest"')
c. Observe Initial Test Failures:
"Zentara, continue execution and report the pytest results."
(Zentara Code uses debug_continue
)
Pytest will report failing tests.
d. Set Breakpoints & Investigate a Failing Test:
Assume test_empty_list
in testdata/test_quicksort_pytest.py
fails.
"Zentara, restart the pytest debug session for testdata/test_quicksort_pytest.py
, stopping at entry.
Set a breakpoint in testdata/test_quicksort_pytest.py
where the quick_sort
logic is called for test_empty_list
.
Also, set a breakpoint at the start of the quick_sort
function in testdata/quicksort_buggy.debug.py
.
Continue execution."
(Zentara Code uses debug_restart
, debug_set_breakpoint
(for test and source file), then debug_continue
)
e. Step Through Test and Source Code:
When paused in the test file:
"Zentara, step into the call that leads to quick_sort
."
(Zentara Code uses debug_step_in
)
Once inside quick_sort
in testdata/quicksort_buggy.debug.py
:
"Zentara, step through quick_sort
line by line, showing key variables, to see why test_empty_list
is failing."
(Zentara Code uses debug_next
and variable inspection tools)
f. Diagnose the Bug:
By observing the runtime behavior of testdata/quicksort_buggy.debug.py
as called by the test, you can identify the bug.
3. AI Debugging a JavaScript Script
This tutorial covers debugging a typical JavaScript (e.g., Node.js) script. We'll use a buggy Merge Sort example.
Scenario: You have merge_sort_buggy.js
that produces incorrect output.
a. Prepare Your Workspace:
- Ensure
testdata/merge_sort_buggy.js
is available.
- (Optional) Create a copy, e.g.,
testdata/merge_sort_buggy.debug.js
.
b. Initiate JavaScript Debugging:
"Zentara, start debugging testdata/merge_sort_buggy.debug.js
"
(Zentara Code uses debug_launch
with program: "testdata/merge_sort_buggy.debug.js"
and stopOnEntry: true
)
c. Observe Initial Output:
"Zentara, continue and show me the output."
(Zentara Code uses debug_continue
)
d. Set Breakpoints & Investigate:
Suppose an array [5, 2, 8, 1, 9, 4]
is sorted incorrectly.
"Zentara, restart debugging for testdata/merge_sort_buggy.debug.js
.
Set a breakpoint at the start of the mergeSort
function in testdata/merge_sort_buggy.debug.js
.
Set another breakpoint where mergeSort
is called with [5, 2, 8, 1, 9, 4]
(within the script's test calls).
Continue."
(Zentara Code uses debug_restart
, debug_set_breakpoint
, debug_continue
)
e. Step Through and Inspect (Focus on merge
):
When paused:
"Zentara, step into mergeSort
. Then, when execution reaches the merge
function, step through that line by line. Show me left
, right
, result
, leftIndex
, and rightIndex
."
(Zentara Code uses debug_step_in
, debug_next
within merge
, and variable inspection)
f. Diagnose the Bug:
This detailed inspection, especially of the merge
function's logic, will help identify the bug.
4. AI Debugging a TypeScript Script
This tutorial shows how to debug a TypeScript script directly using tsx
, which executes TypeScript code without a separate compilation step.
Scenario: You have insertion_sort_buggy.ts
with a faulty sorting algorithm.
a. Prepare Your Workspace:
- Ensure
testdata/insertion_sort_buggy.ts
is in your workspace.
- Make sure
tsx
is installed (npm install -g tsx
).
- (Optional) Create a copy to debug, e.g.,
testdata/insertion_sort_buggy.debug.ts
.
b. Initiate TypeScript Debugging:
"Zentara, start debugging testdata/insertion_sort_buggy.debug.ts
"
(Zentara Code will use debug_launch
with program: "testdata/insertion_sort_buggy.debug.ts"
and automatically use tsx
as the runtime for .ts
files)
c. Observe Initial Assertion Failures:
"Zentara, continue execution and report any assertion failures."
(Zentara Code uses debug_continue
)
d. Set Breakpoints & Investigate:
If an assertion for a test array fails:
"Zentara, restart debugging for testdata/insertion_sort_buggy.debug.ts
.
Set a breakpoint at the start of the insertionSort
function in testdata/insertion_sort_buggy.debug.ts
.
Set another where insertionSort
is called for the failing test case (within the script's test calls).
Continue."
(Zentara Code uses debug_restart
, debug_set_breakpoint
, debug_continue
)
e. Step Through and Inspect:
When paused:
"Zentara, step into insertionSort
. Step line by line, showing i
, j
, current
, and arr
."
(Zentara Code uses debug_step_in
, debug_next
, and variable inspection tools on the TypeScript code)
f. Diagnose the Bug:
By stepping through the TypeScript code and observing its runtime behavior, you can diagnose the issue.
Example Autonomous Debugging Prompts for Zentara Code
The Quick Tutorials above show a step-by-step, interactive debugging process. However, you can also instruct Zentara Code to debug more autonomously. Here are some example high-level prompts based on the scenarios in the testdata/
directory:
1. For General Python Script (testdata/quicksort_buggy.py
):
"Zentara, the script testdata/quicksort_buggy.py
is not working correctly. Please debug it using your runtime analysis tools. Identify any bugs, explain them, and then try to fix the script. After applying fixes, verify if the corrected script passes its internal assertions."
2. For Python with Pytest (testdata/test_quicksort_pytest.py
and testdata/quicksort_buggy.py
):
"Zentara, the pytest tests in testdata/test_quicksort_pytest.py
are failing when testing testdata/quicksort_buggy.py
. Please use your pytest debugging mode to investigate these failures. Pinpoint the bugs in testdata/quicksort_buggy.py
based on the test results and runtime analysis. Explain the bugs, then attempt to fix testdata/quicksort_buggy.py
and confirm if the tests pass."
(Remember to have Zentara Code create a copy like quicksort_buggy.debug.py
to modify, or instruct it to do so.)
3. For JavaScript Script (testdata/merge_sort_buggy.js
):
"Zentara, testdata/merge_sort_buggy.js
has a bug in its merge sort implementation. Please debug this script. Use your runtime debugging tools to find the issue, explain it clearly, and then try to correct the merge_sort_buggy.js
file. Verify your fix."
4. For TypeScript Script (testdata/insertion_sort_buggy.ts
):
"Zentara, the TypeScript script testdata/insertion_sort_buggy.ts
needs debugging. Please debug it directly using your runtime analysis tools for TypeScript. Identify any bugs in the insertion sort logic, explain them, and then try to fix the script. After applying fixes, verify if the corrected script passes its internal assertions."
These prompts give Zentara Code more leeway to decide on the specific debugging steps (breakpoints, stepping, inspection) needed to solve the problem.
5. For Java program (testdata/SimpleJava.java
):
"Zentara, set breakpoints in testdata/SimpleJava.java
and launch debugging session for it, go through each line step by step and check if everything is OK"
Zentara will check in launch.json if there is a launch config for java, if not, it will modify launch.json and then launch debugging session.
5. AI Debugging Using a launch.json
Configuration
This tutorial shows how to use a pre-defined configuration from your .vscode/launch.json
file.
Scenario: You have a launch.json
file with a configuration named "Run Extension".
a. Prepare Your Workspace:
- Ensure you have a
.vscode/launch.json
file with a configuration like this (an example is available in the .vscode
folder of the GitHub repository):
{
"version": "0.2.0",
"configurations": [
{
"name": "Run Extension",
"type": "extensionHost",
"request": "launch",
"args": [
"--extensionDevelopmentPath=${workspaceFolder}"
]
}
]
}
b. Initiate Debugging with a Configuration Name:
Instruct Zentara Code:
"Zentara, launch the debugger using the 'Run Extension' configuration."
(Zentara Code would use debug_launch
with configName: "Run Extension"
)
This approach is powerful for complex setups, as all the configuration details (program, args, environment variables) are managed in launch.json
, and you only need to refer to them by name. This is particularly useful for debugging VSCode extensions, as you can programmatically launch the Extension Host window and have the AI interact with and debug the extension in a live environment.
Python Debugging Setup (Important)
For Zentara Code to effectively debug Python projects, especially those using Conda environments or specific pytest
installations, ensure the correct Python interpreter is configured in your VS Code settings (.vscode/settings.json
):
{
"python.defaultInterpreterPath": "/path/to/your/conda/env/bin/python"
}
Replace /path/to/your/conda/env/bin/python
with the actual path to your Python interpreter.
Roadmap & Changelog
We're constantly evolving Zentara Code. Check out our issue tracker for our public roadmap and planned features. If you're looking to contribute, good first issue
labels are a great place to start!
Contributing
Zentara Code thrives on community involvement! We welcome contributions of all kinds.
Follow Us
Follow us on Twitter: @ZentaraCode
License
Zentara Code is licensed under the Apache License 2.0.
© 2025 ZentarAI
This project is a fork of ZentaraCodeInc/Zentara-Code). We gratefully acknowledge all contributions made to the original project.