GuardTrace — Security & Risk Analyzer
GuardTrace scans your code as you write it and flags common security risks directly in the editor — no separate CLI, no CI wait.
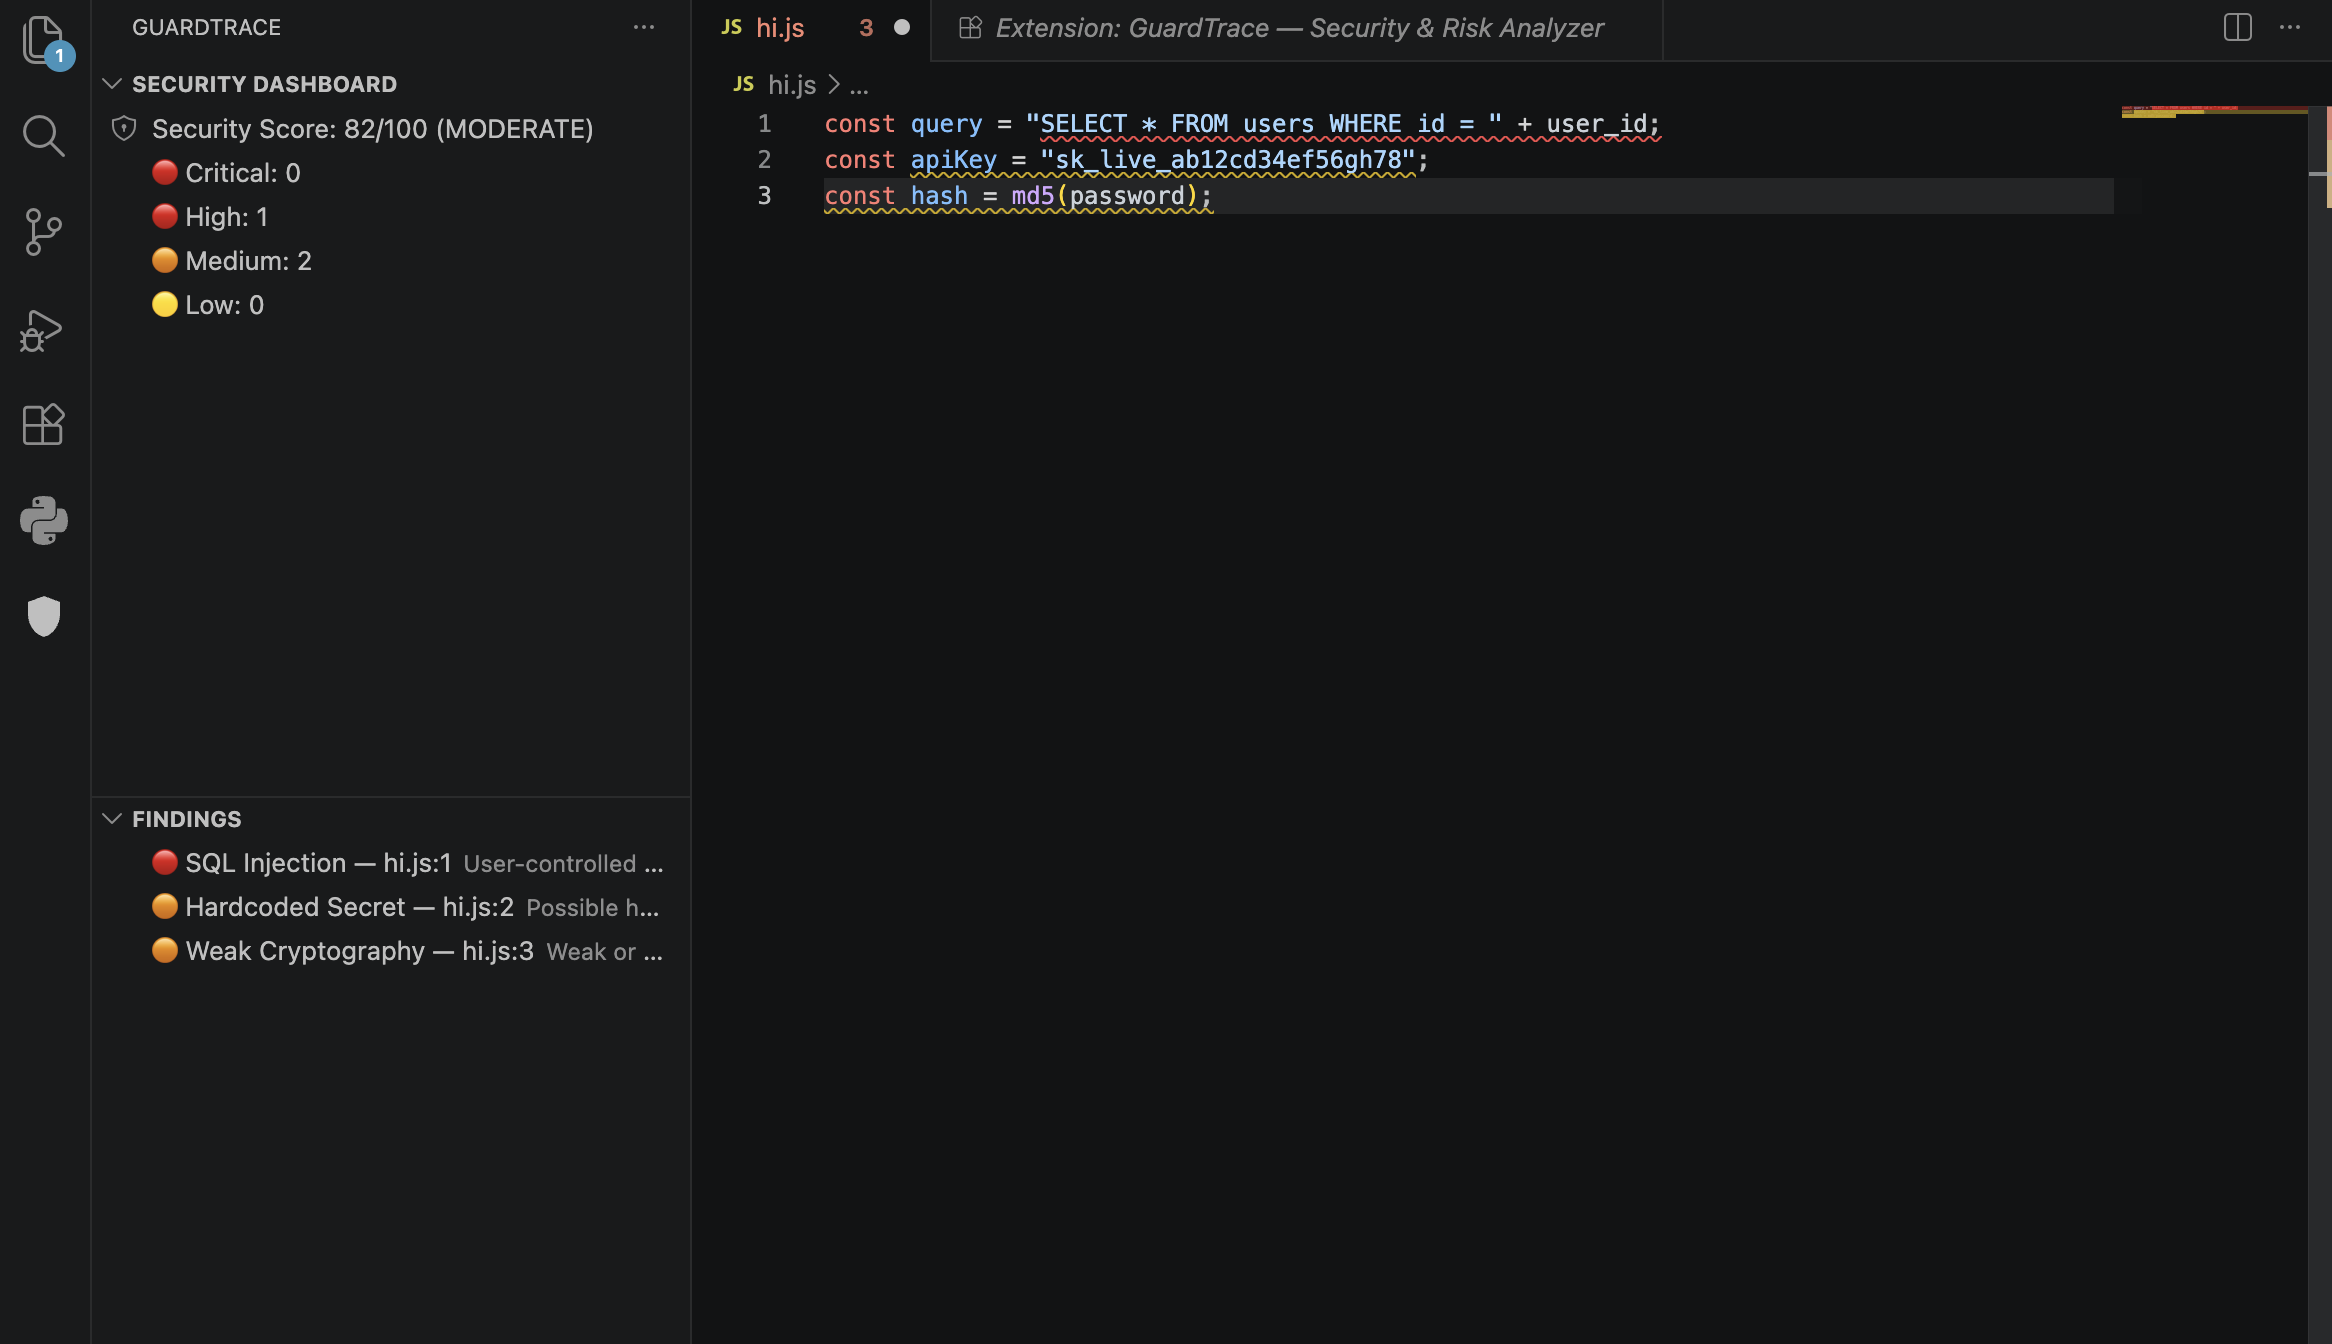
Detections (v0.1)
| Severity |
Rule |
| 🔴 High |
SQL Injection |
| 🔴 High |
Command Injection |
| 🔴 High |
Insecure Deserialization |
| 🟠 Medium |
Hardcoded Secrets |
| 🟠 Medium |
Weak Cryptography (MD5/SHA1/DES/RC4) |
| 🟡 Low |
Insecure HTTP Endpoints |
| 🟡 Low |
Path Traversal |
| 🟡 Low |
Weak Randomness for security tokens |
Features
- Inline diagnostics — findings underline the exact line, with severity and an explanation.
- Quick fixes — lightbulb menu to view an explanation or ignore a specific finding.
- Security Dashboard — sidebar view with a 0–100 security score and a breakdown by severity.
- Findings view — every open finding, click to jump to it.
- Security reports — generate a plain-text summary with recommendations.
- Works across JS/TS, Python, Java, Go, Ruby, PHP.
Installation
- Open Visual Studio Code.
- Go to the Extensions view (
Ctrl+Shift+X / Cmd+Shift+X).
- Search for "GuardTrace".
- Click Install.
GuardTrace activates automatically — no setup required. It starts scanning open files immediately.
Usage
All commands are run from the Command Palette (Ctrl+Shift+P / Cmd+Shift+P), then type the command name.
Scan Current File
Re-scans the file you're currently editing.
- Open the file.
- Run
GuardTrace: Scan Current File.
(This also happens automatically on every save — this command is for a manual re-check without saving.)
Scan Workspace
Scans every supported file in the open folder.
- Run
GuardTrace: Scan Workspace.
- A progress notification shows scan status; a summary appears when it finishes.
Generate Security Report
Produces a plain-text report with a security score and prioritized recommendations.
- Run
GuardTrace: Generate Security Report (after scanning at least once).
- The report opens in a new editor tab — copy, save, or share it as needed.
View a finding / dismiss a false positive
- Click the 💡 lightbulb on any underlined line.
- Choose View Explanation to see the full reasoning, or Ignore This Finding to suppress that specific line going forward.
Click the shield icon in the Activity Bar to open:
- Security Dashboard — overall score (0–100) and counts by severity.
- Findings — every open finding across the workspace; click one to jump straight to it.
Configuration
| Setting |
Default |
Description |
guardtrace.enabledRules |
all 8 rules |
Array of rule IDs to run (e.g. "sql-injection", "hardcoded-secret"). Remove an ID to disable that rule. |
guardtrace.ignoredFindings |
[] |
Fingerprints of findings you've dismissed via "Ignore This Finding". Managed automatically — edit only if you want to un-ignore something manually. |
Set these in your VS Code settings.json, or via Settings UI under "GuardTrace".
Notes
GuardTrace uses fast pattern-based detection rather than full data-flow analysis, so treat findings as a first pass, not a substitute for a full SAST tool or manual review. False positives can be dismissed via the lightbulb menu ("Ignore This Finding").
Contributing
Contributions are welcome — bug reports, new rules, or false-positive fixes.
- Fork the repository.
- Create your feature branch (
git checkout -b feature/your-feature).
- Commit your changes (
git commit -am 'Add some feature').
- Push to the branch (
git push origin feature/your-feature).
- Open a pull request.
Release Notes
0.1.0
Initial release: 8 rules, diagnostics, sidebar dashboard, quick fixes, report generation.

