.NET Dependency Explorer
Understand who uses a .NET project, what it depends on, and where project-reference cycles appear.
Explore .csproj references in an interactive graph or matrix, directly inside VS Code. Analysis runs locally without Python, ripgrep, a .NET build or an external service.
Features
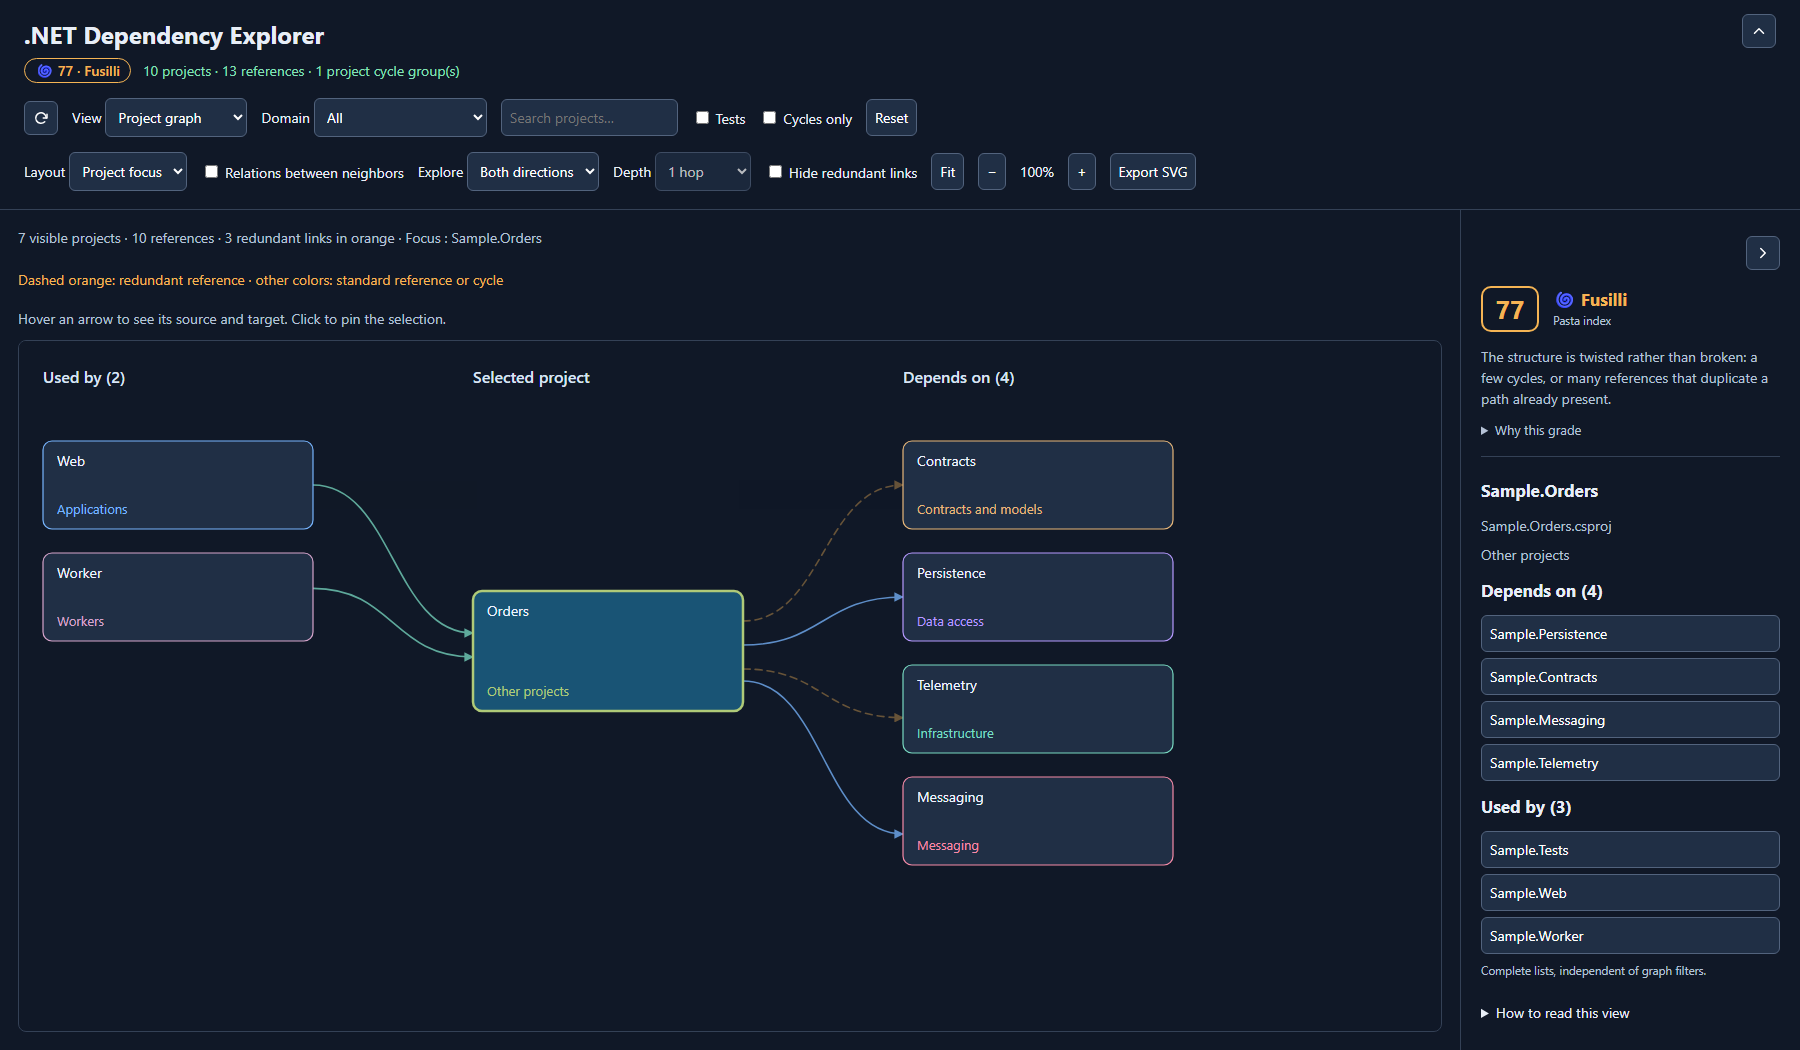
- Project focus: users on the left, the selected project in the middle, dependencies on the right.
- Domain overview: group projects with configurable keyword rules.
- Global graph: explore by level, direction and depth.
- Dependency matrix: read references without overlapping arrows.
- Cytoscape graph: the same filtered graph on canvas, with levels, force-directed, breadth-first, concentric, circle and grid layouts.
- Cycle detection: highlight actual cycles between projects in red.
- Redundant references: dashed orange lines show direct references with another path in the filtered graph. They are still real references; the extension does not suggest deleting them automatically.
- Interactive inspection: hover connections, pin an edge, and reveal relationships between neighbors.
- Editor integration: open a selected
.csproj, refresh automatically after project changes, and export SVG or PNG.
- Saved view: retain the selected project, filters, zoom and scroll position per workspace.
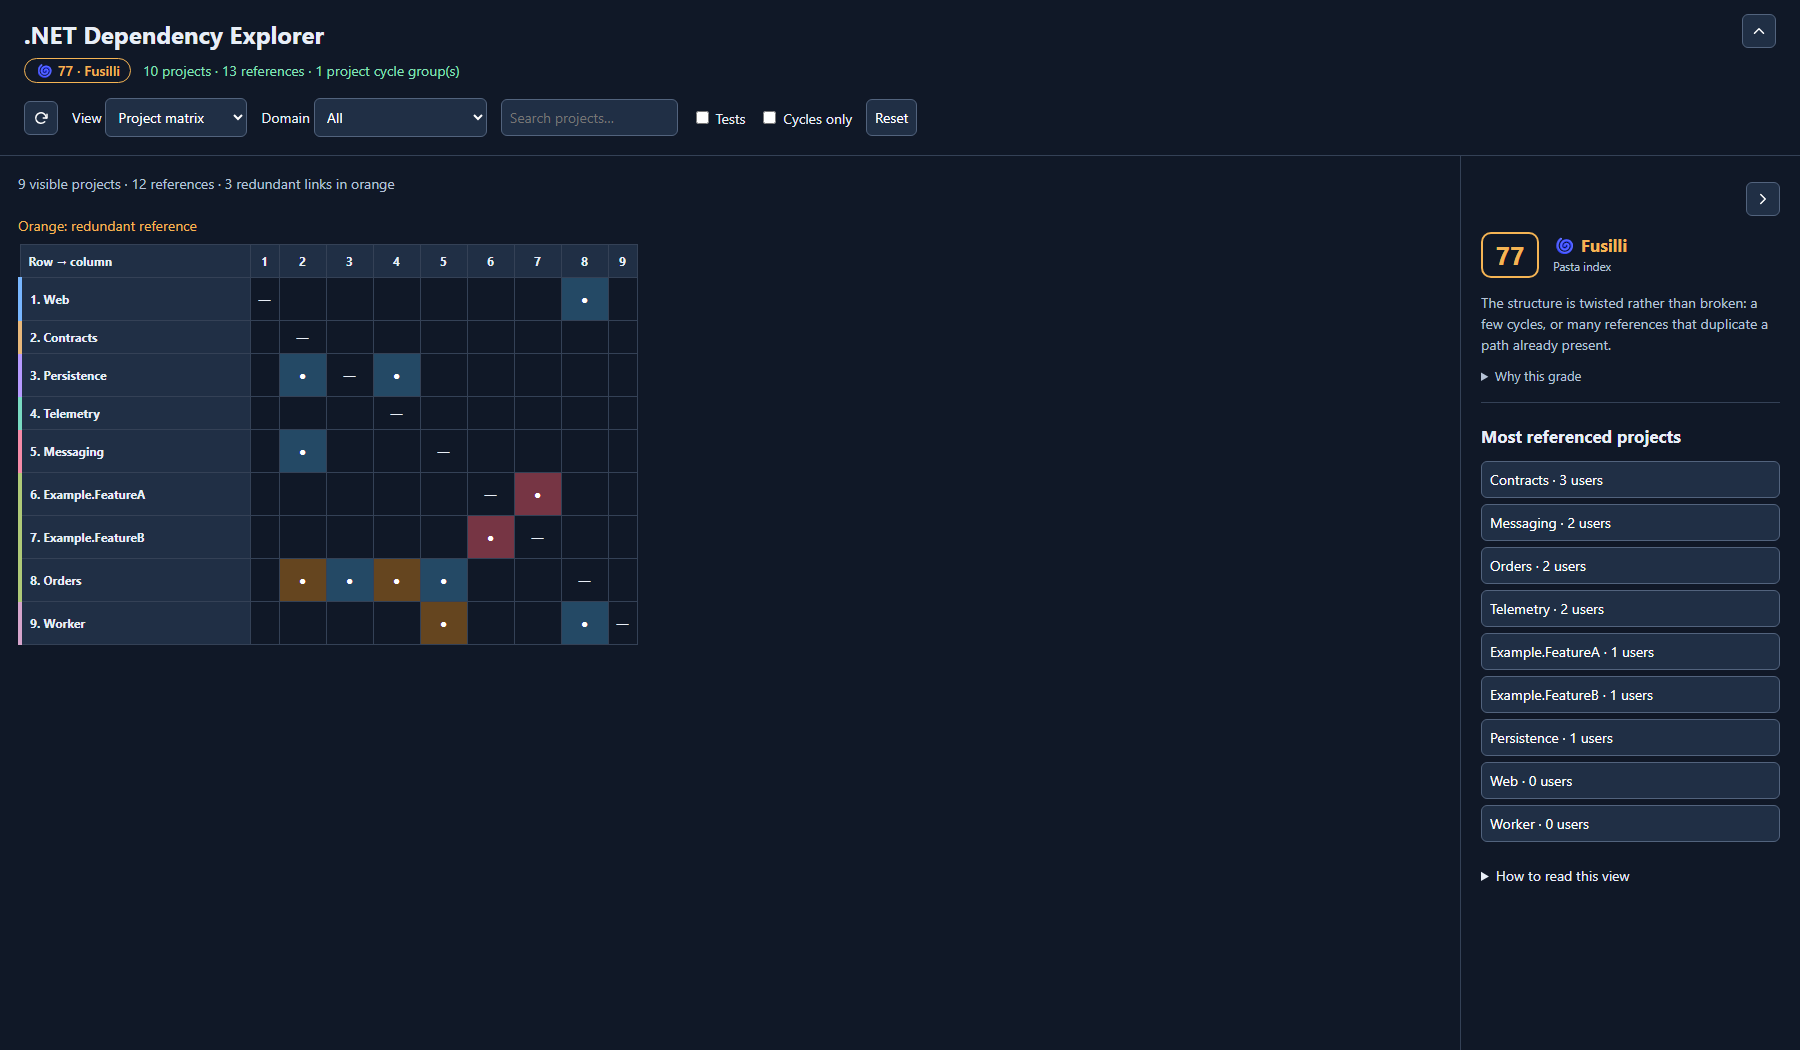
Screenshots use fictional projects. No application code or dependency data is bundled with the extension.
Get started
- Install the extension and open a folder containing
.csproj files.
- Click the .NET Dependencies icon in the Activity Bar and choose Open dependency graph, or run .NET Dependency Explorer: Show Project Dependencies from the Command Palette, or right-click a
.csproj in Explorer.
- Select a project, then use Open .csproj to open its definition alongside the graph.
For a locally downloaded VSIX, run Extensions: Install from VSIX... first.
The circular-arrow Refresh button at the start of the toolbar rescans project references while preserving your current view.
The chevron at the top right collapses the three toolbars into a single status line and gives their height back to the graph. A second chevron, at the top of the details panel, folds that panel down to a rail. Both choices are kept with the rest of the view.
Drag the graph background with the left mouse button to pan. The middle mouse button also works over cards. Fit resets the offset; refresh preserves it.
The - / + controls zoom from 15% to 300%; Fit fits the graph width. Selecting a new project opens it at 100%. Use Relations between neighbors to show secondary links in project focus. Clicking a connection pins it; Clear edge selection or Escape clears it.
Pasta index
The header carries a score from 0 to 100 and the shape your references actually form. The side panel explains where the points went, and the whole block is computed on the workspace: no view filter can move it, and test projects are excluded so a test suite never changes the grade.
Three properties cost points, because fixing any of them is unambiguously an improvement:
- Cycles, weighted by how many projects sit in one and how large the largest is. A cycle of six is structural whether the solution holds ten projects or a thousand.
- Propagation cost: the share of the solution an average change can reach, through the transitive closure of the references. The first slice is free, since a project normally depends on a handful of others and a small solution cannot do better.
- Redundant references: a reference to a project another path already reaches.
Depth, modularity and the most-referenced project describe the shape without costing points, because none of them is a defect on its own.
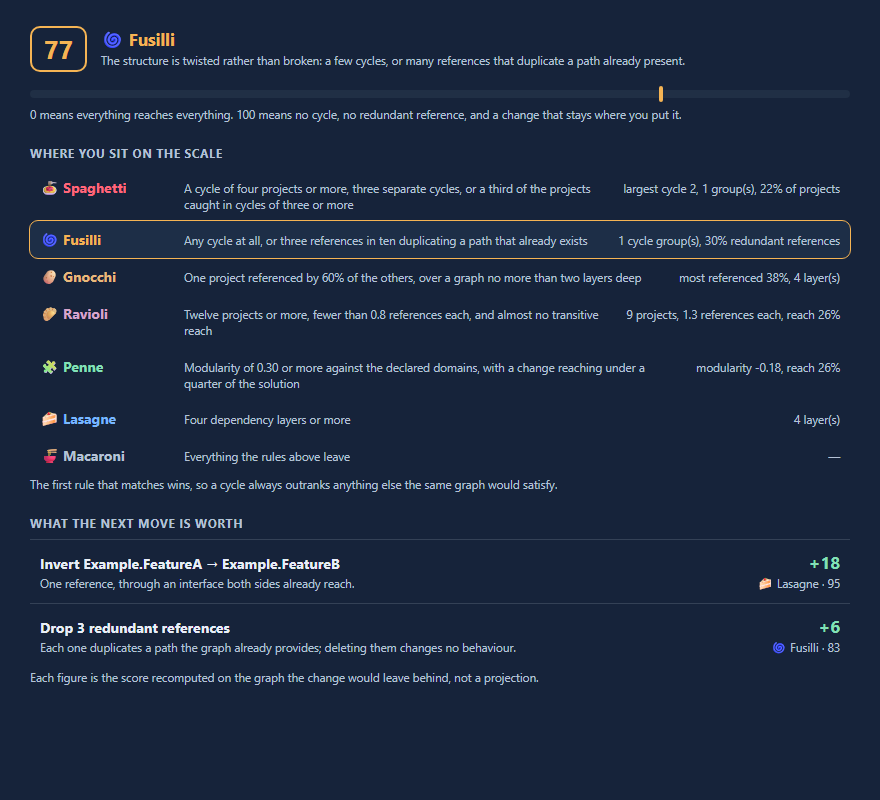
Click the index, in the header or in the side panel, to open the scale. It lists every shape with the rule behind it and what your graph measures against that rule, so you can see why you landed where you did and what separates you from the next rung. Below it, the moves that would change the grade are priced by recomputing the index on the graph the change would leave behind: breaking a given cycle, inverting every cycle at once, or dropping the redundant references. The figures are results, not projections. Solutions above 400 projects skip the pricing.
| Shape |
What it means |
| 🍝 Spaghetti |
Cycles run through the structure: a group of four or more, three separate groups, or a large share of the projects |
| 🌀 Fusilli |
Twisted rather than broken: an isolated cycle, or many references duplicating an existing path |
| 🥔 Gnocchi |
One project carries almost everything; the graph is a hub with satellites |
| 🥟 Ravioli |
Many small projects, barely connected. The project count is the problem, not the coupling |
| 🧩 Penne |
Real modules with thin connections. A change stays inside its tube |
| 🍰 Lasagne |
Clean layers, no cycles, but a change travels down through all of them |
| 🍜 Macaroni |
Ordinary: nothing pathological and no strong signal either |
The index measures coupling between assemblies. Two projects with no reference between them can still be coupled through dependency injection, reflection, a shared database or HTTP, and a layering violation between two folders of the same project is invisible here. A solution of fewer than three production projects is not graded at all.
Cytoscape graph
Choose Cytoscape graph in the View menu. Domain, search, tests, cycles, direction, depth and Hide redundant links apply exactly as in the project graph; only the renderer changes.
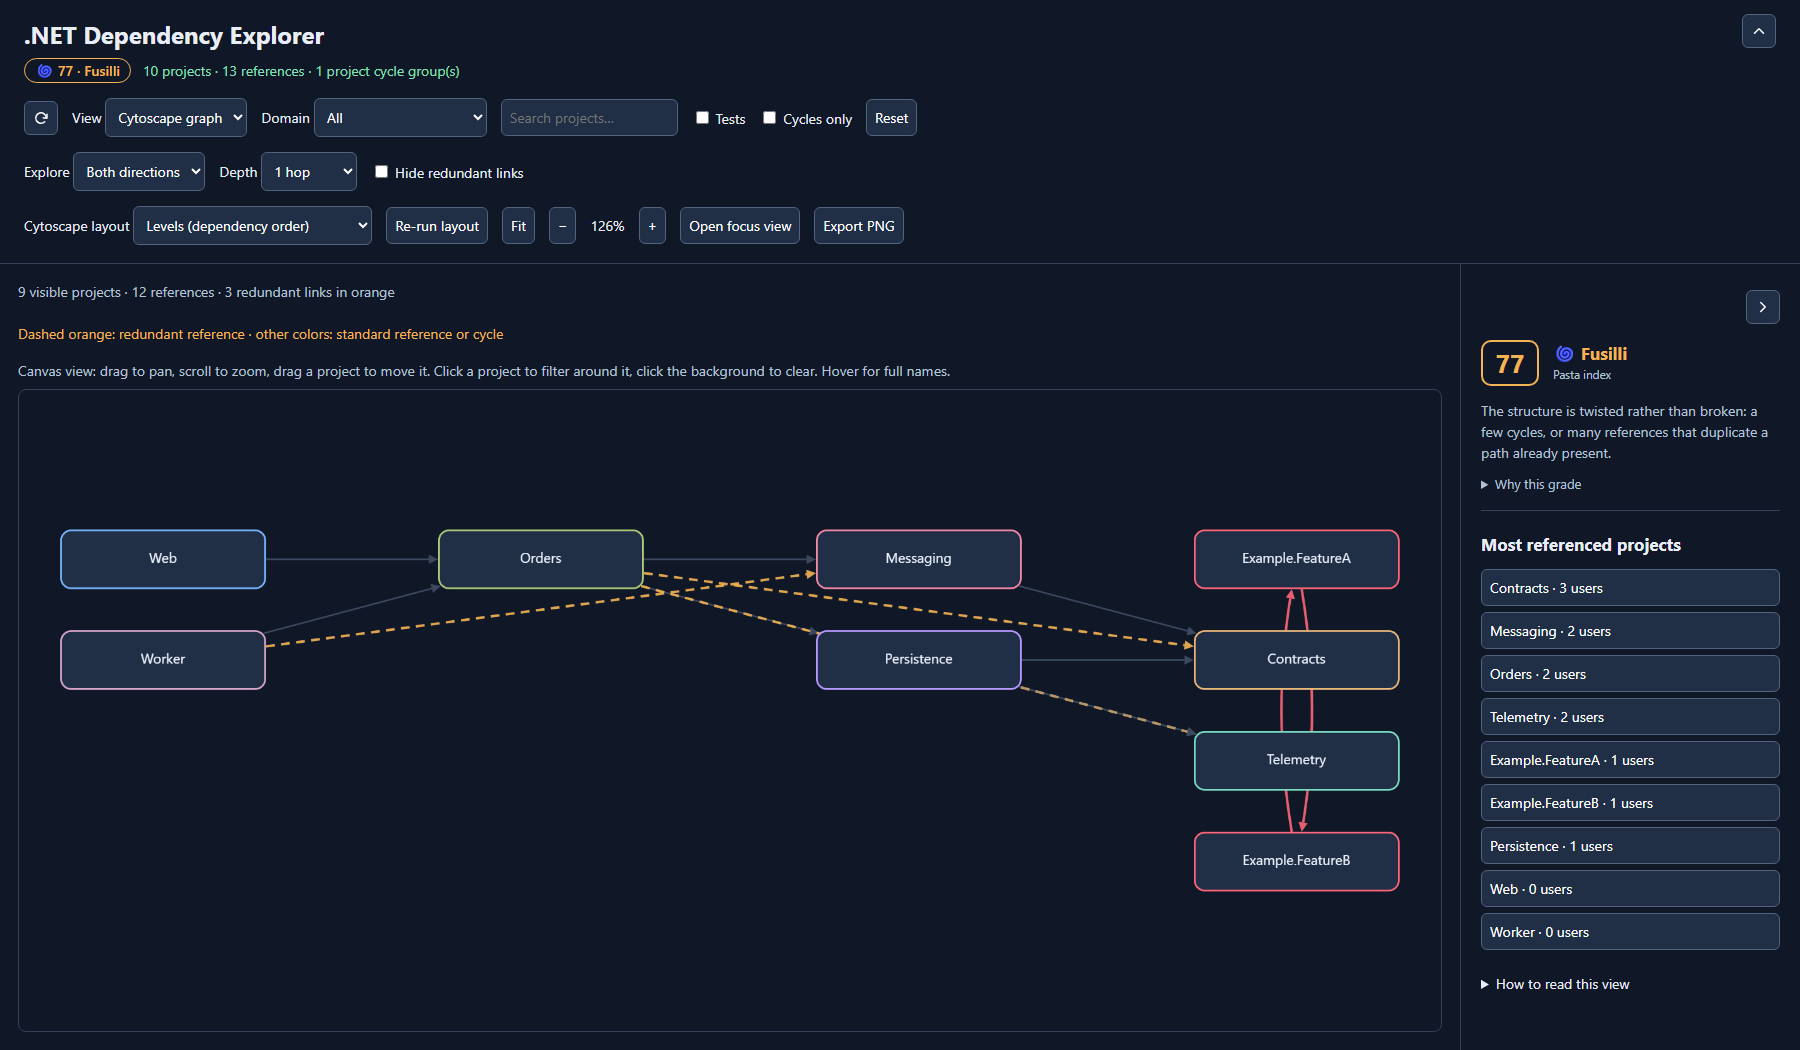
- Pick a layout: Levels follows dependency order, Force-directed spreads projects apart, Breadth-first starts from the selected project, Concentric puts the most referenced projects in the middle, Circle and Grid are fixed arrangements. Each entry in the menu carries a tooltip describing what it shows, as do the buttons next to it.
- Drag to pan, scroll to zoom, drag a project to move it. The - / + buttons zoom around the middle of the viewport, Fit reframes the graph and Re-run layout recomputes it.
- Clicking a project filters around it without leaving the view; clicking the background clears the selection. Open focus view switches to the three-column layout.
- Hovering a project or an arrow isolates its neighbourhood and shows the full name, domain, level, path and reference counts.
- Export PNG saves the whole graph through the VS Code save dialog, capped at 4096 px per side.
Long project names wrap over several lines, breaking after a dot or before a capital so no word is cut. Labels are still hard to read on a large graph fitted to the viewport: filter or zoom in, and rely on hover for full names.
Configuration
Configure domain grouping and optional label prefixes in VS Code settings. The first matching domain rule wins. Keywords are case-insensitive substrings; an empty rule list disables automatic grouping.
{
  "dotnetDependencyExplorer.domainRules": [
    { "domain": "Orders", "keywords": ["orders", "checkout"] },
    { "domain": "Infrastructure", "keywords": ["logging", "telemetry"] }
  ],
  "dotnetDependencyExplorer.labelPrefixes": ["MyCompany."]
}
Full project names remain available in tooltips and details.
Analysis scope
The extension reads declared ProjectReference items in .csproj files across all open workspace folders. It excludes bin, obj, .git, .vs, node_modules and packages directories. Missing files, references outside the open workspace and unresolved expressions are reported.
MSBuild conditions and imported .props/.targets files are not evaluated. Conditional references are included as declarations. This is not analysis of NuGet packages, classes, namespaces, dependency injection or runtime/network calls. Workspace code is never executed by the analyzer.
Privacy
The extension does not send project names, source files or dependency graphs to an external service. It reads project files locally and stores view preferences through VS Code workspace state. An SVG is written only when you explicitly export it.
Development
Use Node.js 22 or later.
npm ci
npm test
npm run check
npm run demo
The analyzer and extension host are TypeScript in src/. The framework-free English webview is in media/, with the bundled Cytoscape build in media/vendor/. See PUBLISHING.md in the source repository for release preparation.
Feedback and license
Report a bug or request a feature.
MIT licensed. Bundled dependencies retain their respective licenses in THIRD_PARTY_NOTICES.txt.

