QoEtient Extension for Visual Studio CodeA Visual Studio Code extension which helps QoEtient automation script developers to create, modify & debug test scripts in Python language. The extension features an integrated DUT View, a real-time test execution log view, real-time videos of DUTs, soft touch control for android devices and toolbar buttons for running scripts under the QoEtient framework.Supported VSCode version v1.55.2. 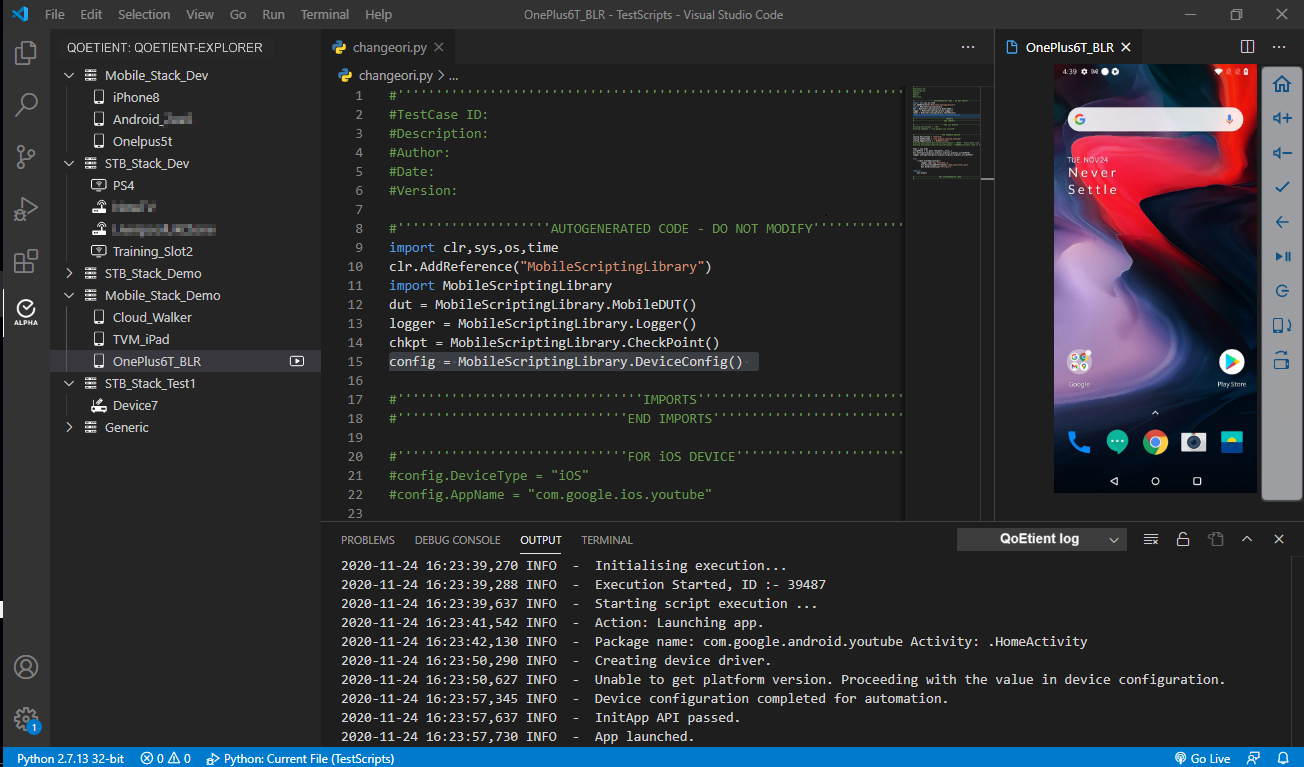
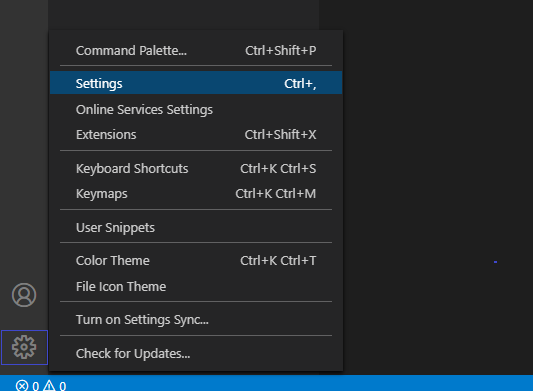
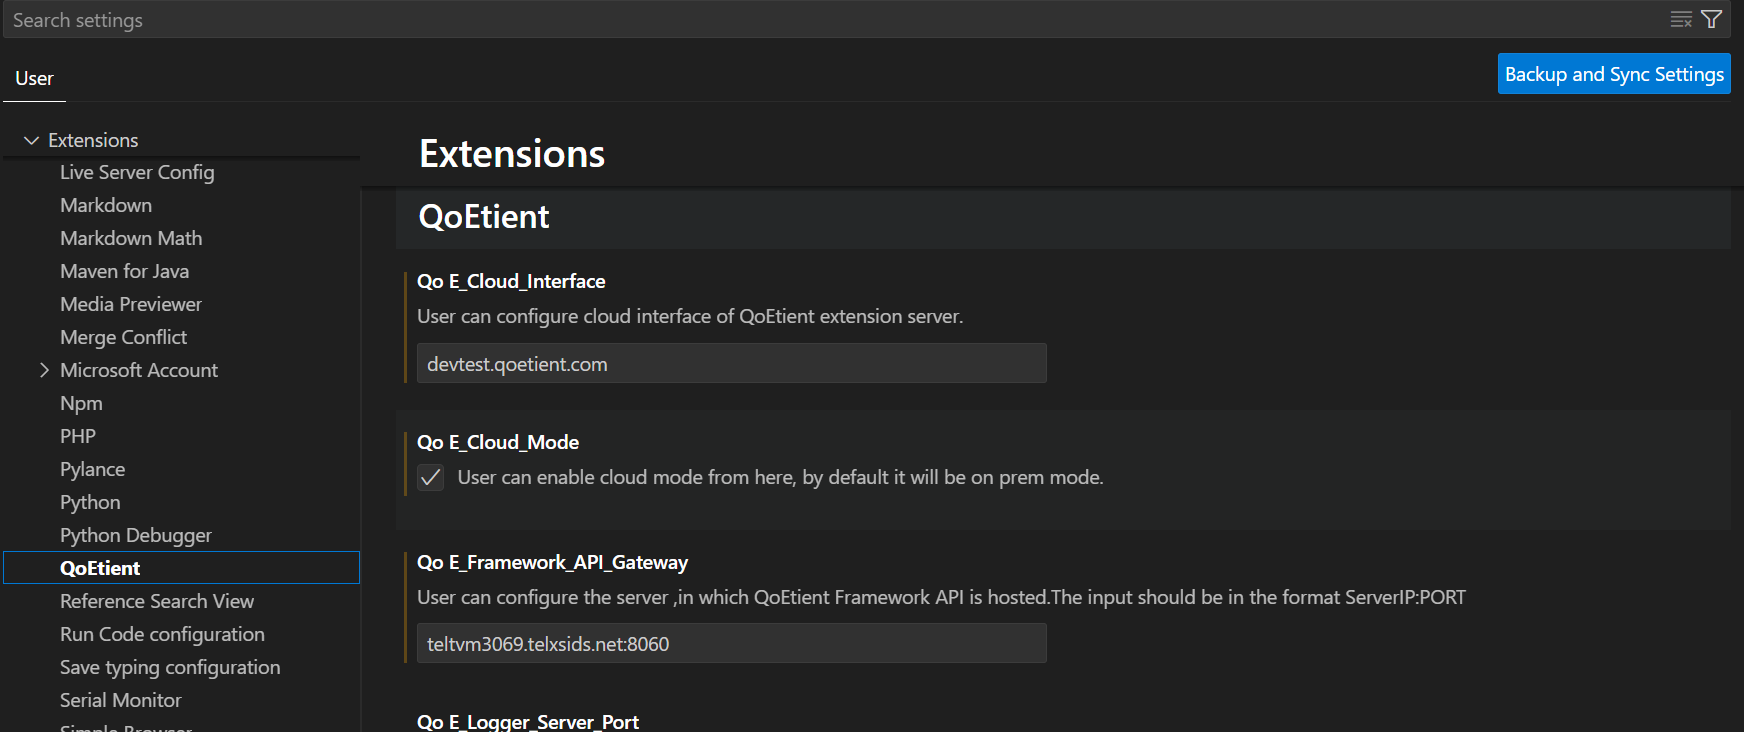
ImportantThis extension will only work if you have access to a QoEtient test automation system. For the features in this extension to work, you must login using your QoEtient credentials from this extension. For more information on video test automation & QoE measurement using QoEtient, contact falcon@tataelxsi.com How to configure the extension for first use
Login to QoEtient
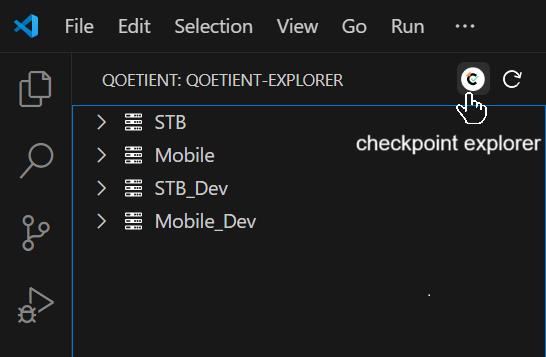
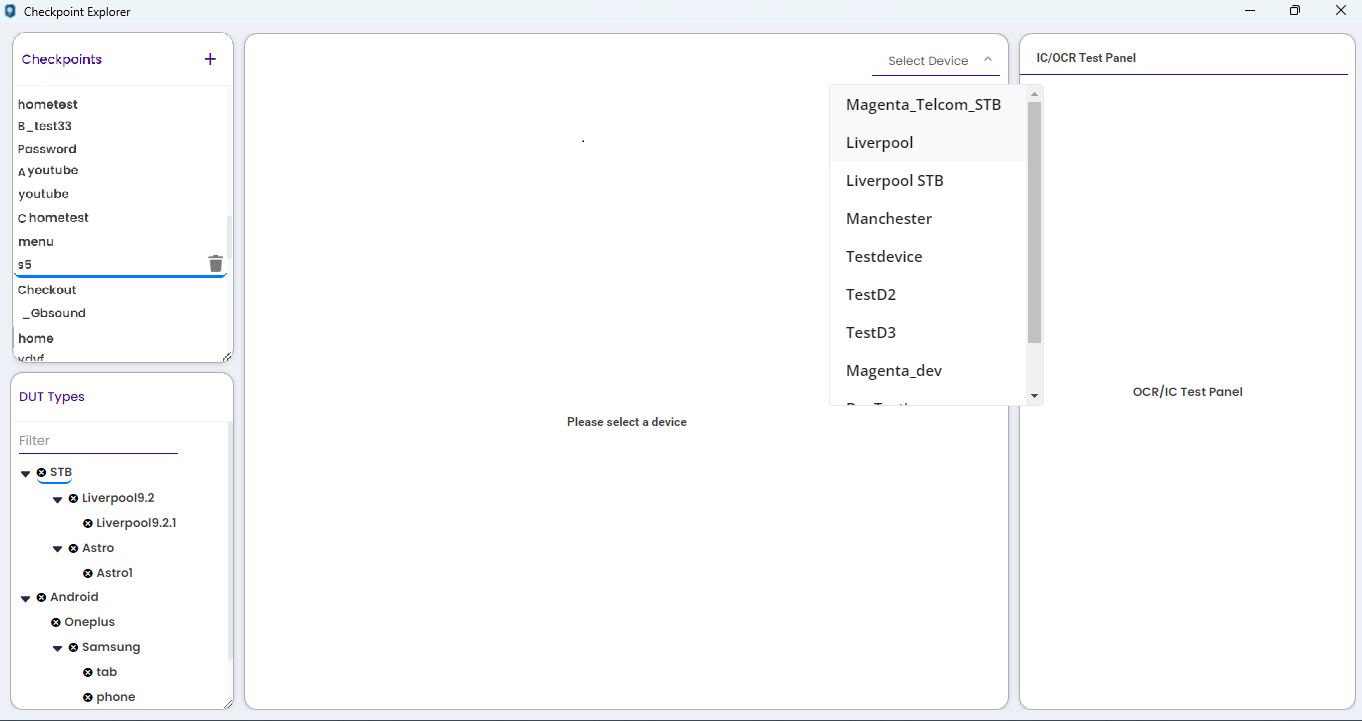
Main UI Components of the ExtensionCheckpoint ExplorerOn clicking the checkpoint explorer icon, the checkpoint explorer will be launched in a new window.
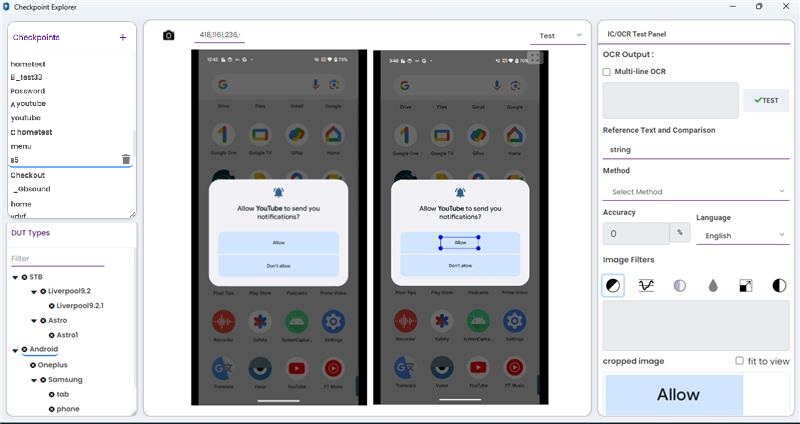
The explorer will display a list of available checkpoints. Users can scroll through the display and use the search function. When a checkpoint is clicked, the corresponding DUT type will be automatically selected, and the user will need to choose the device from the dropdown menu. After that, the stream will become available.
To add a new checkpoint, use the plus button provided in the view. Users can click the quick capture icon to capture an image, and details of the captured image will be shown on the IC/OCR panel. Annotations and filters can be applied to the newly created checkpoint.
DUT ViewThe DUT view will show all the DUTs that are locked under your user log-in. If you need a DUT to appear here, you should lock it in QoEtient client application. 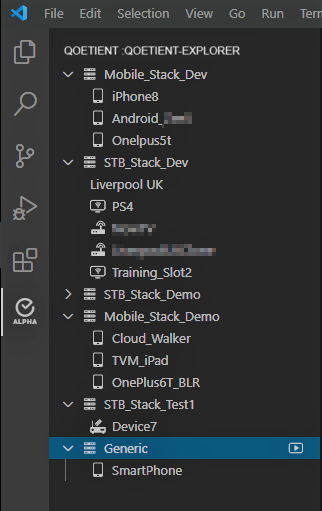
Upon clicking on a DUT, you will be able to see a Play icon on that item. Click on this icon to open up a video page that will show the real-time video from that DUT. You may rearrange The video page to suit your layout preferences within the Visual Studio Code's window. QoEtient Log ViewTo open QoEtient execution logs view, click on "View" menu of Visual Studio Code, and select "Output" (Or press Ctrl + Shift + U). This will open up the output pane at the bottom. On the dropdown at the top right on this pane, select QoEtient Log. The output pane is now ready to start showing real-time log of the test execution. 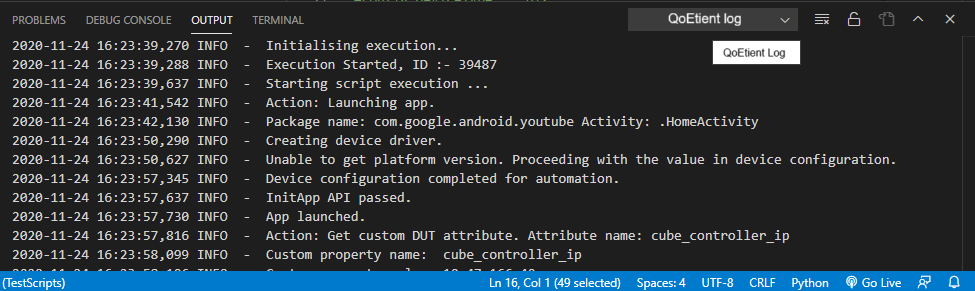
QoEtient Run/Debug OptionThese Options will appear along with the usual Run icon that appears on the top toolbar when you open up a Python file in Visual Studio Code editor. These are the options a user should use to start running or debugging a QoEtient test script. The regular "Run Python File in Terminal" option should not be used, as it will start the Python script without the necessary command-line arguments for the test script. 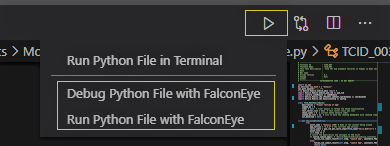
Android Mobile Device Soft Touch ControlUser is now capable of remotly accessing android mobile device from DUT video panel.User can control actions such as swipe,tap,home,volume up,volume down,power,orientation change and rebooting device.Change in orientation functionality works according to the behaiour of device or application. 
How to run or debug a QoEtient test script in Visual Studio Code
Open a test script. Select the device from the DUT view Follow the same process to start debugging a script, however you should click on "Debug with QoEtient" instead of "Run with QoEtient" button. While a script is under the debugger, you will be able to use breakpoints and other standard debugger features such as step through, step inside, step outside and so on. Read python extension's readme section for getting yourself familiarized on how to use debugging features in Visual Studio Code. QoEtient supports python versions -python 2.7 and python 3.7. Appropriate python environment can be selected from the " Select Interpreter" option as shown below. You can either select an environment required for execution shown in list or manually provide the python executable path by selecting "Enter interpreter path..." 
Code Snippets for QoEtient Test APIs
Limitations
Happy scripting! |
 , and then click on "Run with QoEtient" toolbar button. This will start the script after passing all the required command line arguments automatically. This involves the DUT identifiers and other data required by the QoEtient framework to properly run a test script.