Azure Service Intelli Debugger
Version 1.0.5 | Publisher: SoubhikDevTools | VS Code ≥ 1.85.0
What Is This Extension?
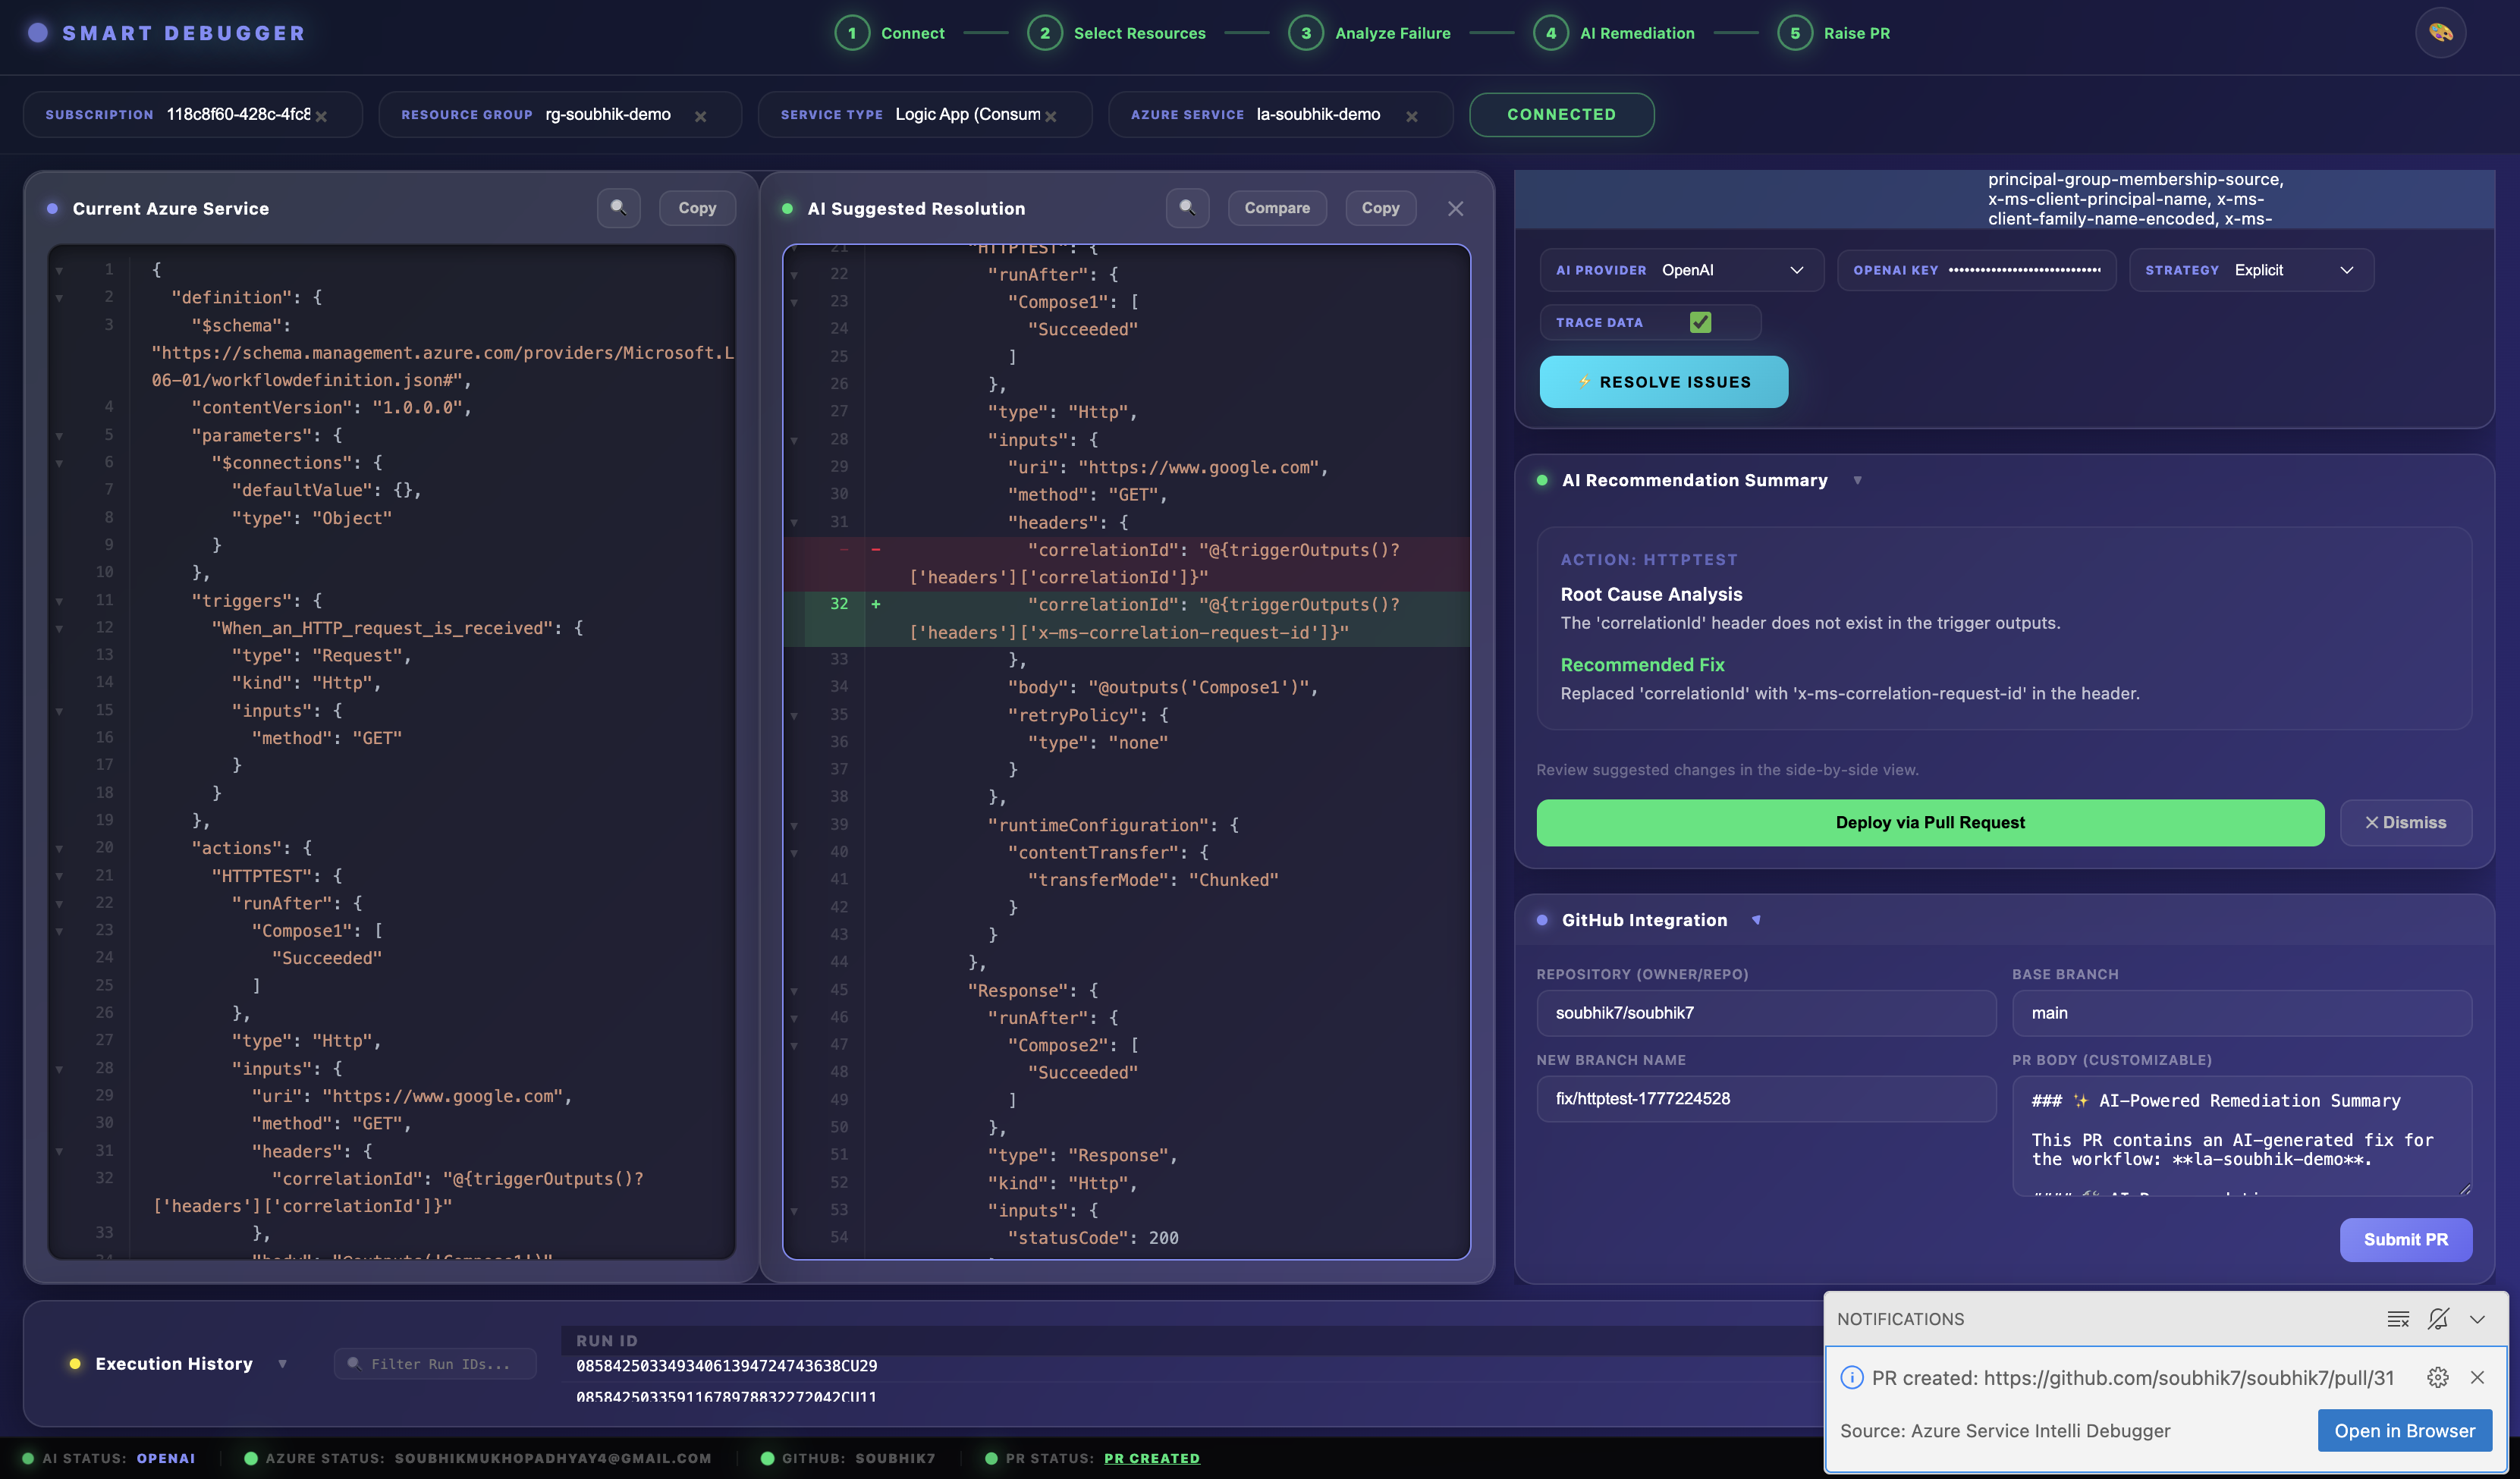
Azure Service Intelli Debugger is an enterprise-grade observability and autonomous self-healing platform built directly into VS Code. It monitors Azure Logic Apps (Standard and Consumption) and Azure Data Factory (ADF) pipelines, performs AI-driven root cause analysis on failures, and automates remediation through a human-reviewed GitHub Pull Request — with zero untrusted code ever touching production.
Where traditional debugging means manually scouring Azure Portal logs, this extension brings the entire failure-to-fix lifecycle into your editor: connect to Azure, see what broke, understand why it broke (using AI), review the proposed fix as a diff, and ship it as a PR — without leaving VS Code.
What Is the Impact?
The platform shifts your team from reactive troubleshooting to proactive self-healing.
For Developers
- Automated Root Cause Analysis: Reduces the time spent manually scouring logs by providing instant, AI-generated insights into failure points.
- Integrated Remediation: Generates fix suggestions and automated Pull Requests directly from the debugging dashboard — no context-switching to GitHub.
- Local AI Privacy: Use Ollama or the Isolated Custom AI engine so sensitive workflow definitions never leave your local environment.
For Support Teams
- Reduced Escalations: Empowers Tier 1 and Tier 2 support to resolve complex infrastructure issues using AI-guided remediation steps without waiting for senior engineers.
- Unified Visibility: A single pane of glass for monitoring multiple Azure services across different subscriptions and resource groups.
- Self-Healing Workflows: Minimises downtime by automating the analysis and fix cycle for recurring failure patterns.
Closed-Loop Debugging Ecosystem (Phase 1 + Phase 2 Together)
When the Isolated Custom AI companion extension is installed alongside this debugger, the full loop becomes:
- Detection — The Intelli Debugger identifies a failure in a Logic App or ADF pipeline.
- Analysis — The Custom Isolated Model analyses the failure pattern using its locally trained weights from your own organisation's historical data.
- Remediation — A specific fix is proposed based on historical success patterns from your own environment — more accurate than a general-purpose LLM.
- Validation — The fix is reviewed, merged, and the outcome is fed back into the model for continuous improvement.
This approach ensures debugging is faster, smarter, and more secure.
Quick Start
Get up and running in under 5 minutes.
Step 1 — Install the extension
Open the Extensions panel (Cmd+Shift+X / Ctrl+Shift+X), search for Azure Service Intelli Debugger, and click Install.
Step 2 — Add an AI provider key (Optional)
Open Settings (Cmd+, / Ctrl+,), search Smart Logic App, and enter either:
smartLogicApp.googleApiKey — your Google Gemini API key, ORsmartLogicApp.openaiApiKey — your OpenAI API key, OR- Set
smartLogicApp.defaultProvider to ollama for local-only AI (no key needed)
Step 3 — Open the Dashboard
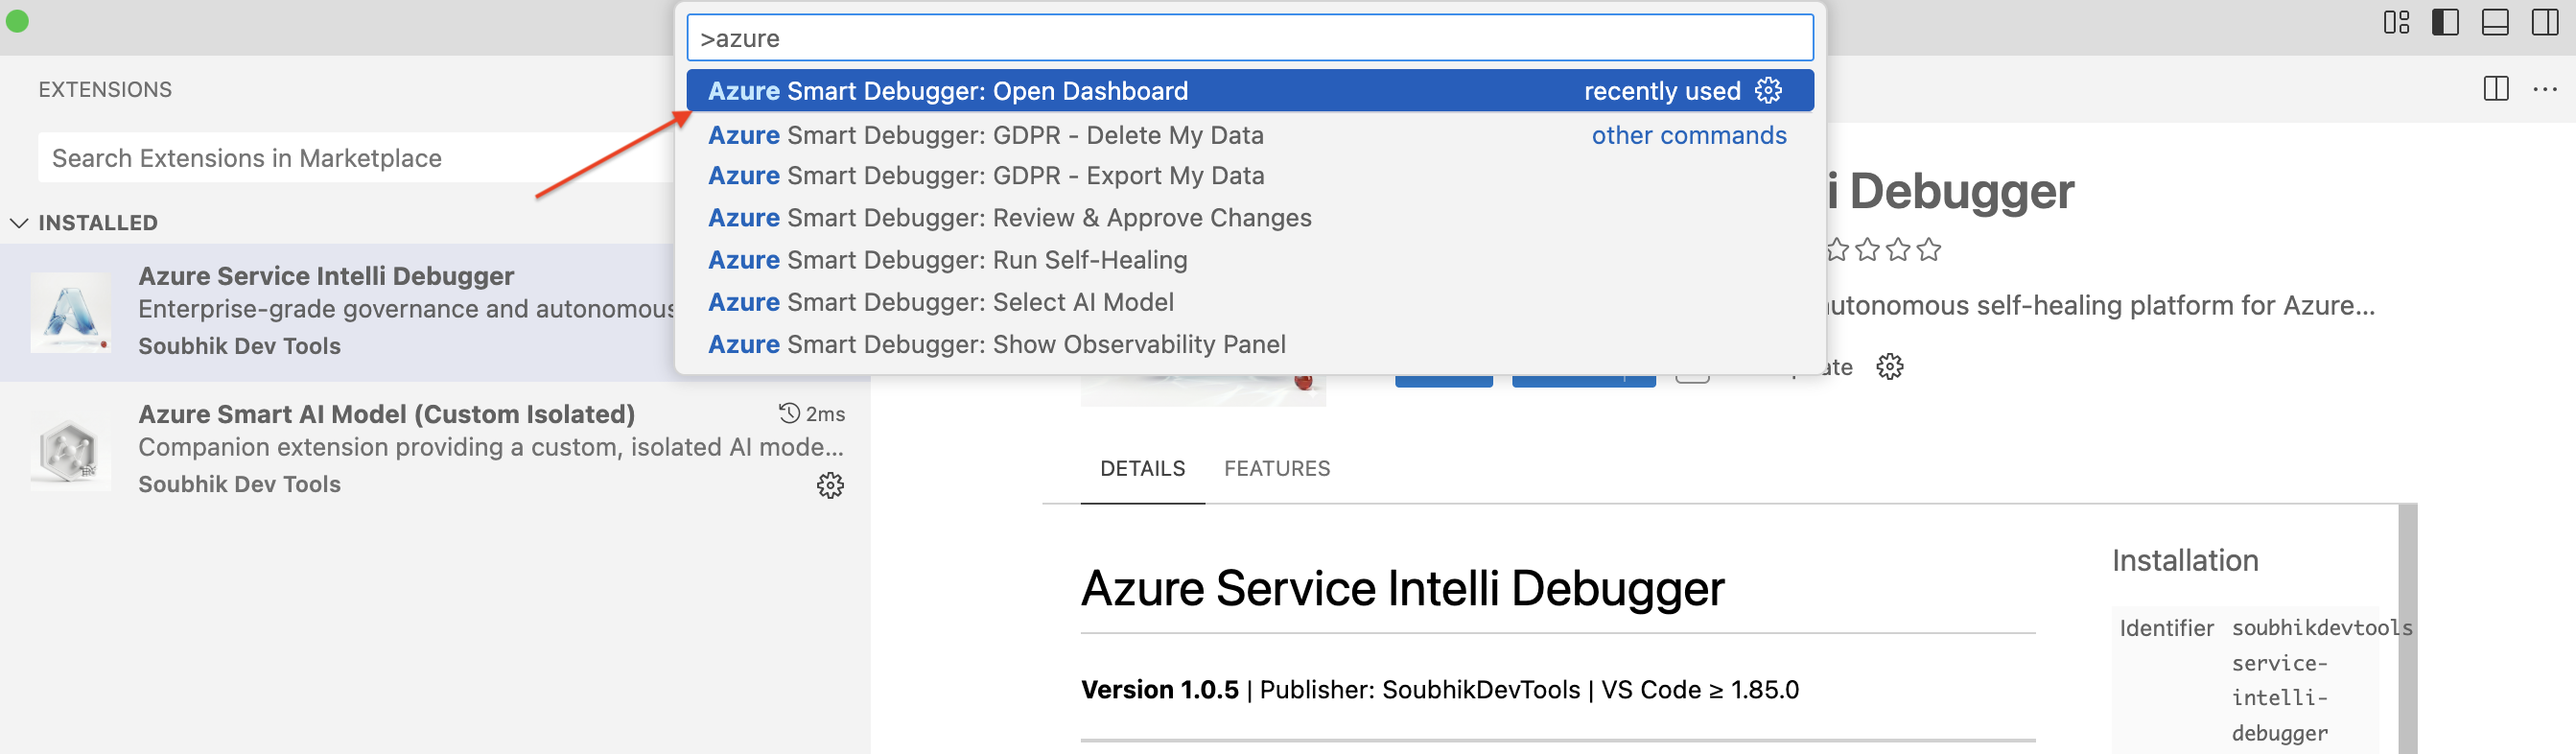
Press Cmd+Shift+P / Ctrl+Shift+P, type Azure Smart Debugger: Open Dashboard, and press Enter.
Step 4 — Connect to Azure
Click Connect in the dashboard. A browser window opens for OAuth2 login — enter the displayed device code and sign in with your Microsoft account.
Step 5 — Select your resource and run analysis
Choose Subscription → Resource Group → Logic App or ADF Pipeline → click Fetch Runs → click a failed run → click Run Self-Healing.
Step 6 — Review the diff and raise a PR
Click Show Diff, review the AI-proposed fix, then click Raise Pull Request.
That's it. You now have an AI-generated fix queued for review in GitHub — without leaving VS Code.

Table of Contents
- Requirements
- Installation
- Initial Setup: Connecting Your Services
- Full Workflow: From Failure to Pull Request
- Step 1 – Authenticate with Azure
- Step 2 – Discover Resources
- Step 3 – Monitor Run History
- Step 4 – Inspect Failure Insights
- Step 5 – Run AI Self-Healing
- Step 6 – Review the Diff
- Step 7 – Raise a Pull Request
- AI Providers In Detail
- Dashboard Themes
- All Commands Reference
- All Settings Reference
- GDPR & Privacy Controls
- Security Architecture (Read Before You Connect)
- Feature Phases
- Future Scope
- Troubleshooting
1. Requirements
| Requirement |
Details |
| VS Code |
1.85.0 or later |
| Azure Account |
Reader or Contributor access to target subscriptions |
| AI Provider |
At least one: Google Gemini API key, OpenAI API key, or local Ollama install |
| GitHub (optional) |
Required only to raise Pull Requests |
| Internet |
Not required when using Ollama or Isolated AI in offline/air-gapped mode |
2. Installation
From the VS Code Marketplace:
- Open VS Code and press
Cmd+Shift+X (macOS) or Ctrl+Shift+X (Windows/Linux).
- Search for Azure Service Intelli Debugger.
- Click Install.
From a .vsix file:
code --install-extension azure-service-intelli-debugger-1.0.5.vsix
Once installed, you will see:
"Azure Service Intelli Debugger activated with unified AI providers."
The extension activates on first use of any command — it does not run background processes until explicitly invoked.

3. Initial Setup: Connecting Your Services
3.1 Open the Dashboard
All features live in the Unified Dashboard. Open it with any of these methods:
- Command Palette: Press
Cmd+Shift+P / Ctrl+Shift+P, type Azure Smart Debugger: Open Dashboard, press Enter.
- Status Bar: Click the AI provider indicator on the right side of the VS Code status bar (e.g.,
✓ AI: Gemini).
The dashboard opens in a VS Code webview panel beside your editor.
3.2 Connect to Azure
The extension uses OAuth2 Device Code Flow — your Azure password never enters VS Code.
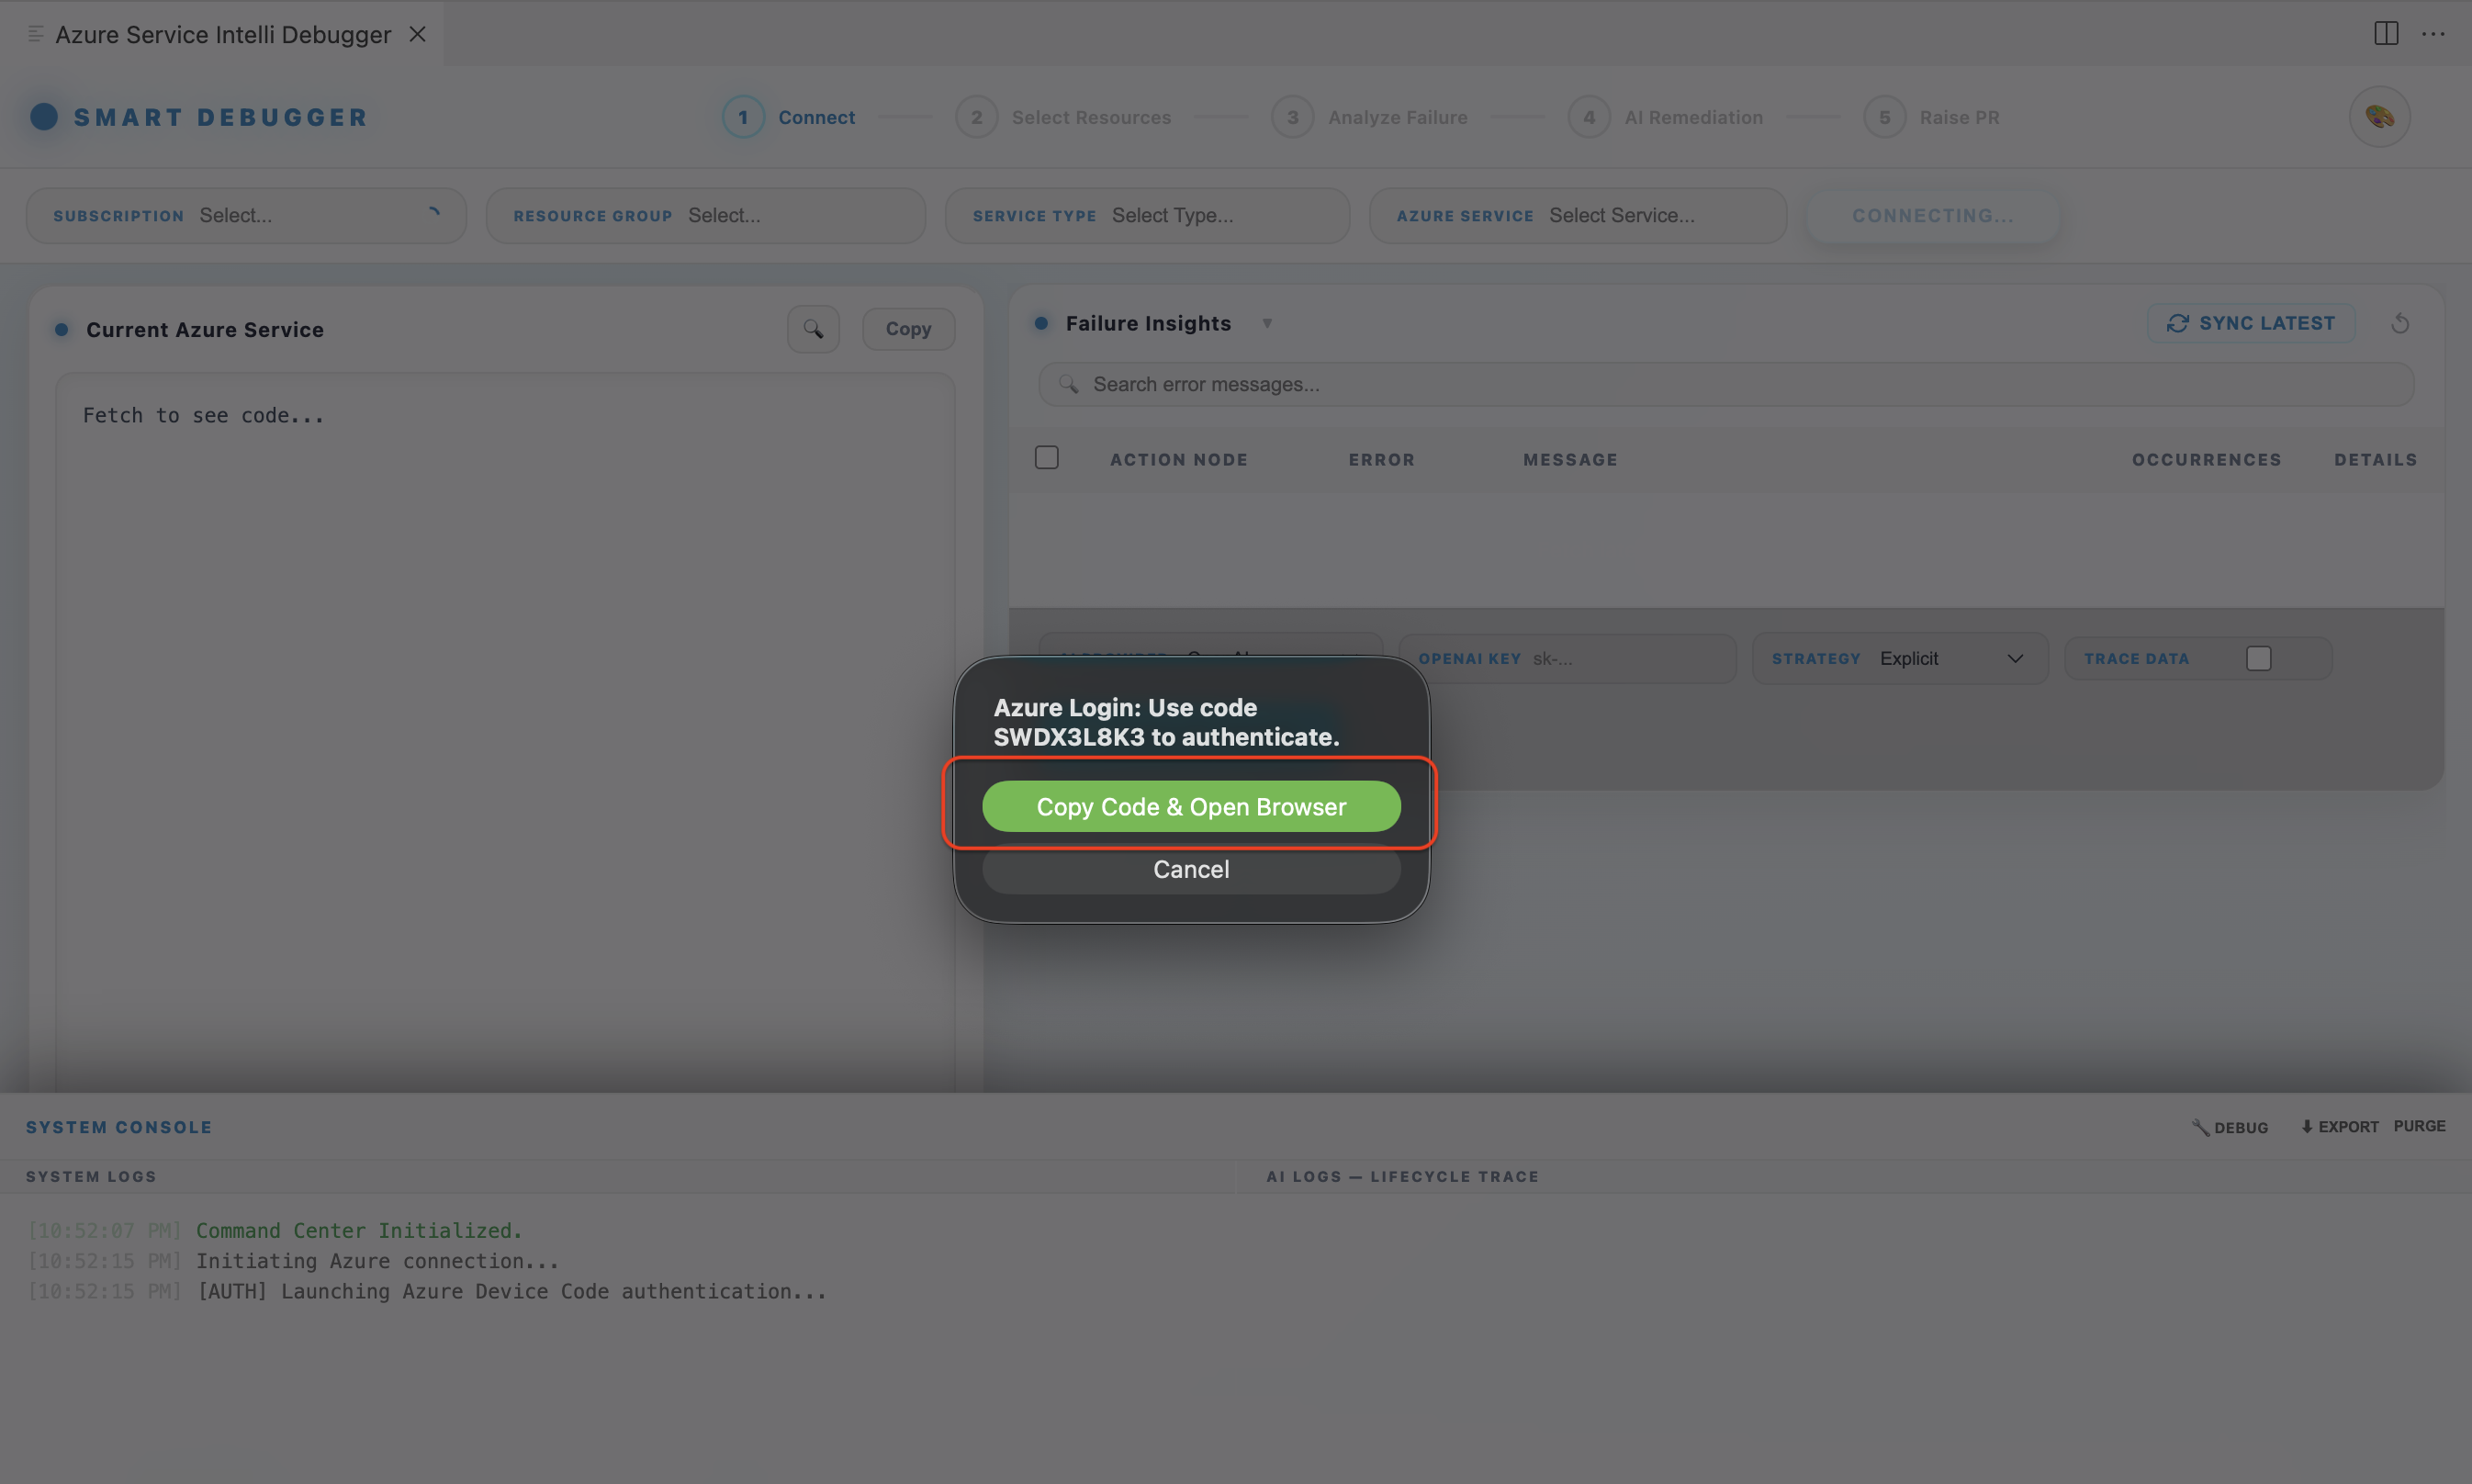
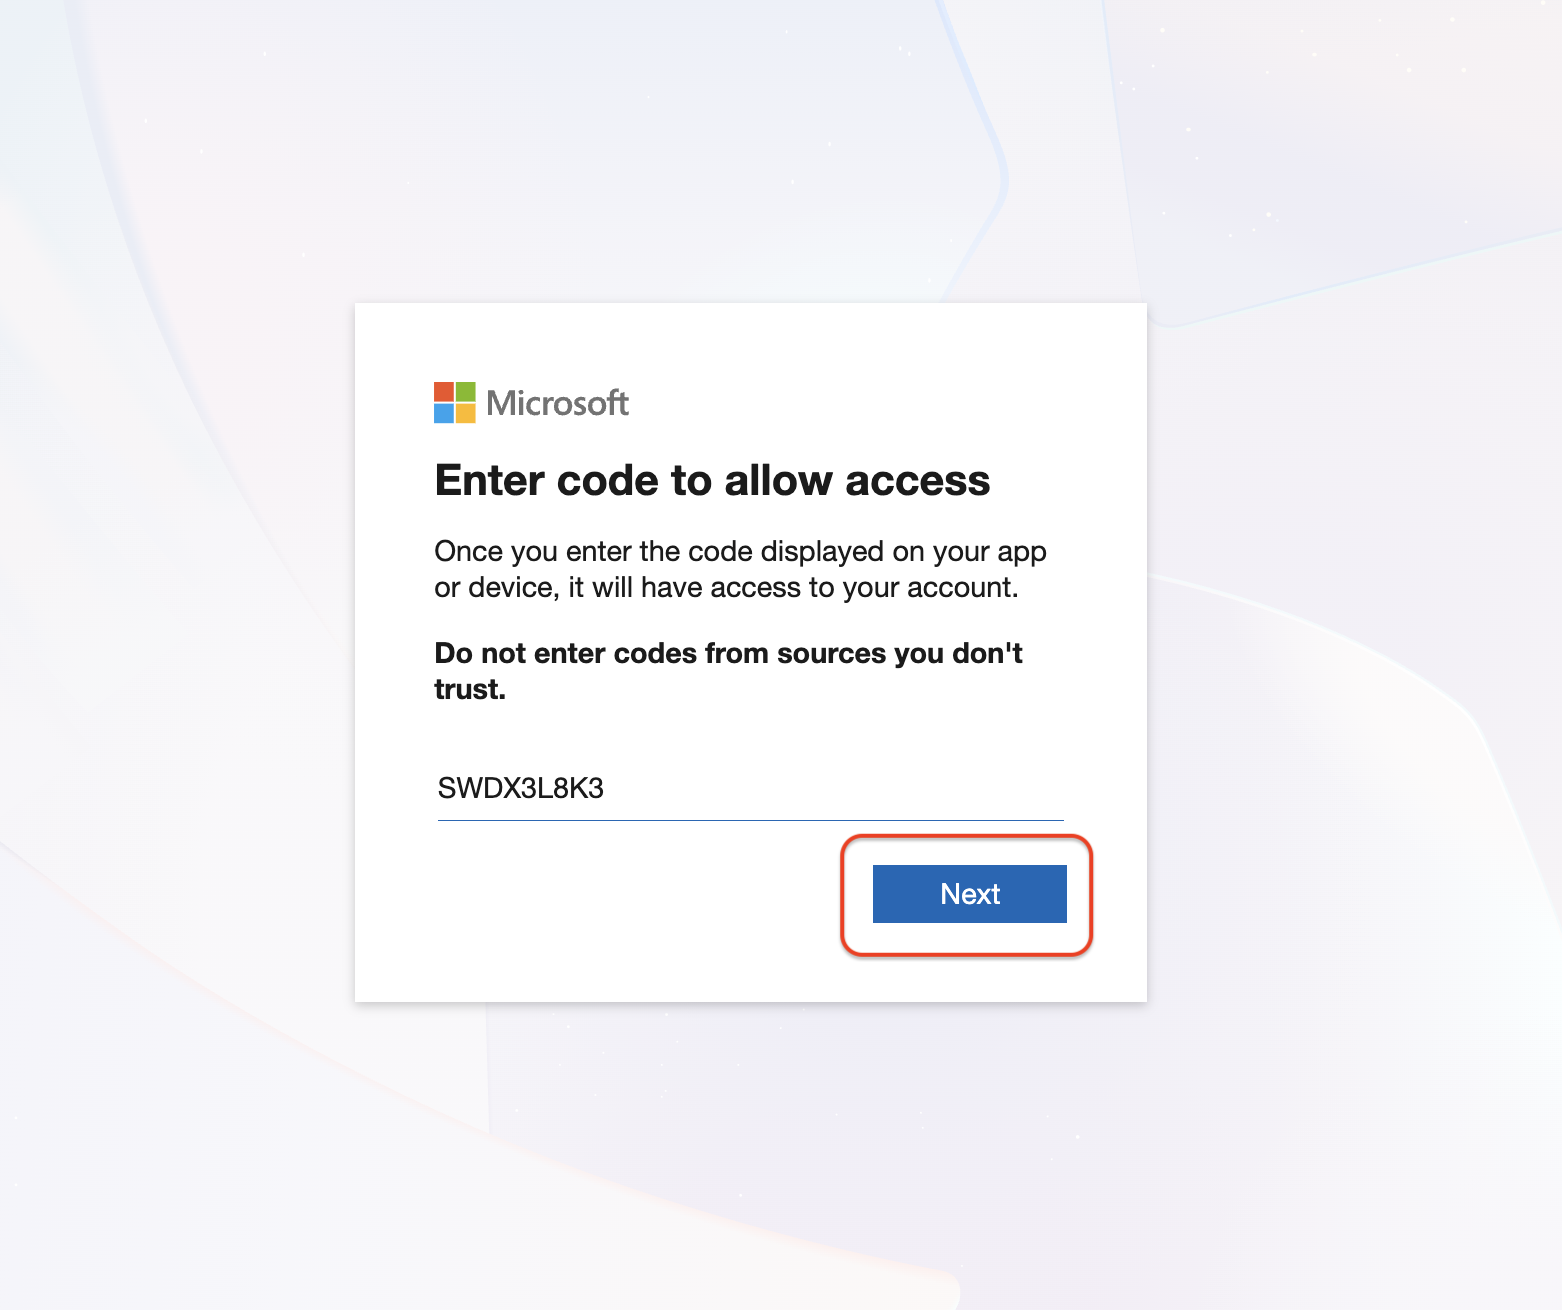
- In the dashboard, click Connect.
- A device code (e.g.,
ABCD-1234) is displayed. Your browser opens automatically to microsoft.com/devicelogin.
- Enter the code and sign in with your Microsoft account.
- Once approved, the dashboard shows your subscriptions automatically.
- Your session token is stored securely in VS Code's encrypted session handler — never written to disk in plain text.
Account types: Configure smartLogicApp.azureTenant to match your account:
| Tenant Value |
Account Type |
consumers |
Personal Microsoft accounts (Outlook.com, Gmail-linked) |
organizations |
Work or School accounts (Azure AD / Entra ID) |
common |
Supports both (default) |
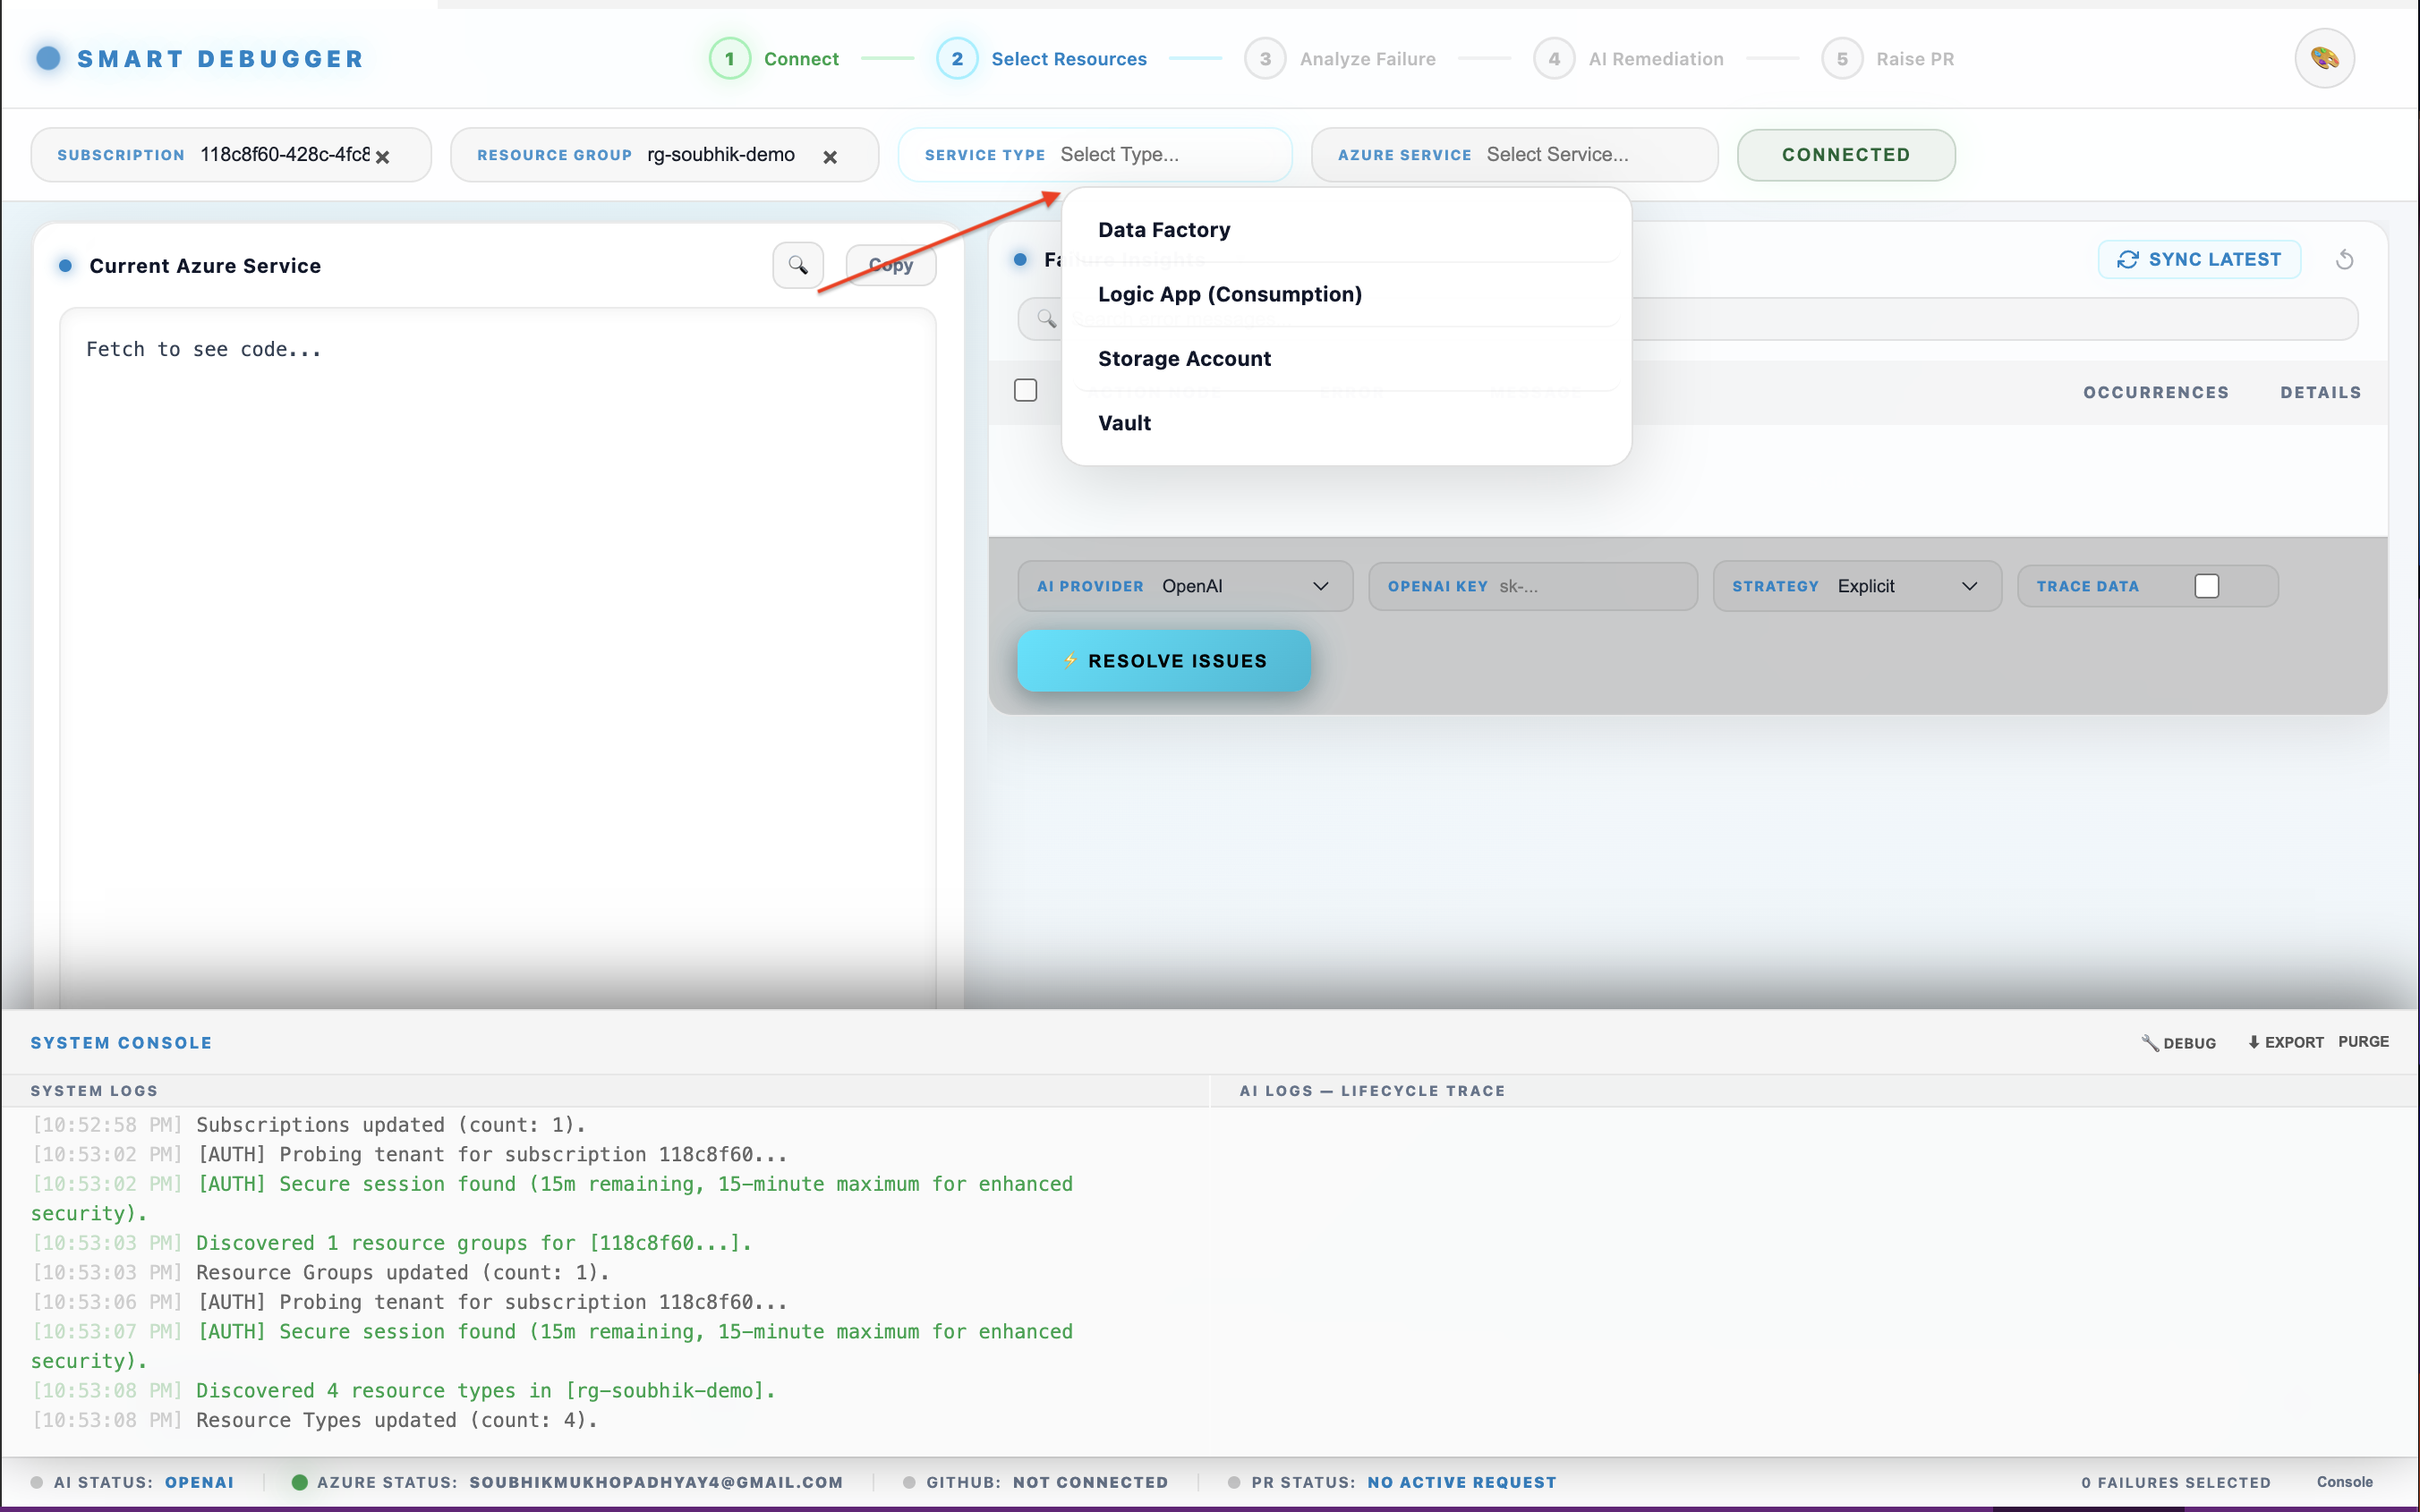
3.3 Select Your Resource
After authentication:
- Use the Subscription dropdown to select your Azure subscription.
- Use the Resource Group dropdown to filter resources.
- The dashboard auto-discovers all supported resource types:
- Logic Apps (Consumption)
- Logic Apps (Standard)
- Azure Data Factory (ADF) pipelines
- Select a workflow or pipeline from the list.
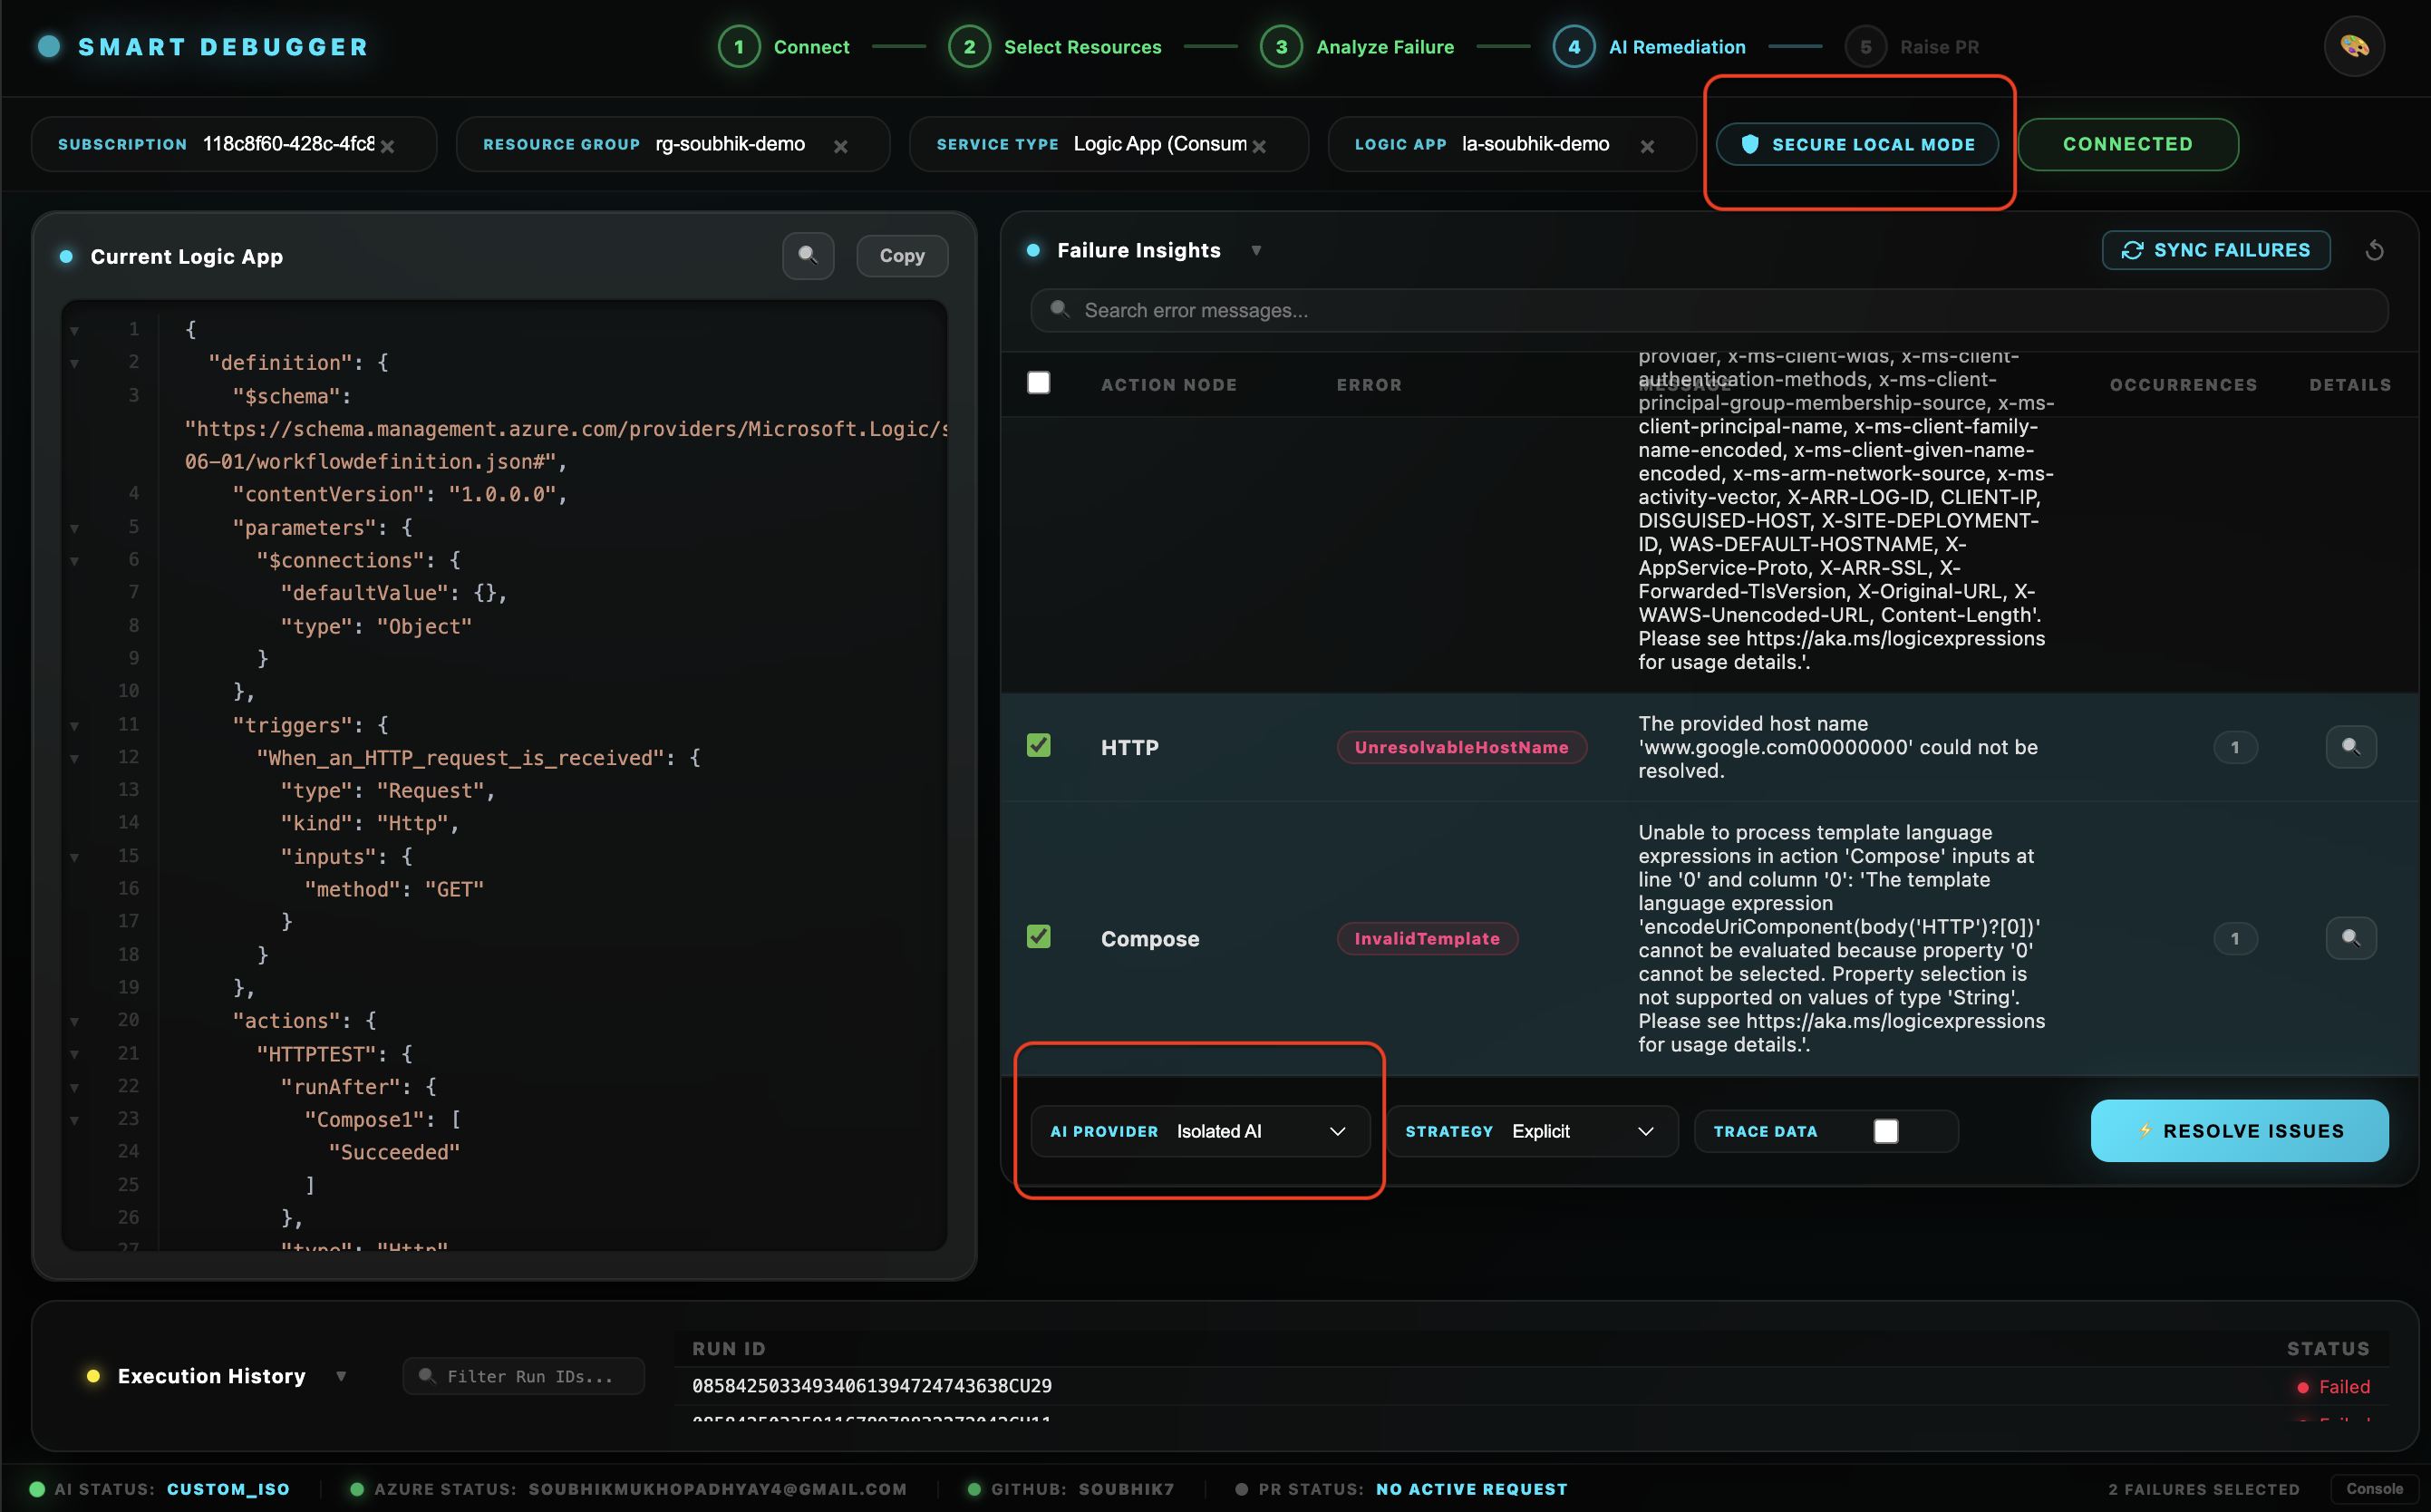
At least one AI provider must be configured before running self-healing analysis.
Option A — Cloud AI (Gemini or OpenAI):
- Open VS Code Settings (
Cmd+, / Ctrl+,).
- Search for
Smart Logic App.
- Enter your key in
smartLogicApp.googleApiKey (Gemini) or smartLogicApp.openaiApiKey (OpenAI).
- Set
smartLogicApp.defaultProvider to gemini or openai.
Keys are stored using the VS Code Secret Storage API (OS keychain) — never in plain text.
Option B — Ollama Local AI (no API key required):
- Set
smartLogicApp.defaultProvider to ollama.
- On first use, the extension checks if Ollama is installed. If not, it offers a one-click auto-install (supported on macOS, Windows, and Linux).
- Select your preferred model via
smartLogicApp.ollamaModel:
| Model |
Size |
Best For |
llama3.2:1b |
1.3 GB |
Fastest responses, quick iteration |
llama3.2:3b |
2 GB |
Balanced speed and quality |
llama3:8b |
4.7 GB |
High quality, slower |
mistral:7b |
4.1 GB |
Alternative high-quality model |
The model is downloaded automatically in the background with a progress indicator in the dashboard.
Option C — Isolated Custom AI (Phase 2):
Requires the companion extension soubhikdevtools.azure-smart-ai-model-extension. Set smartLogicApp.defaultProvider to custom_iso. When switching to this provider, you choose between a NumPy engine (lightweight, CPU) or a PyTorch engine (GPU-accelerated, higher fidelity) directly from a VS Code prompt — no restart needed.
3.5 Connect GitHub
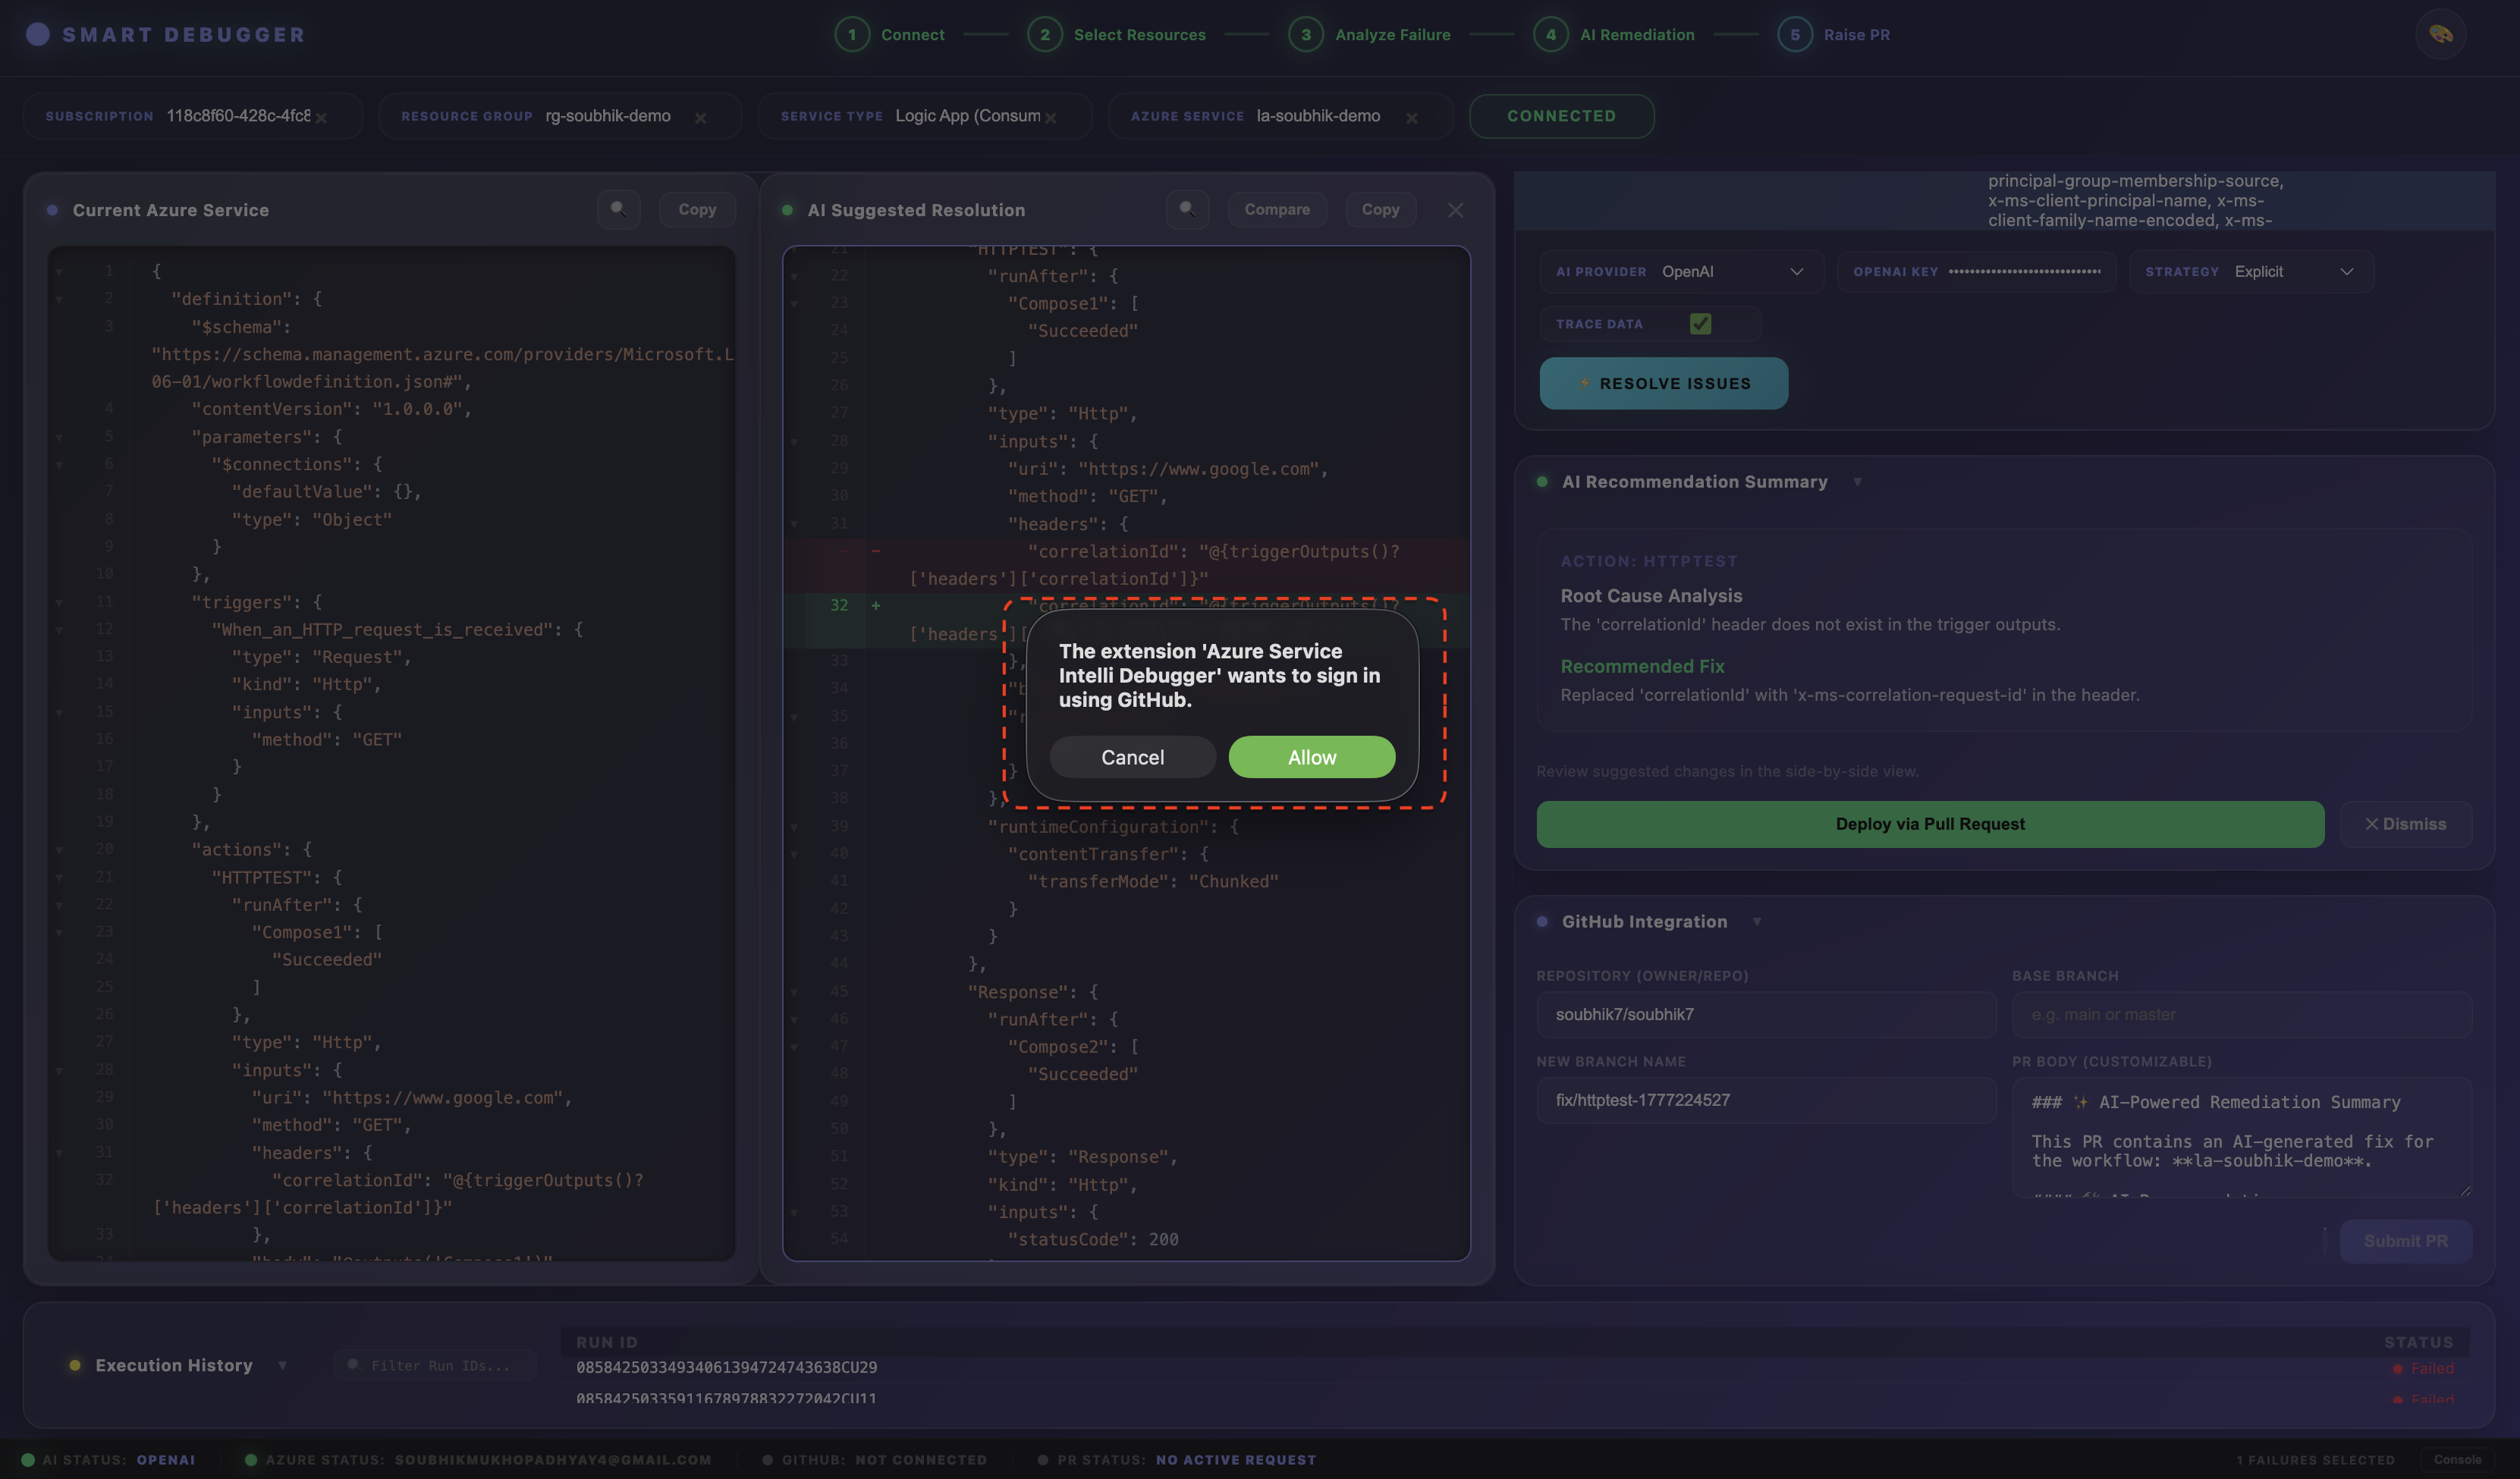
Required only if you want to raise Pull Requests for AI-generated fixes.
- In the dashboard GitHub section, click Connect GitHub.
- VS Code's built-in GitHub Authentication Provider opens — no Personal Access Token (PAT) is needed.
- Approve the
repo and user scopes.
- In VS Code Settings, set
smartLogicApp.githubRepo to your target repository in owner/repo format (e.g., myorg/logic-app-workflows).
4. Full Workflow: From Failure to Pull Request
Step 1 — Authenticate with Azure
Follow Section 3.2. After login, your subscriptions populate the dashboard instantly.
Step 2 — Discover Resources
Select your Subscription → Resource Group → Workflow (Logic App or ADF pipeline). The extension calls the Azure Resource Manager (ARM) API to enumerate all eligible resources in real time.

Step 3 — Monitor Run History
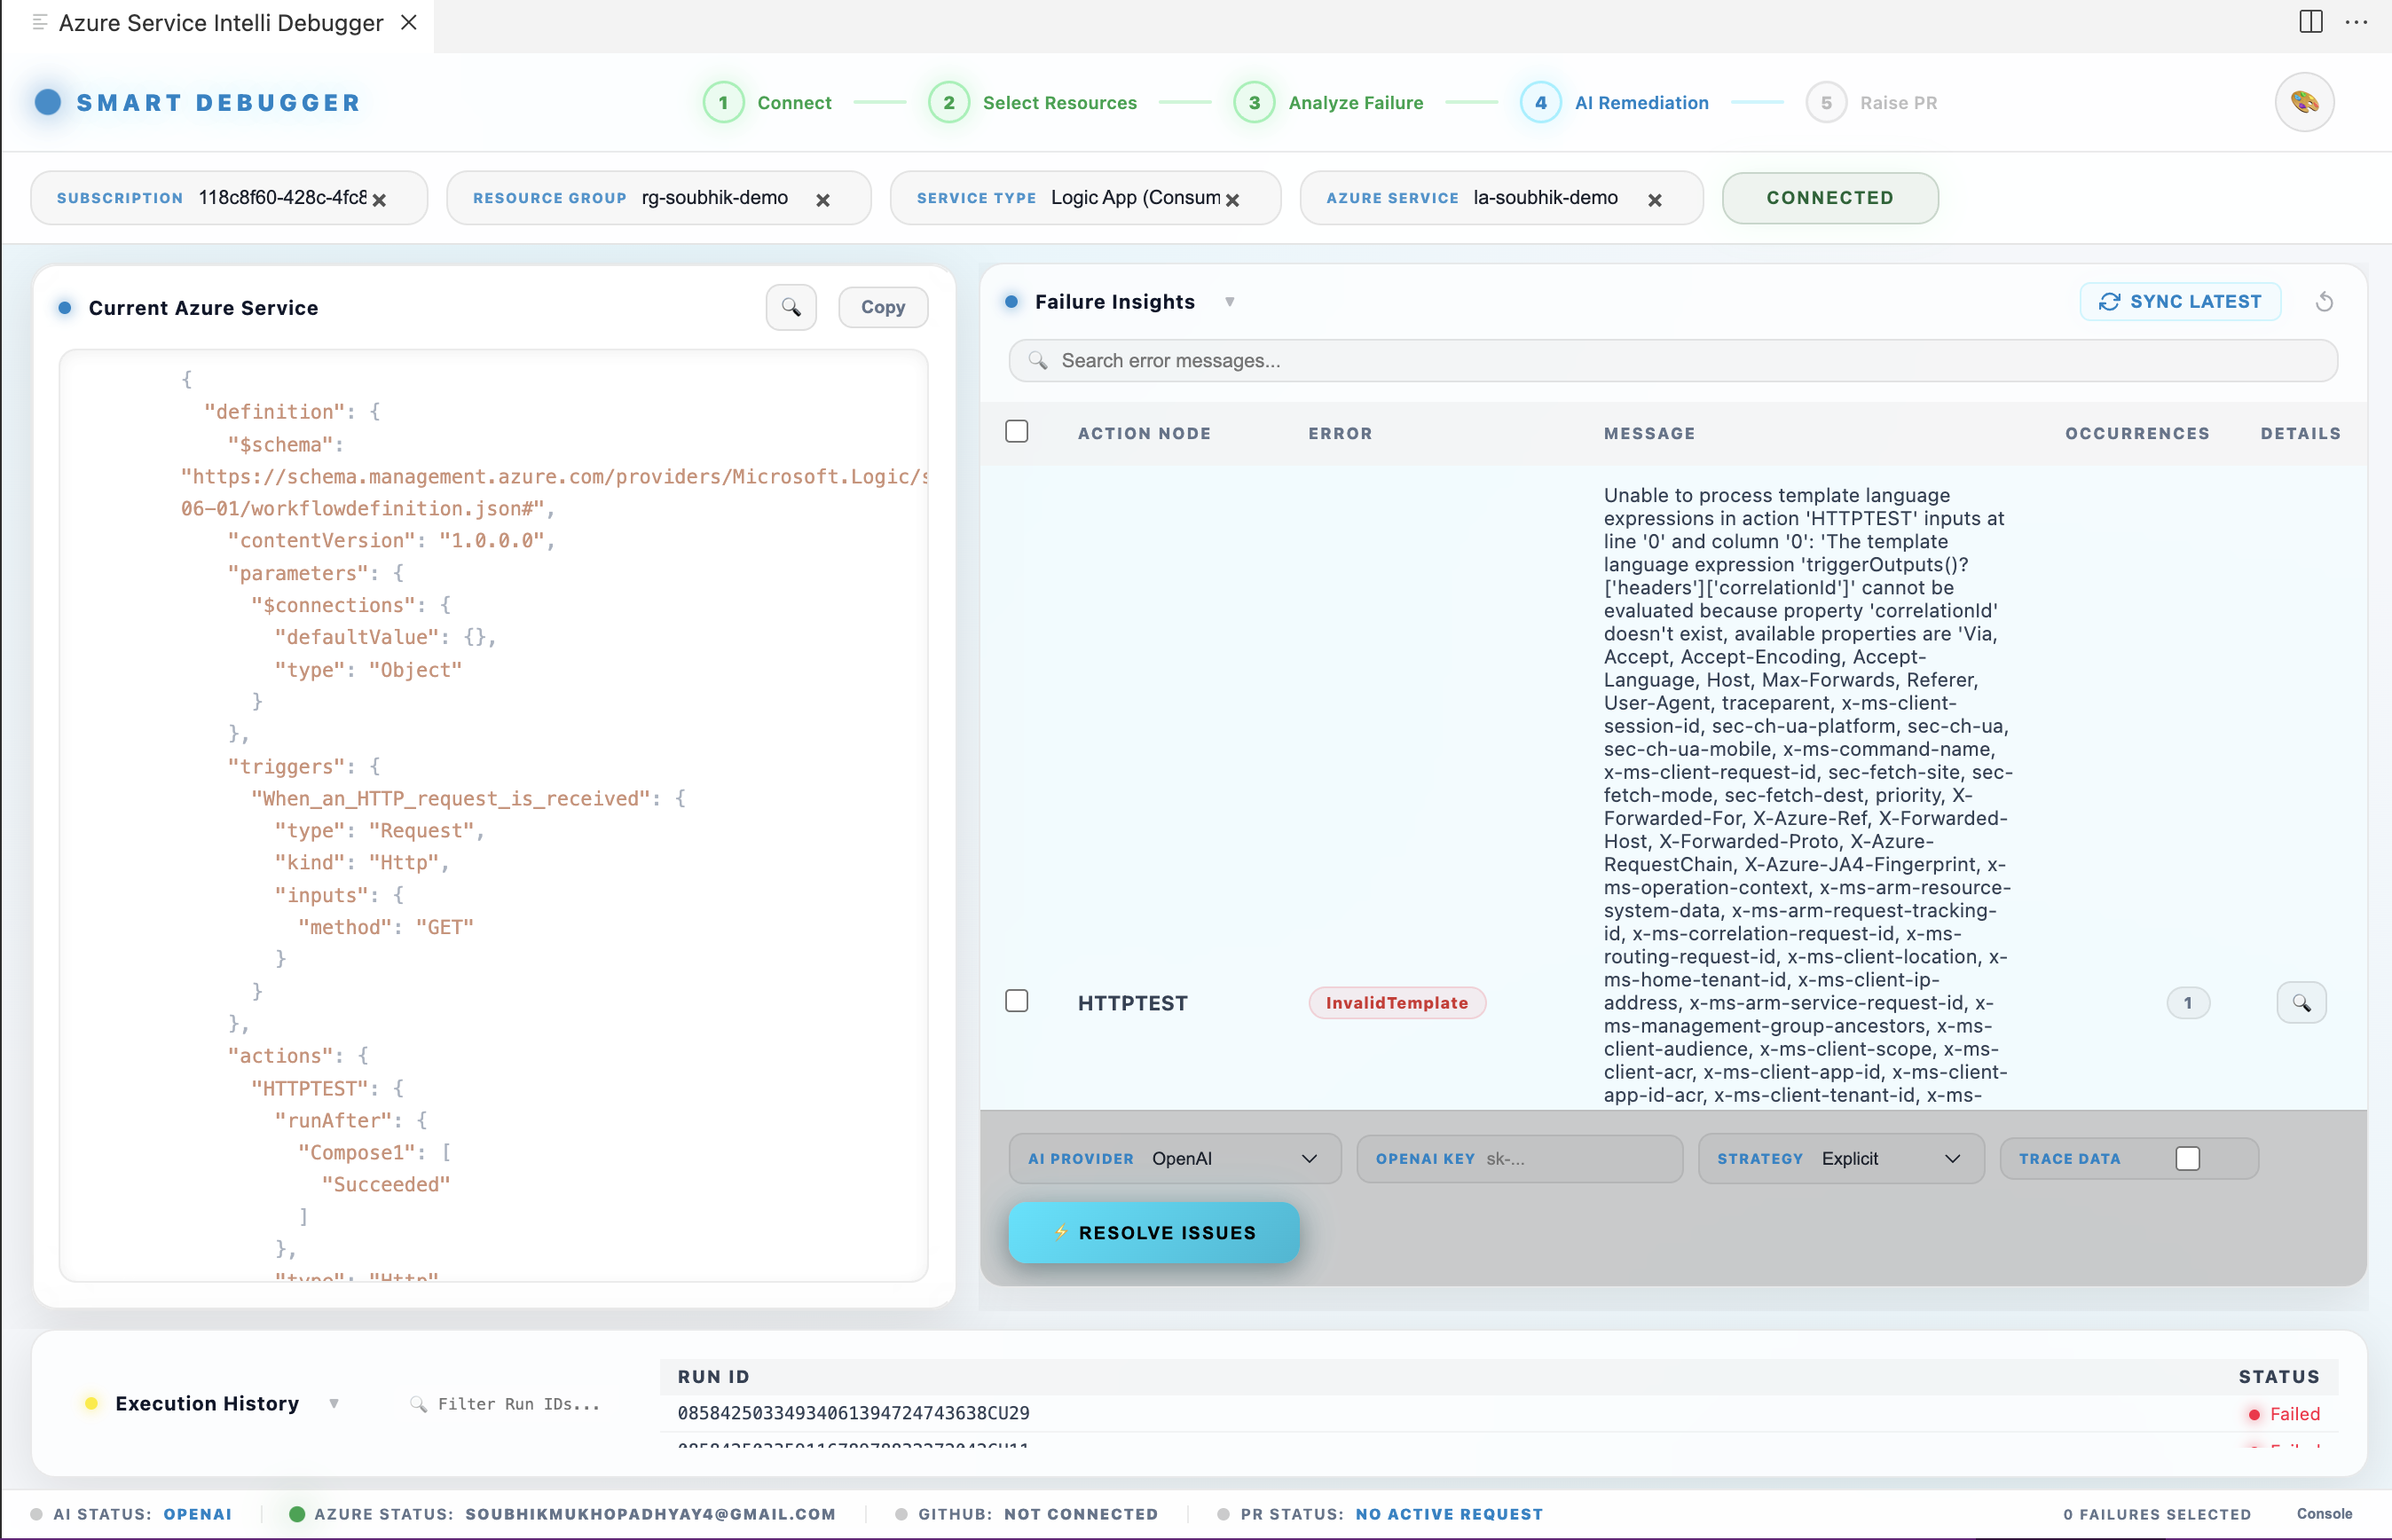
Click Fetch Runs on the selected resource. The dashboard displays:
- Total runs fetched
- Failed runs count (highlighted in red)
- Succeeded runs count (highlighted in green)
- A run-by-run table showing
run_id and status
Failed runs are instantly flagged with deep-link access to their execution history. The Observability Panel provides a live, aggregated view of resource health across all fetched runs.

Step 4 — Inspect Failure Insights
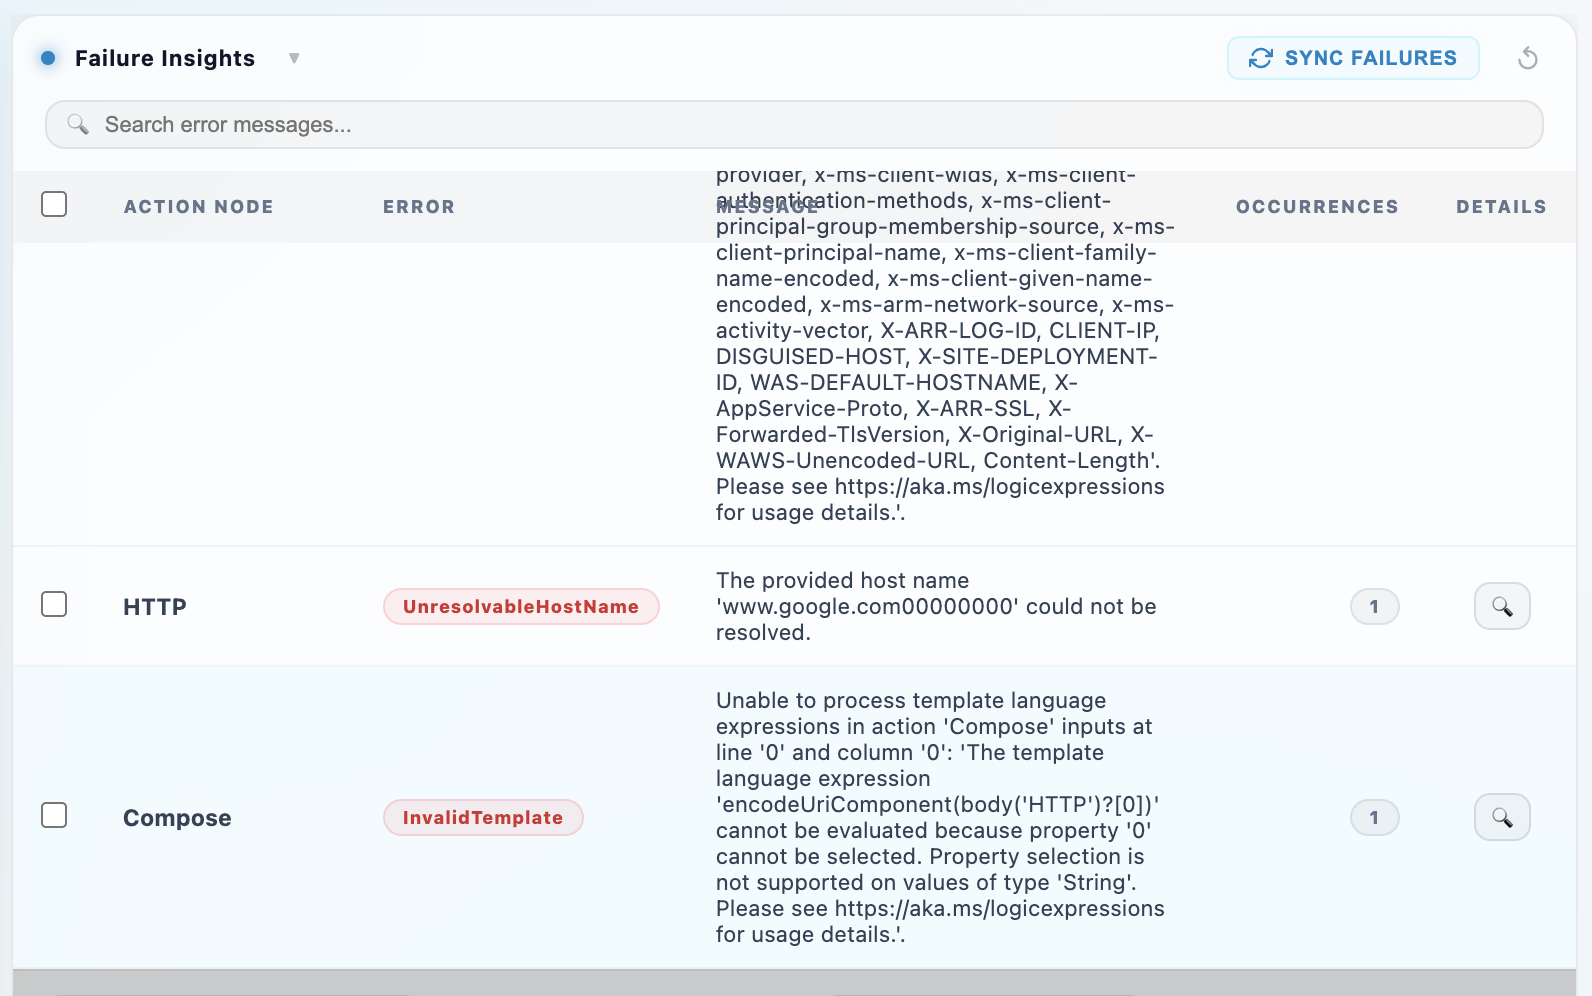
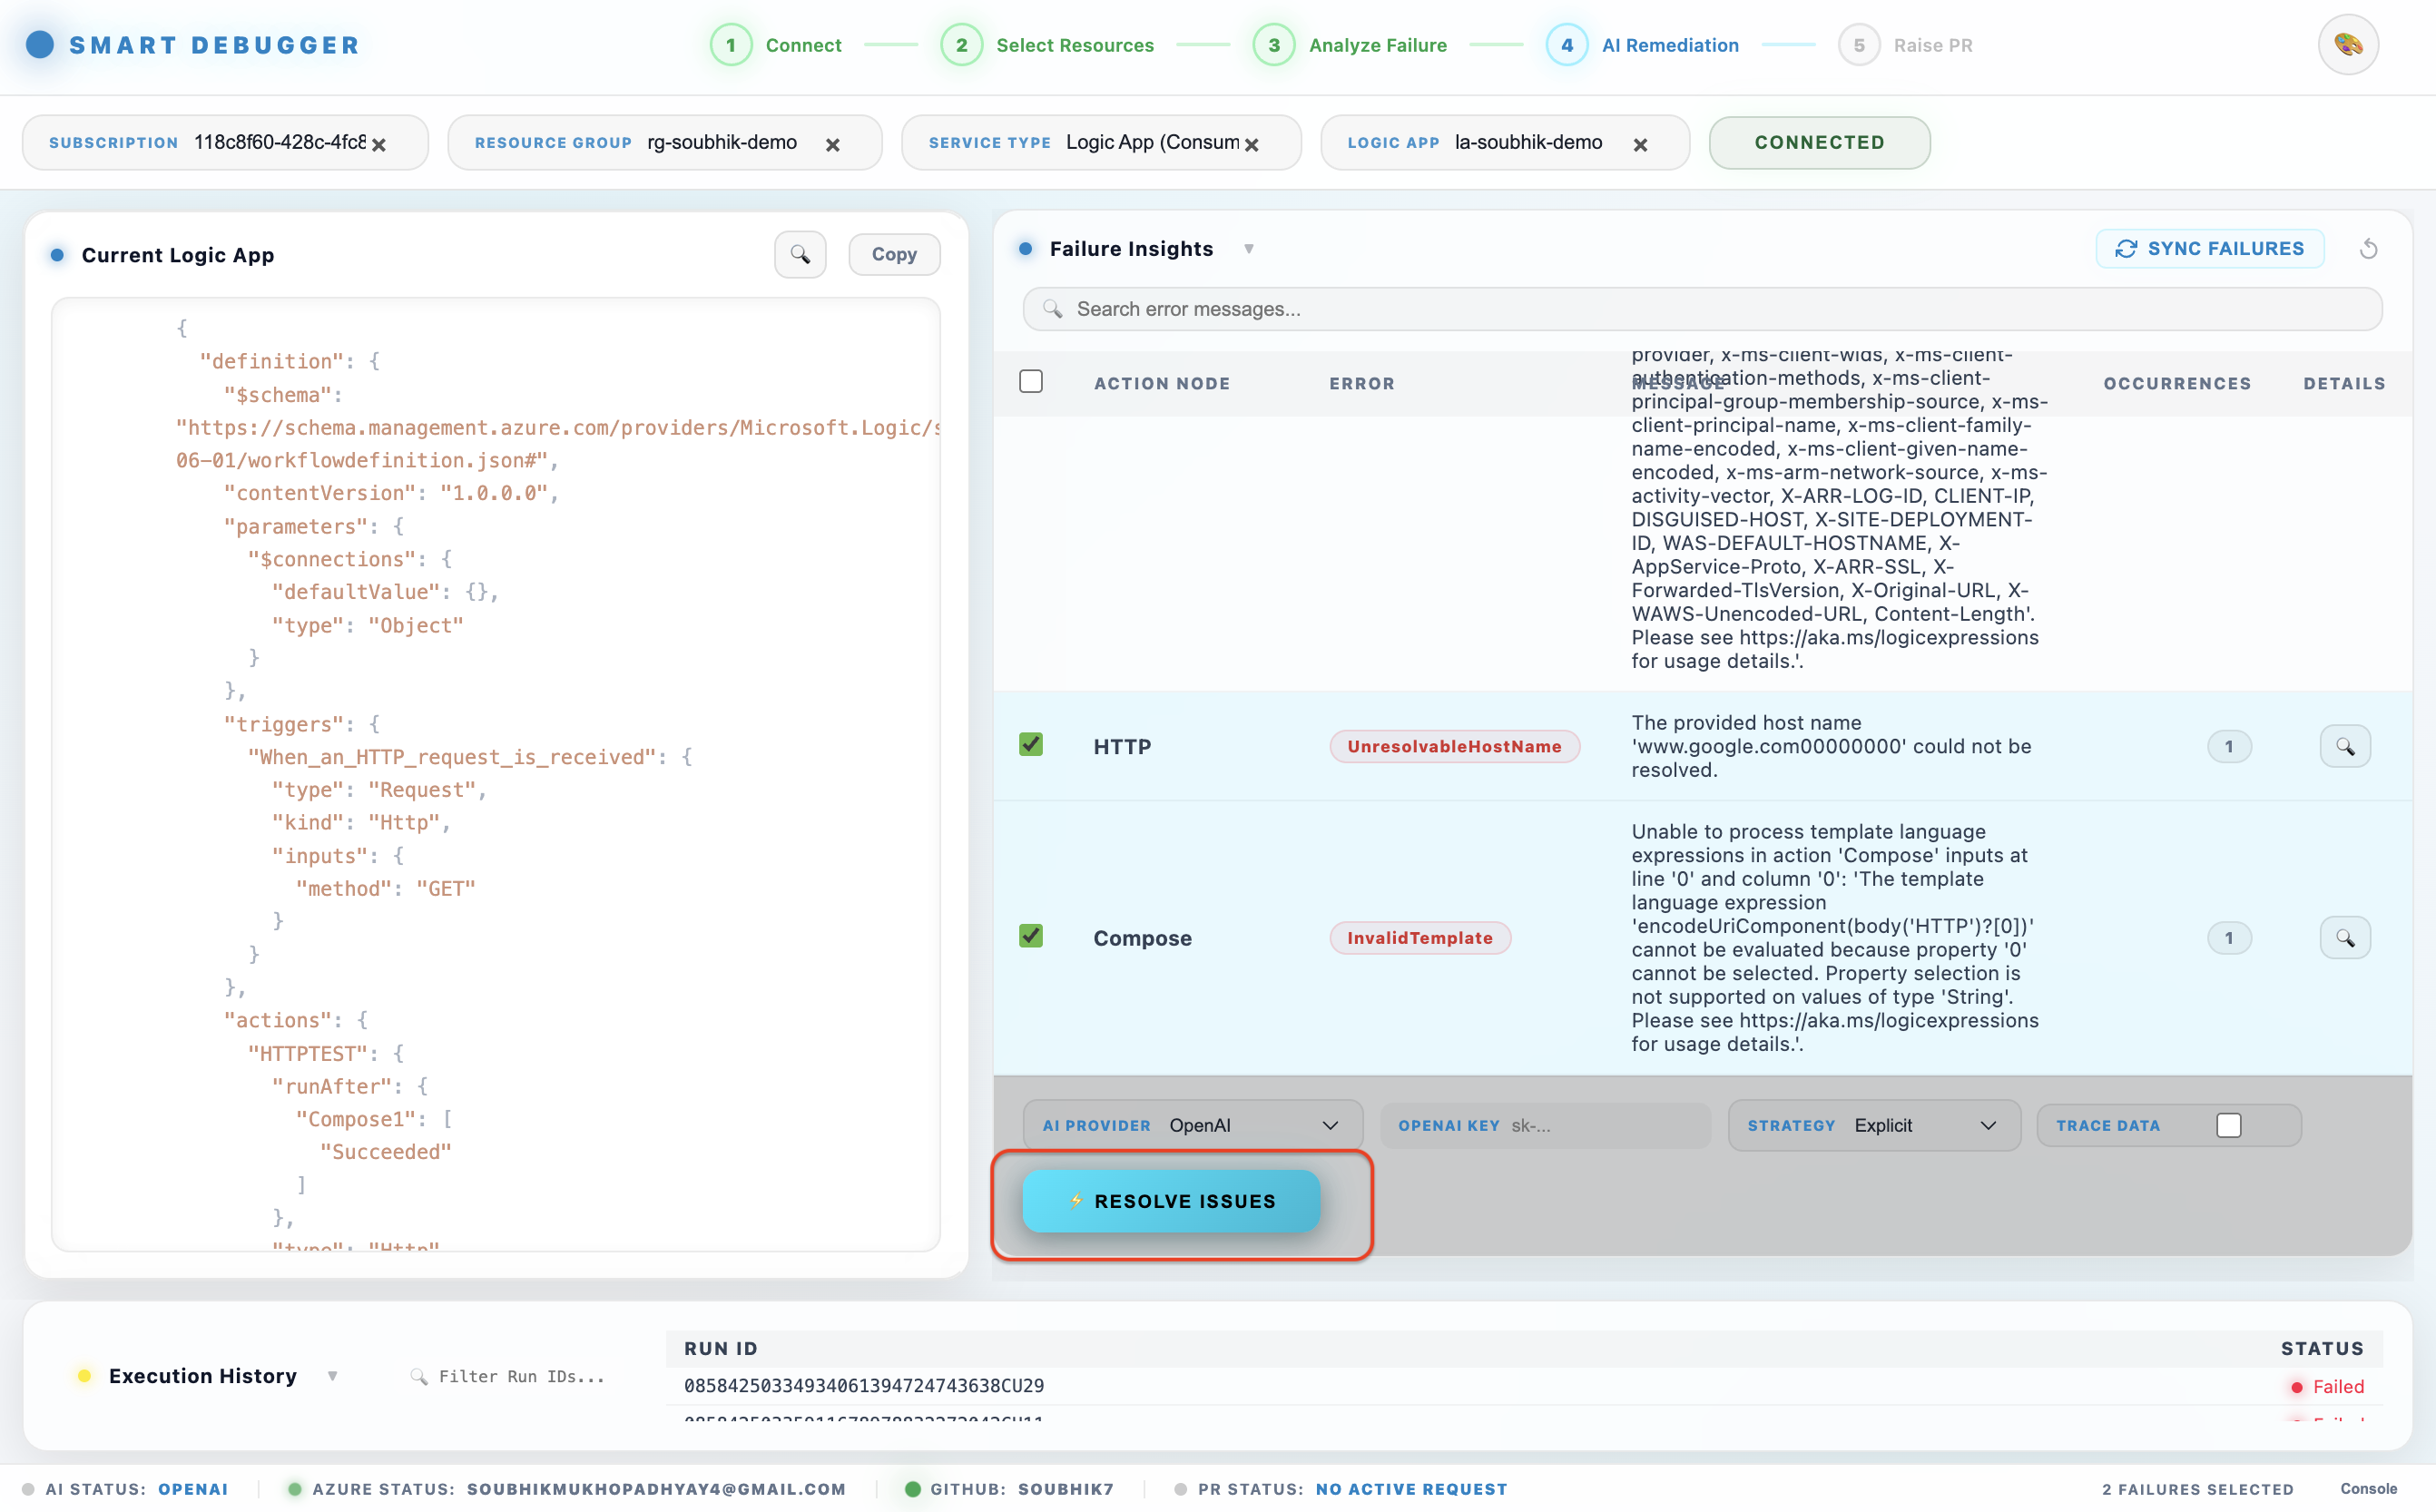
Click any failed run to expand Failure Insights. The dashboard aggregates failures across all runs and groups identical errors by action_name|error_message so repeated failures are surfaced once:
| Column |
Description |
| Action Name |
The specific workflow action or ADF activity that failed |
| Action Type |
The type of connector or action |
| Error Code |
Azure error code (e.g., ActionFailed, BadRequest) |
| Error Message |
Human-readable error description |
| Affected Run IDs |
All run IDs where this exact failure occurred |
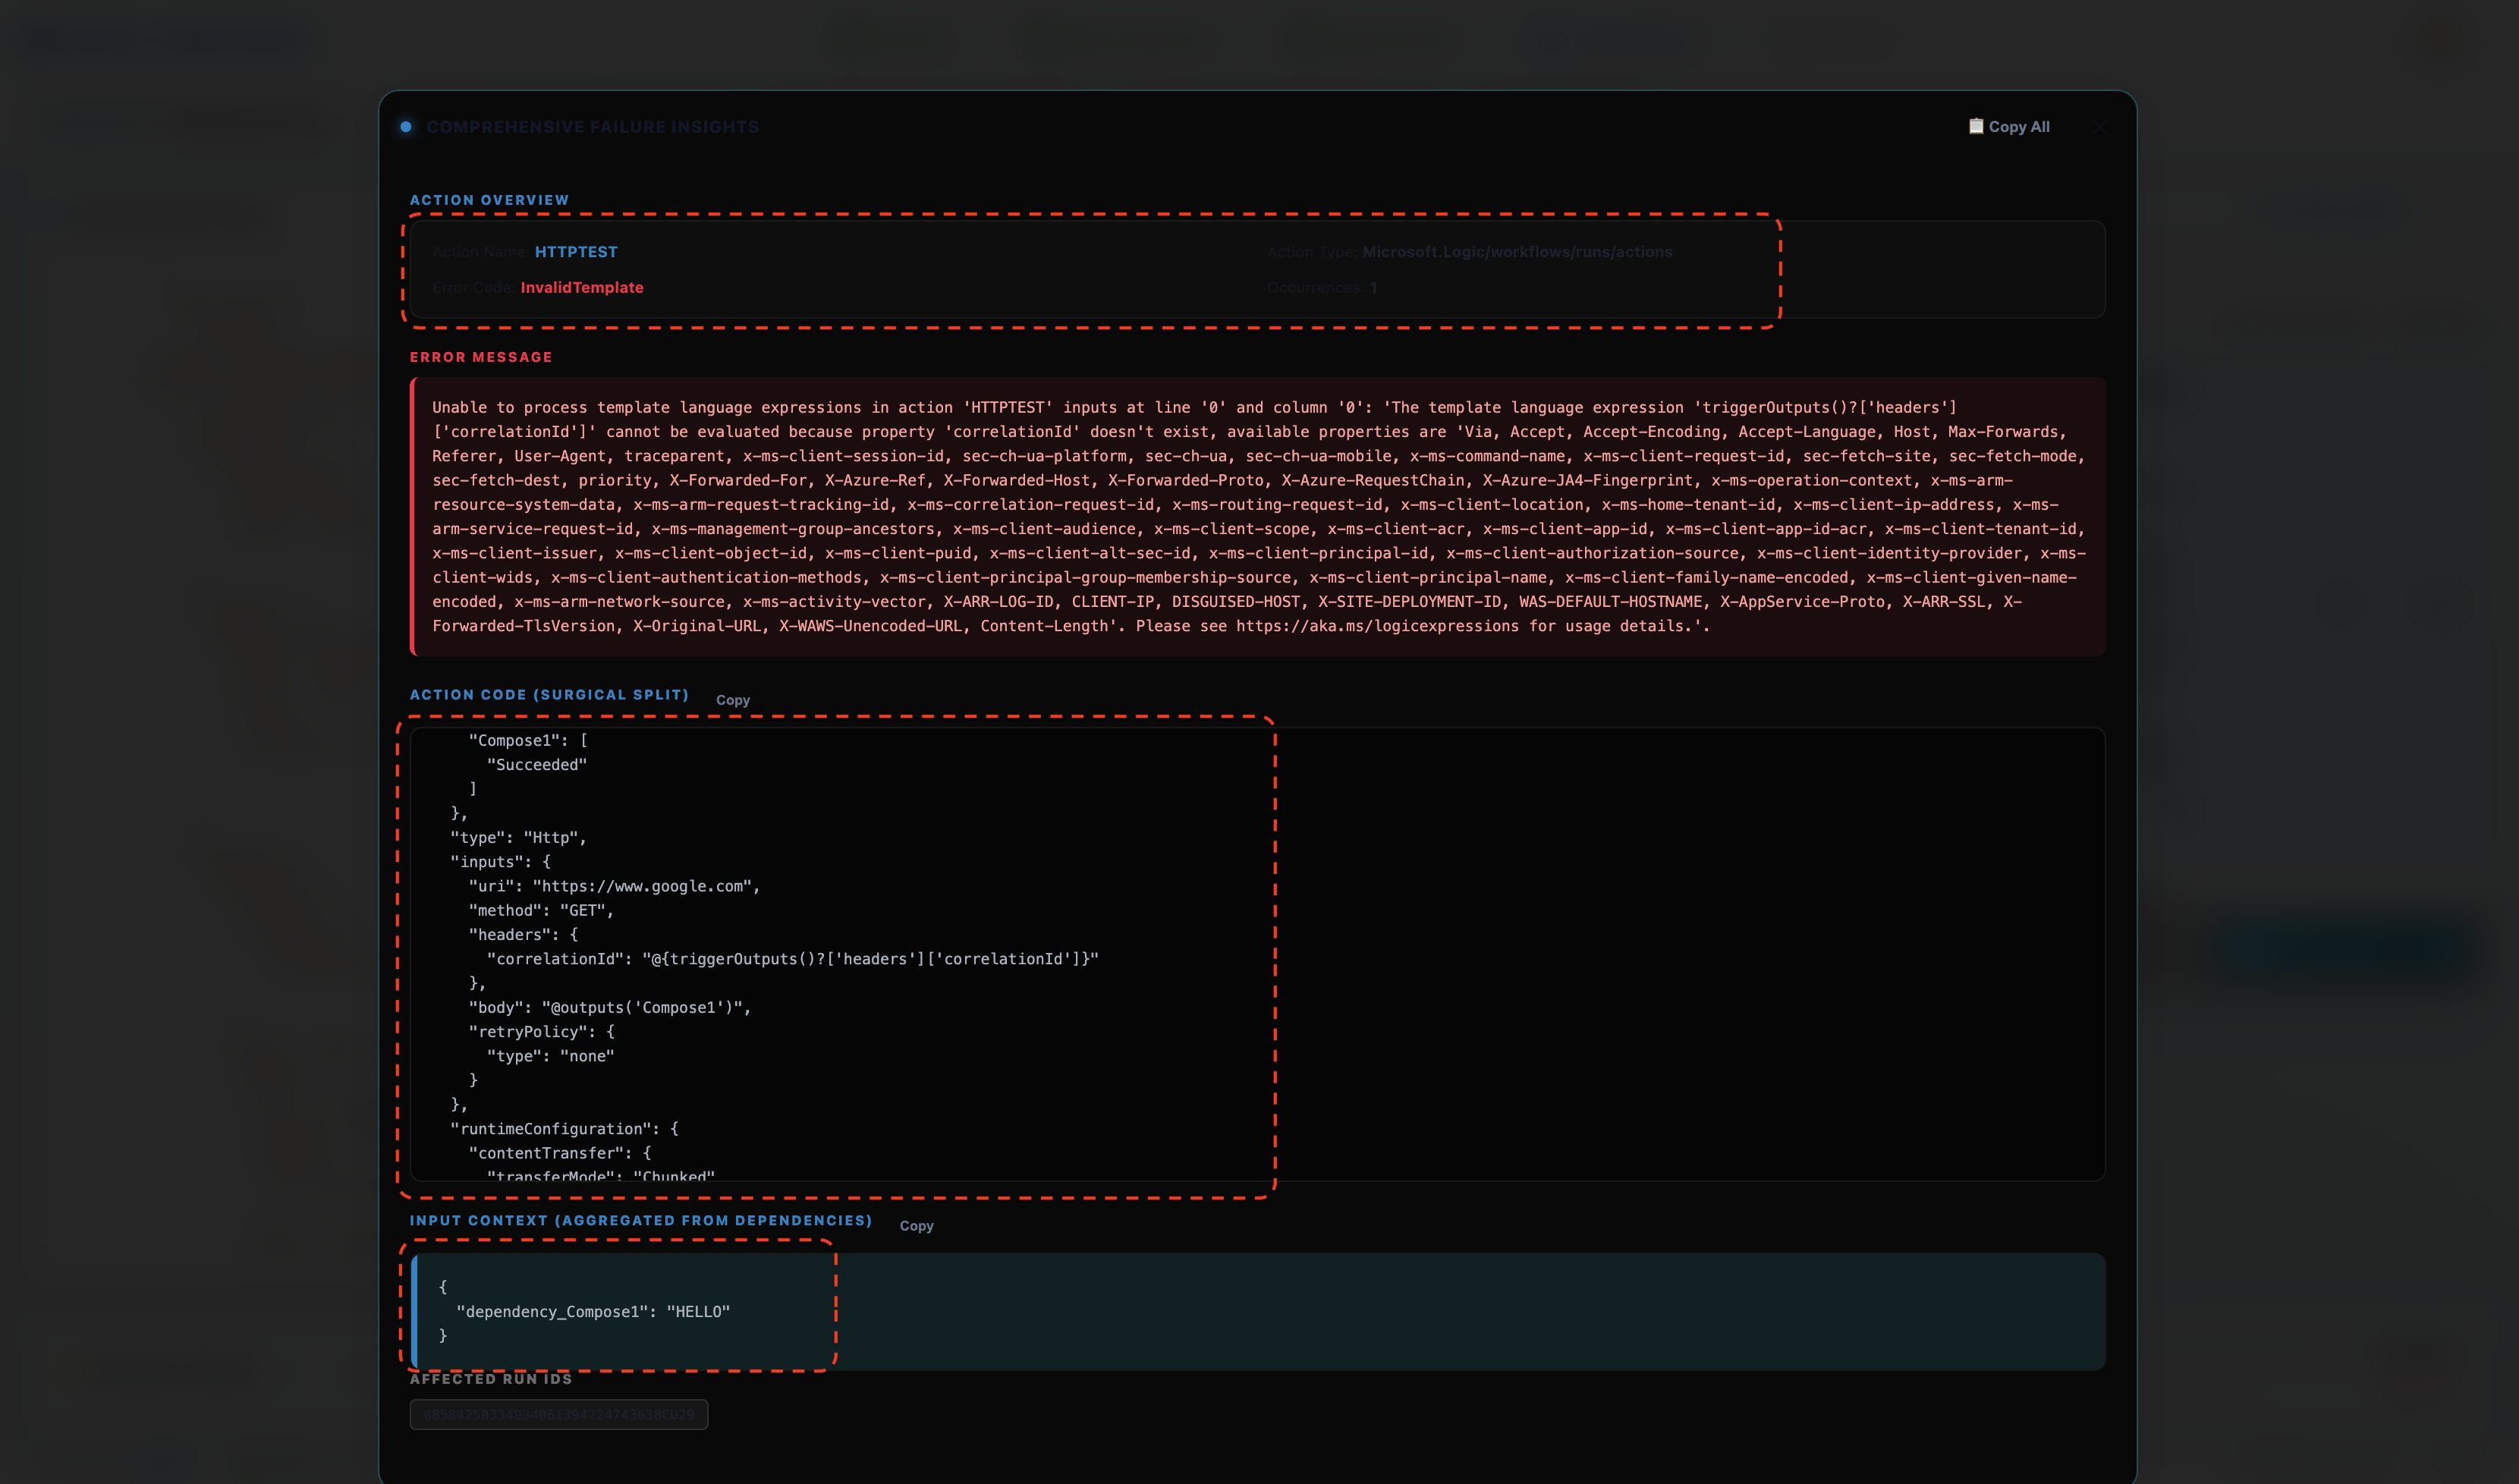
Click Inspect on any failure to load full details:
- The action's source code from the workflow definition
- The runtime input data that caused the failure
- The outputs of dependency actions (actions this one depends on via
runAfter)
- The
input_source field tells you whether the input came directly (direct_input) or was inherited from an upstream action's output (dependency_output)

Step 5 — Run AI Self-Healing
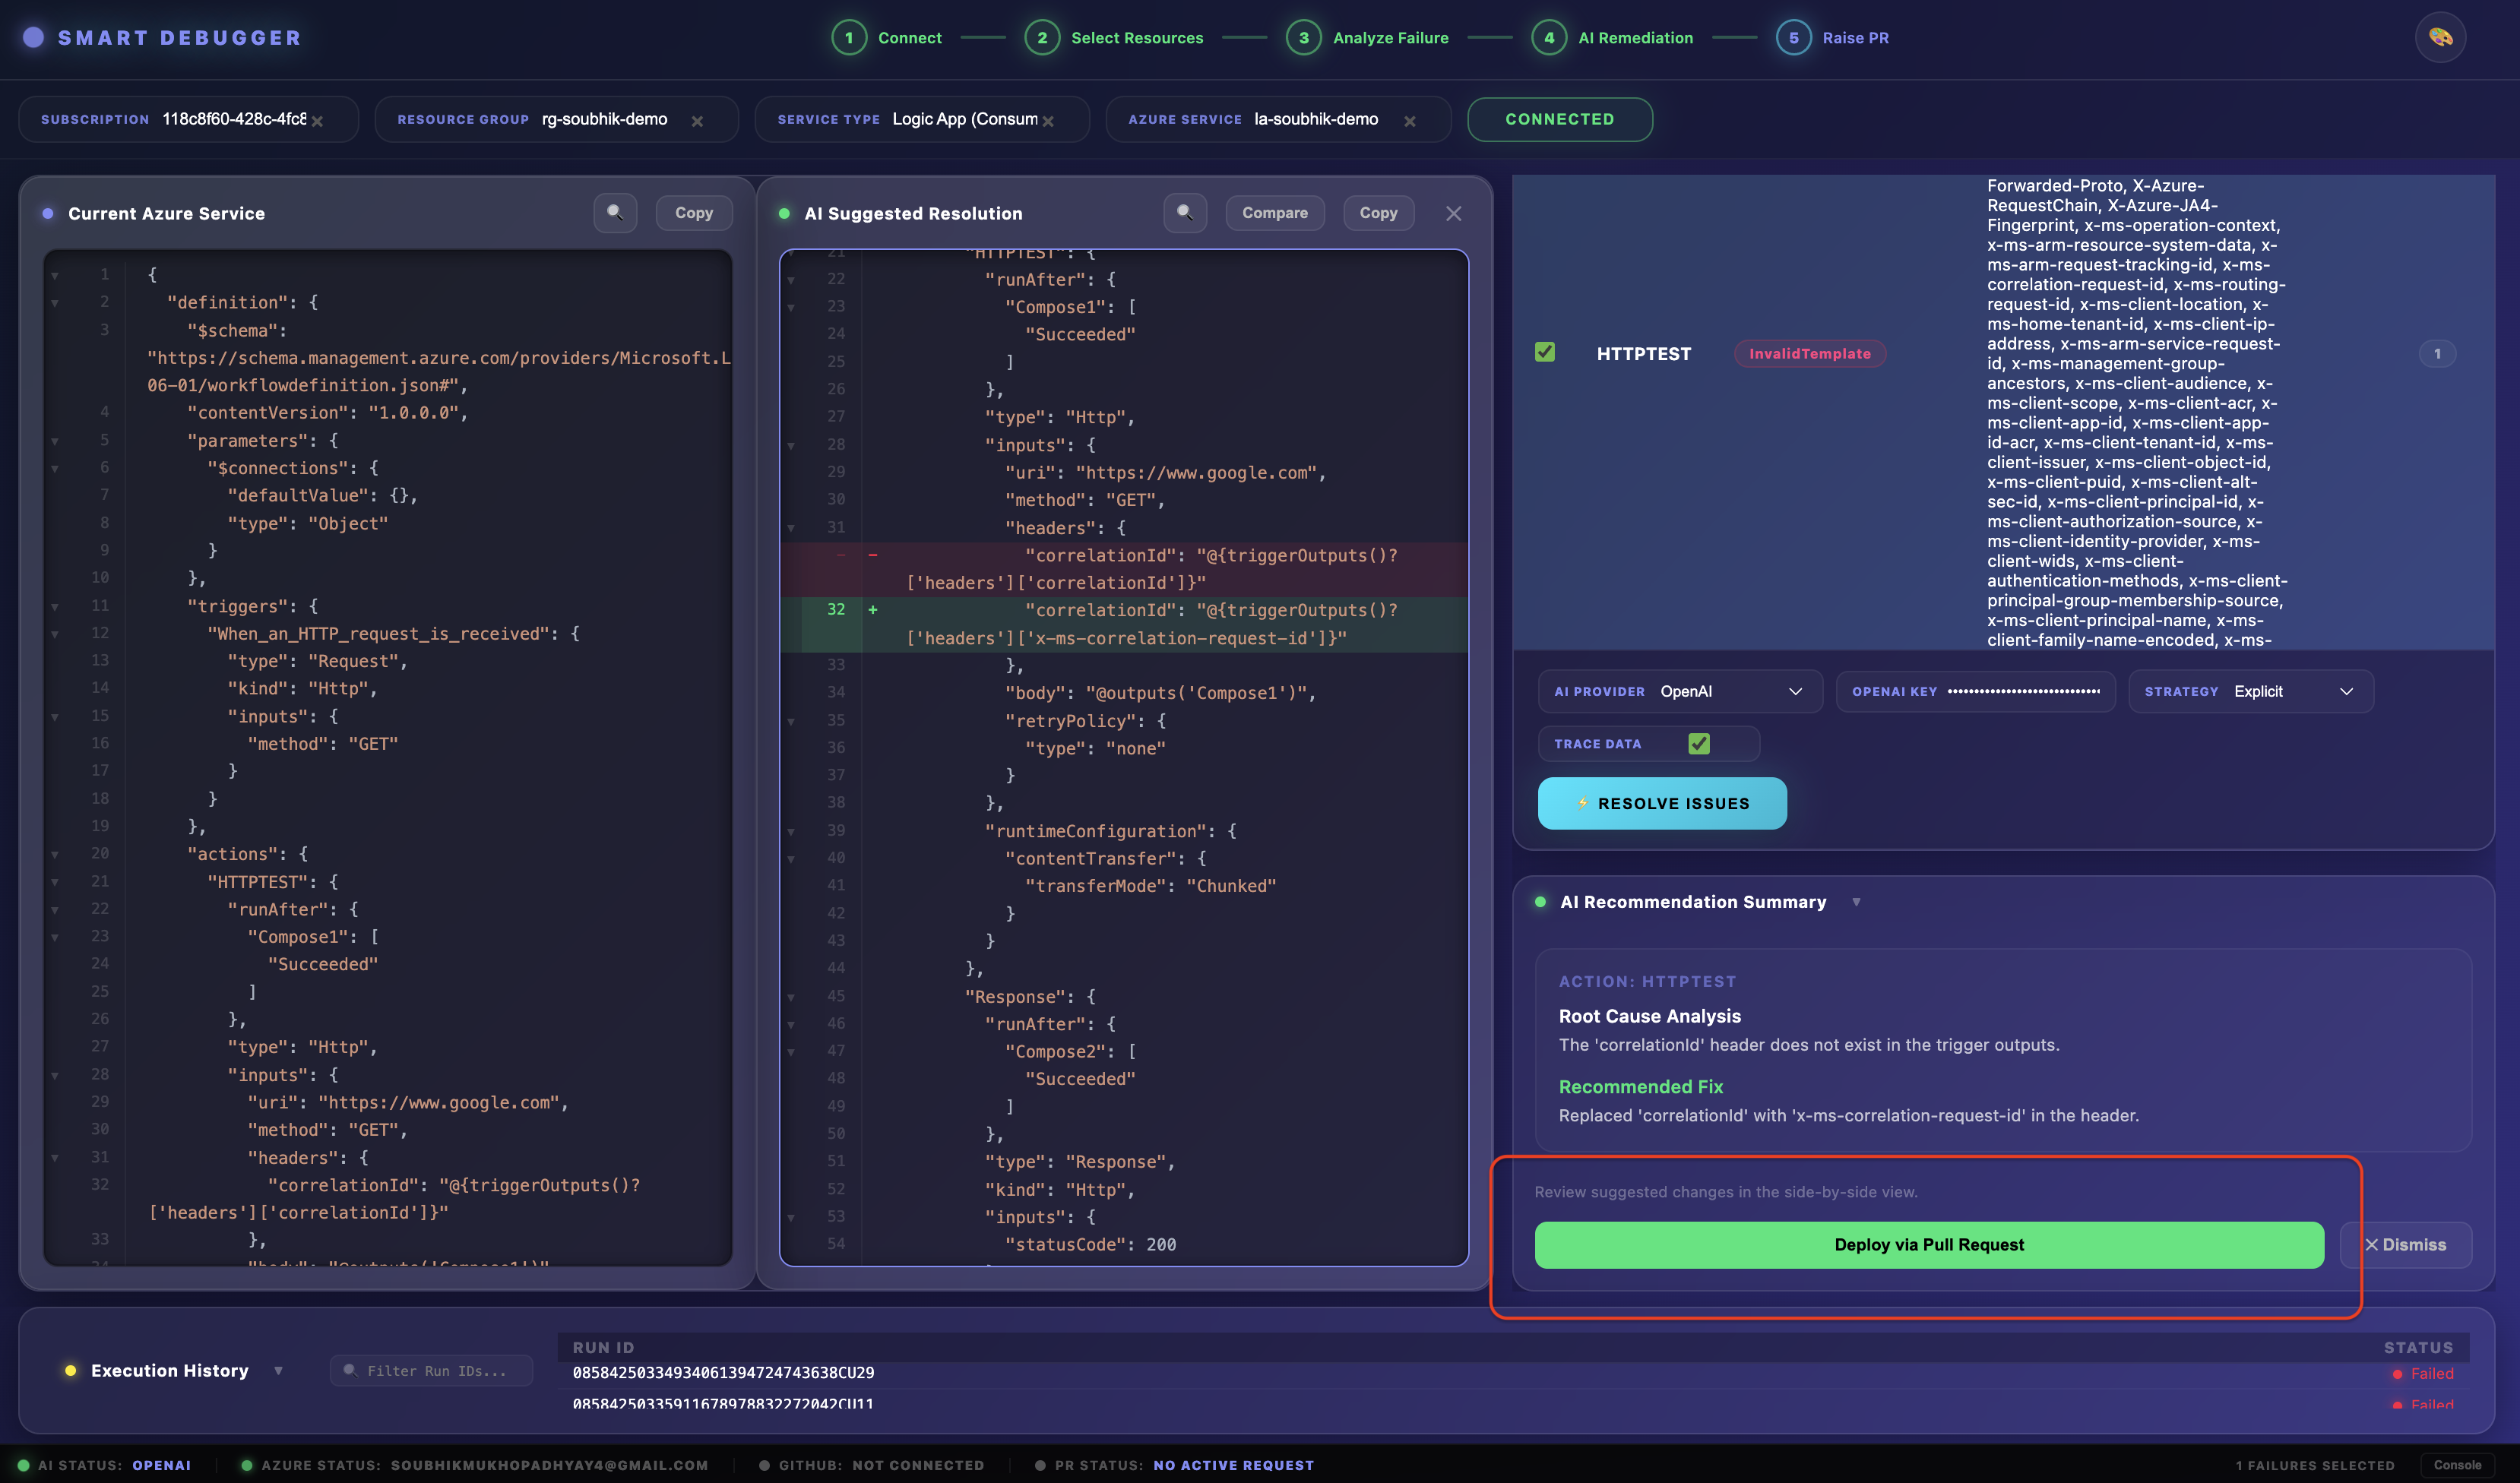
- Select one or more failures from the Failure Insights table using the checkboxes.
- Toggle Include Input/Output Trace Data if you want the AI to analyse the actual runtime data (recommended for complex failures).
- Click Run Self-Healing.
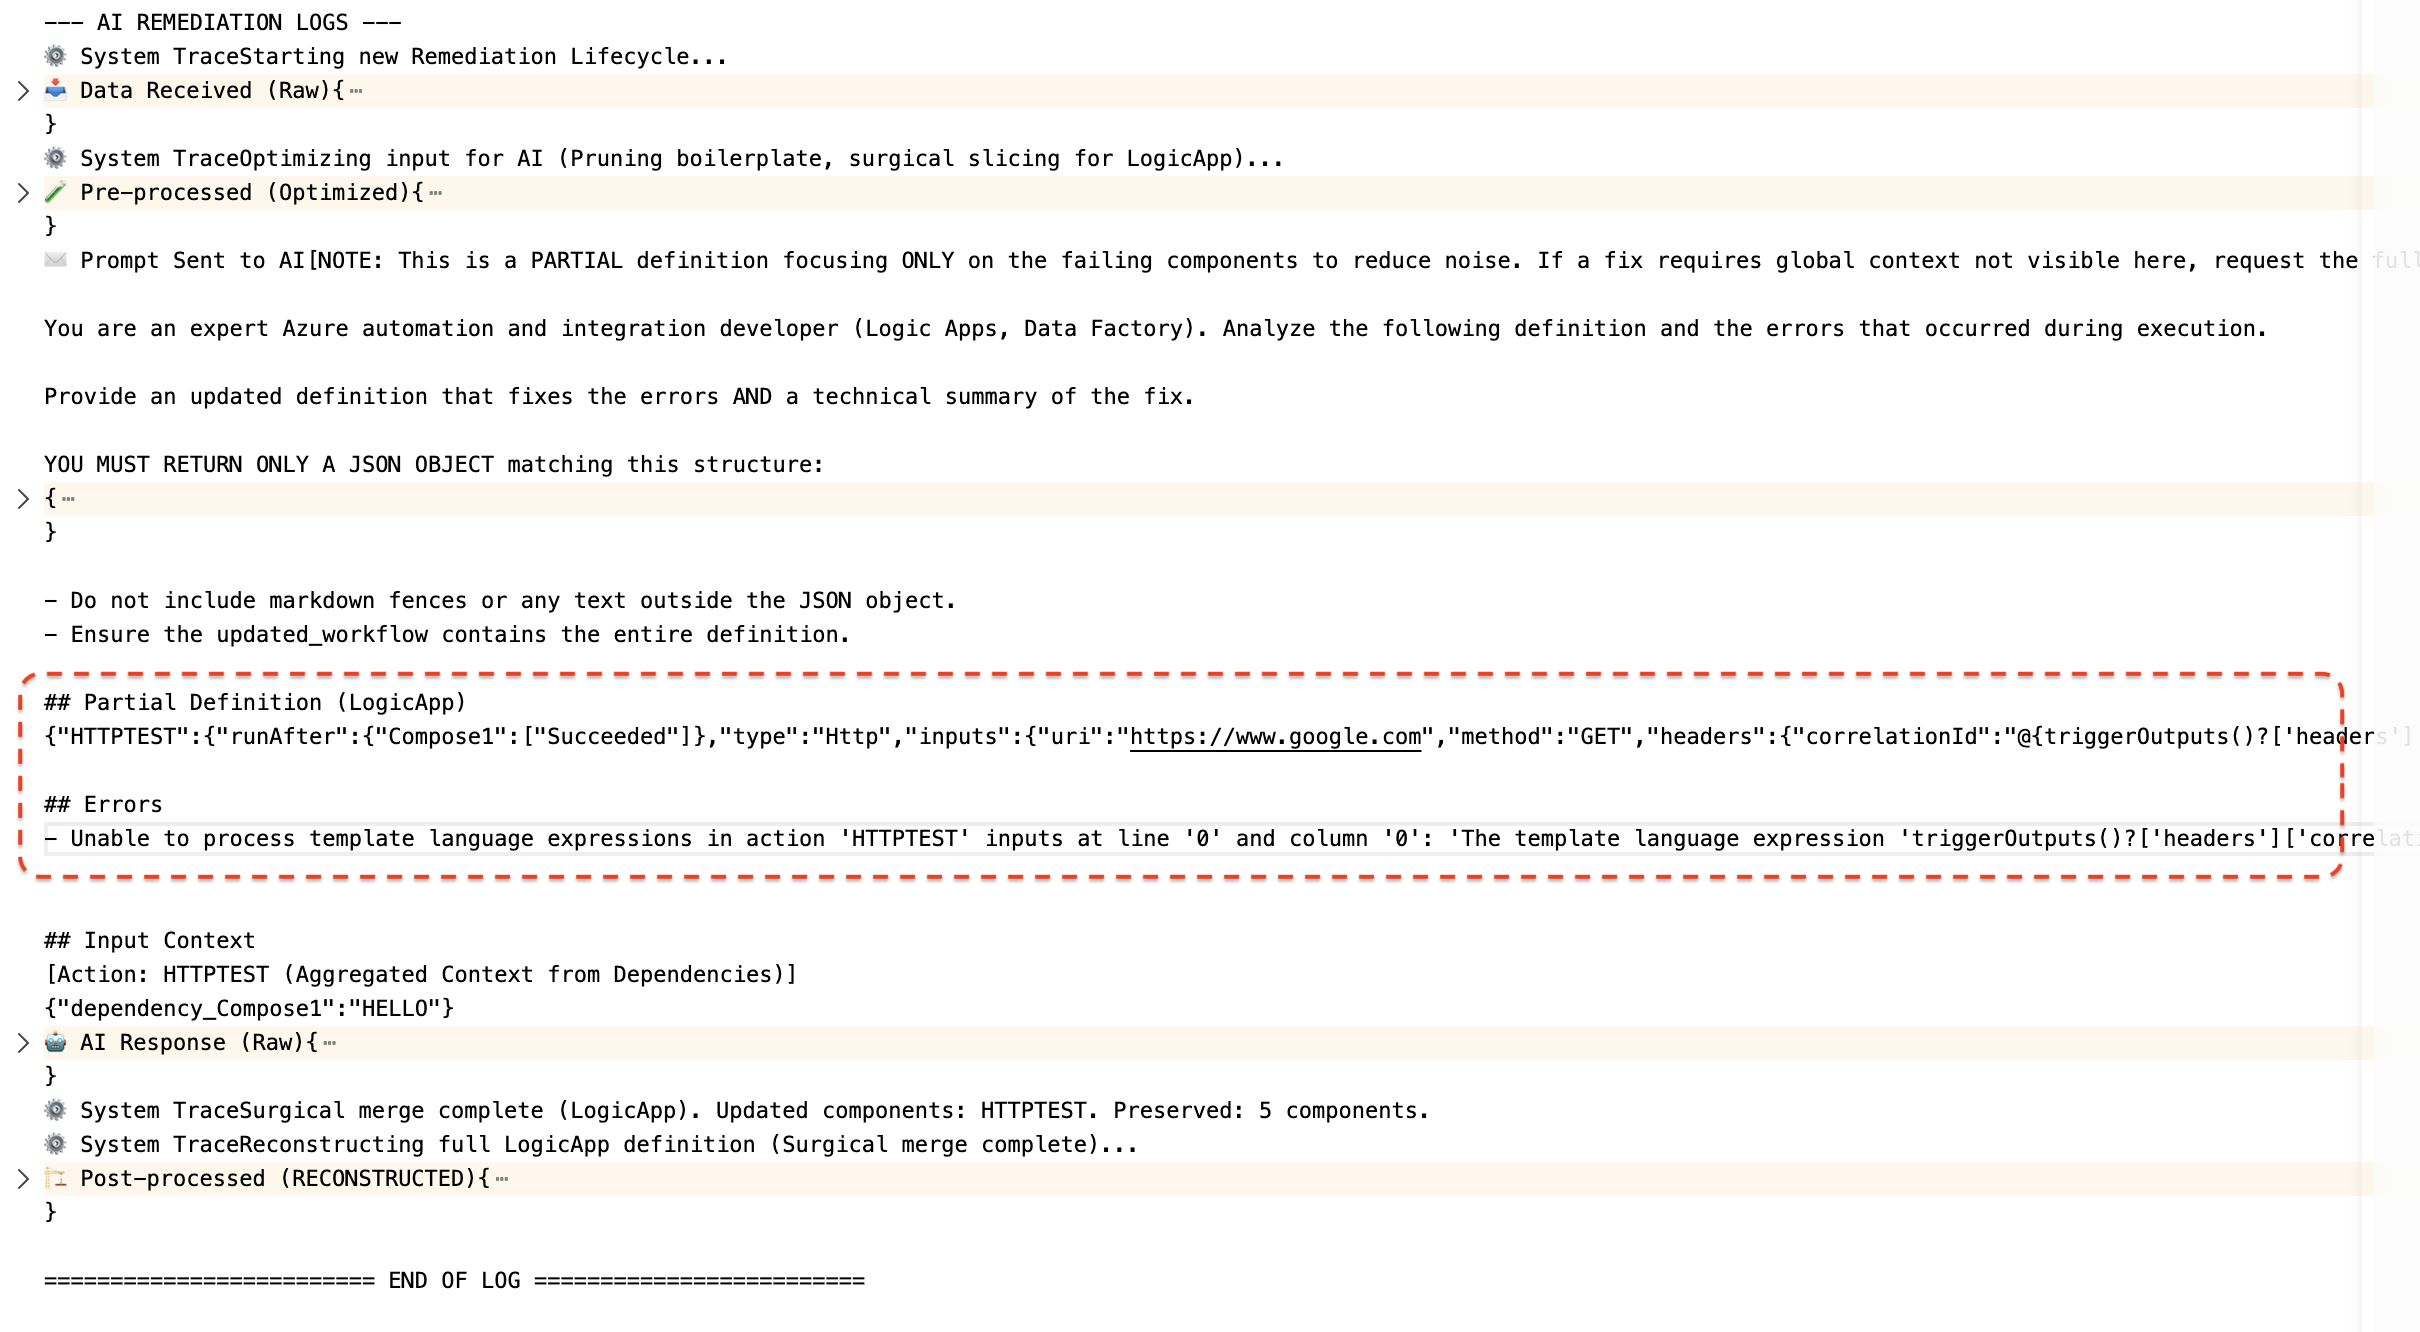
What happens internally — four stages:
Stage 1 — Surgical Slice
The extension does not send your entire workflow definition to the AI. A "Surgical Split" algorithm extracts only the failing actions and their immediate dependencies — drastically reducing token usage, cost, and data exposure.
Stage 2 — AI Generation
The sliced context and error details are sent to your chosen AI provider with a structured prompt. The AI returns:
- A Root Cause Analysis (RCA) for each failure
- A proposed code fix (patched JSON for the affected actions)
Stage 3 — Fallback (if needed)
If the AI response is empty or too short (< 50 characters), the full workflow definition is sent automatically as a fallback context for a second attempt using the same or next provider.
Stage 4 — Surgical Merge
The AI-returned fix is precisely merged back into the original, full workflow definition. Only the affected action definitions are replaced — all other actions, triggers, connections, and parameters are preserved exactly as-is.
The AI Console log in the dashboard lets you inspect every stage: the optimized input sent, the raw AI response, the provider and model used, and the final reconstructed definition.
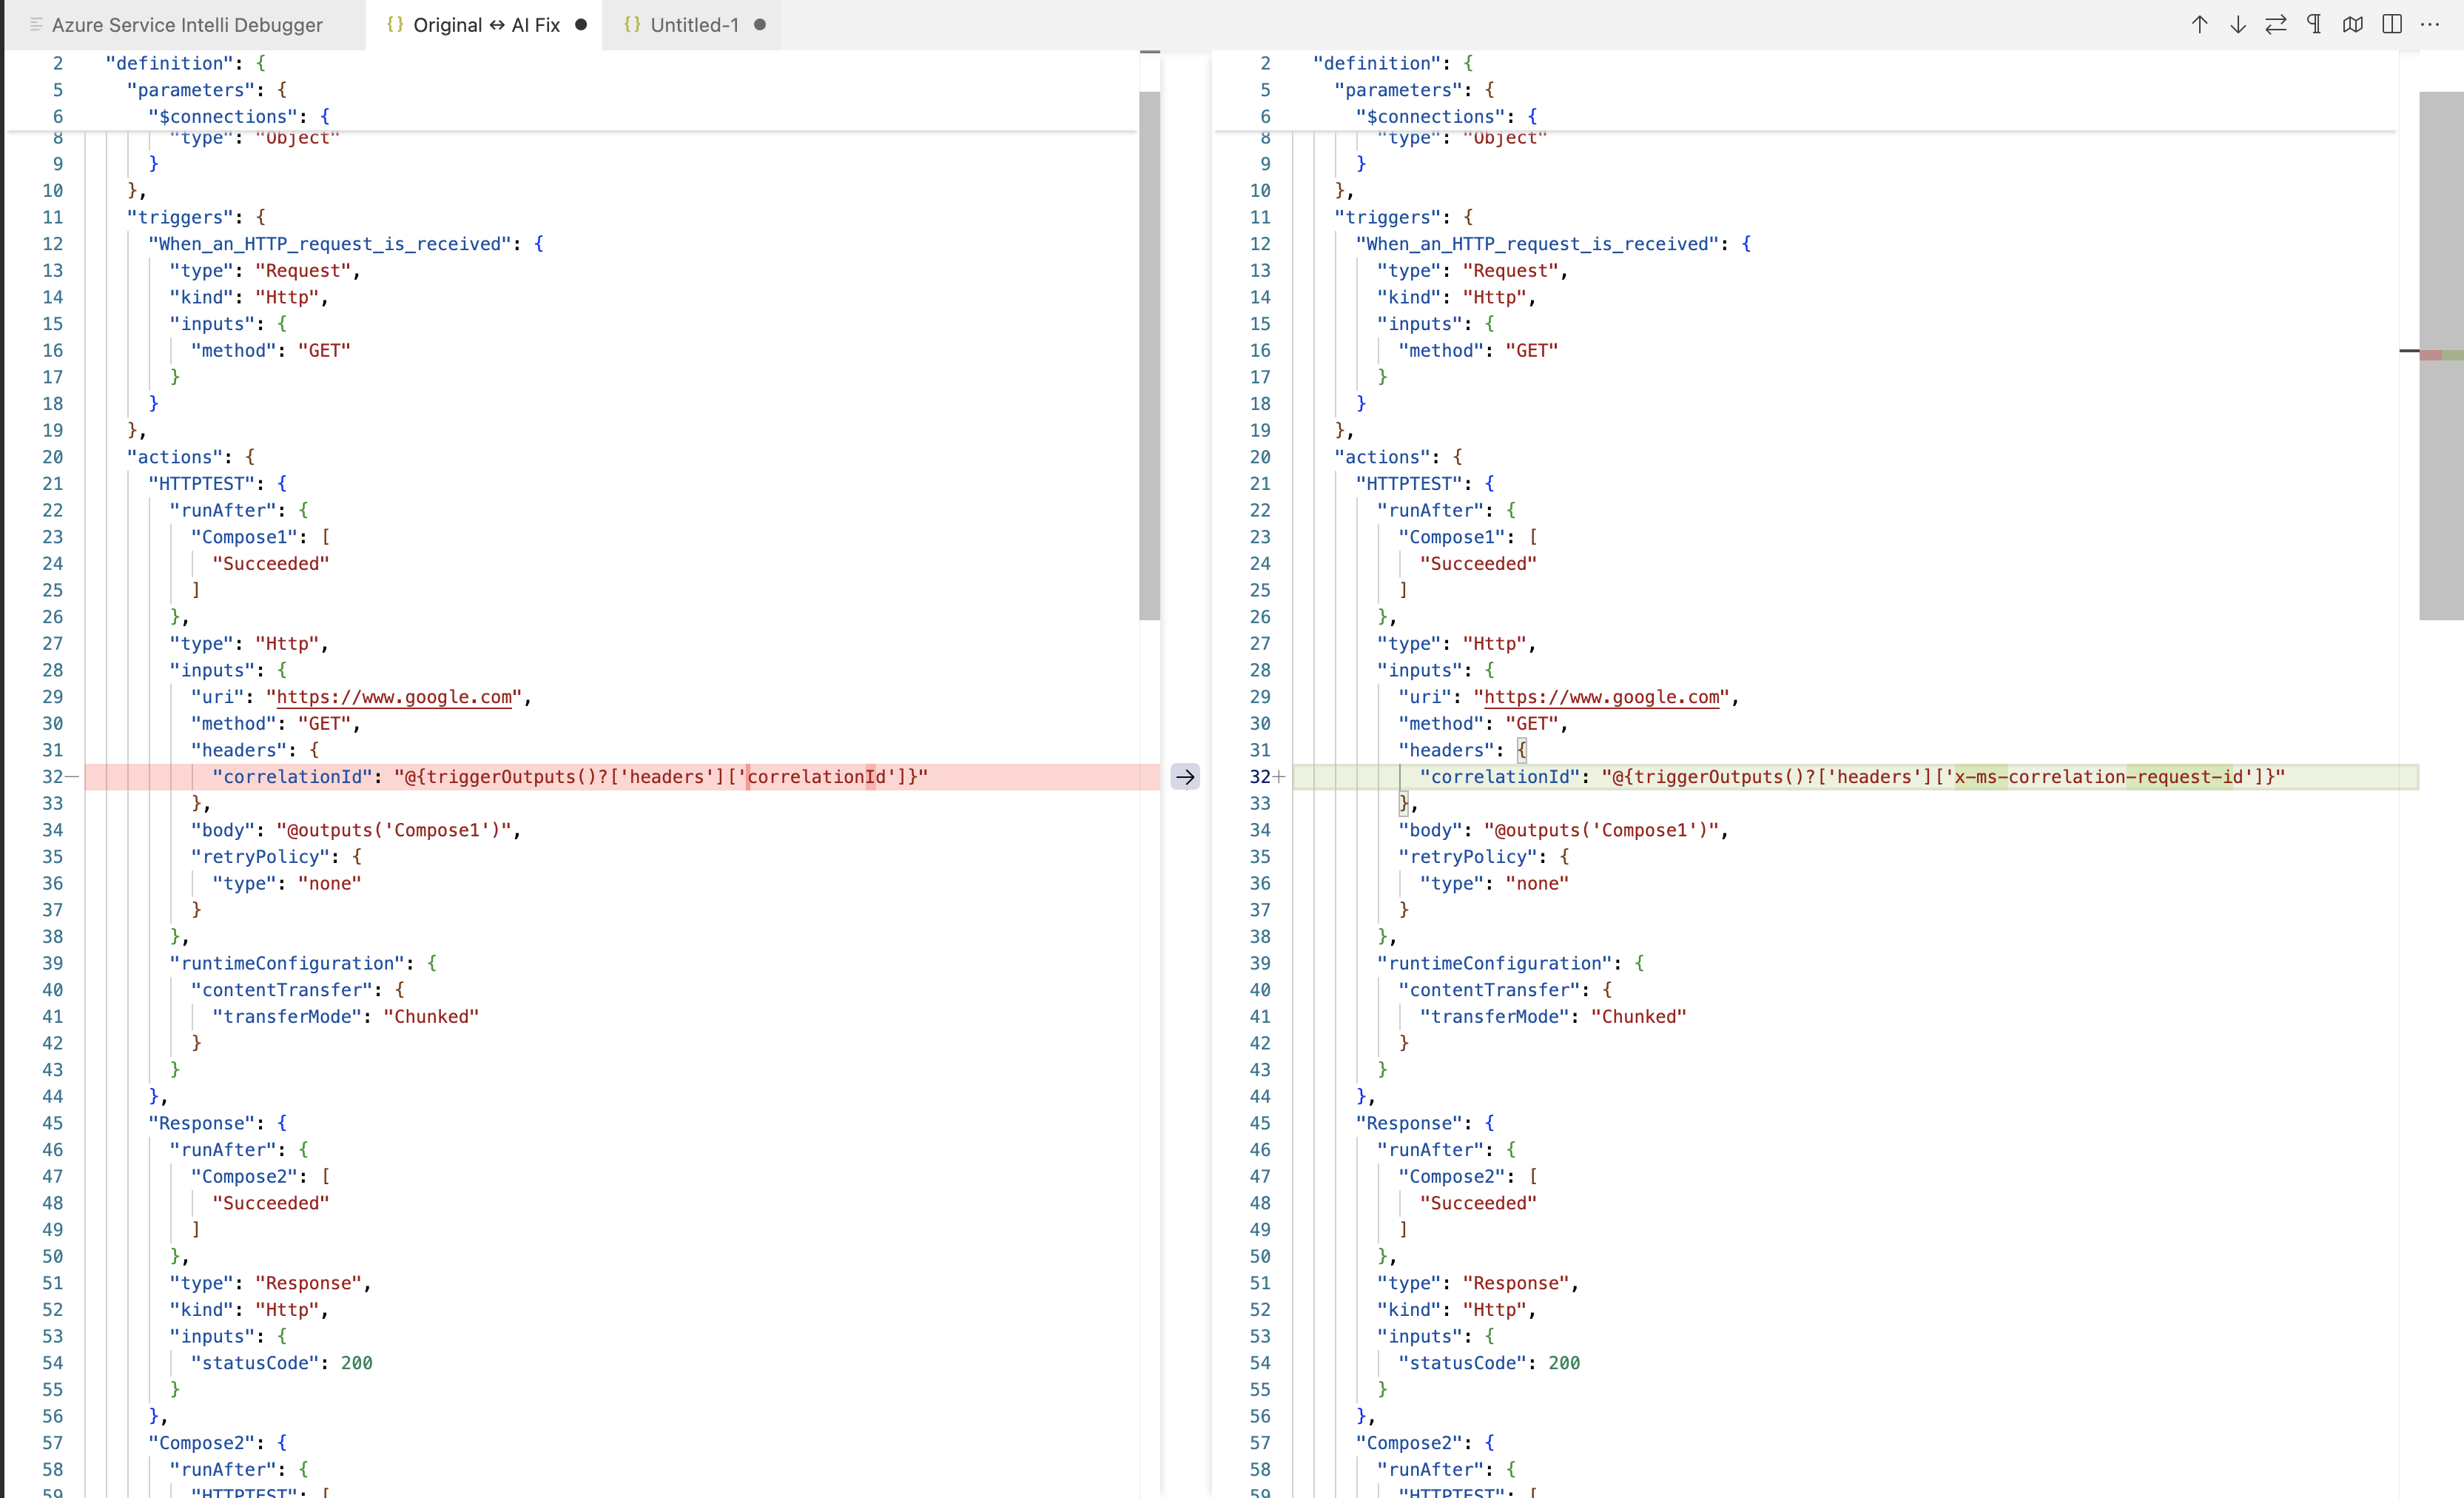
Step 6 — Review the Diff
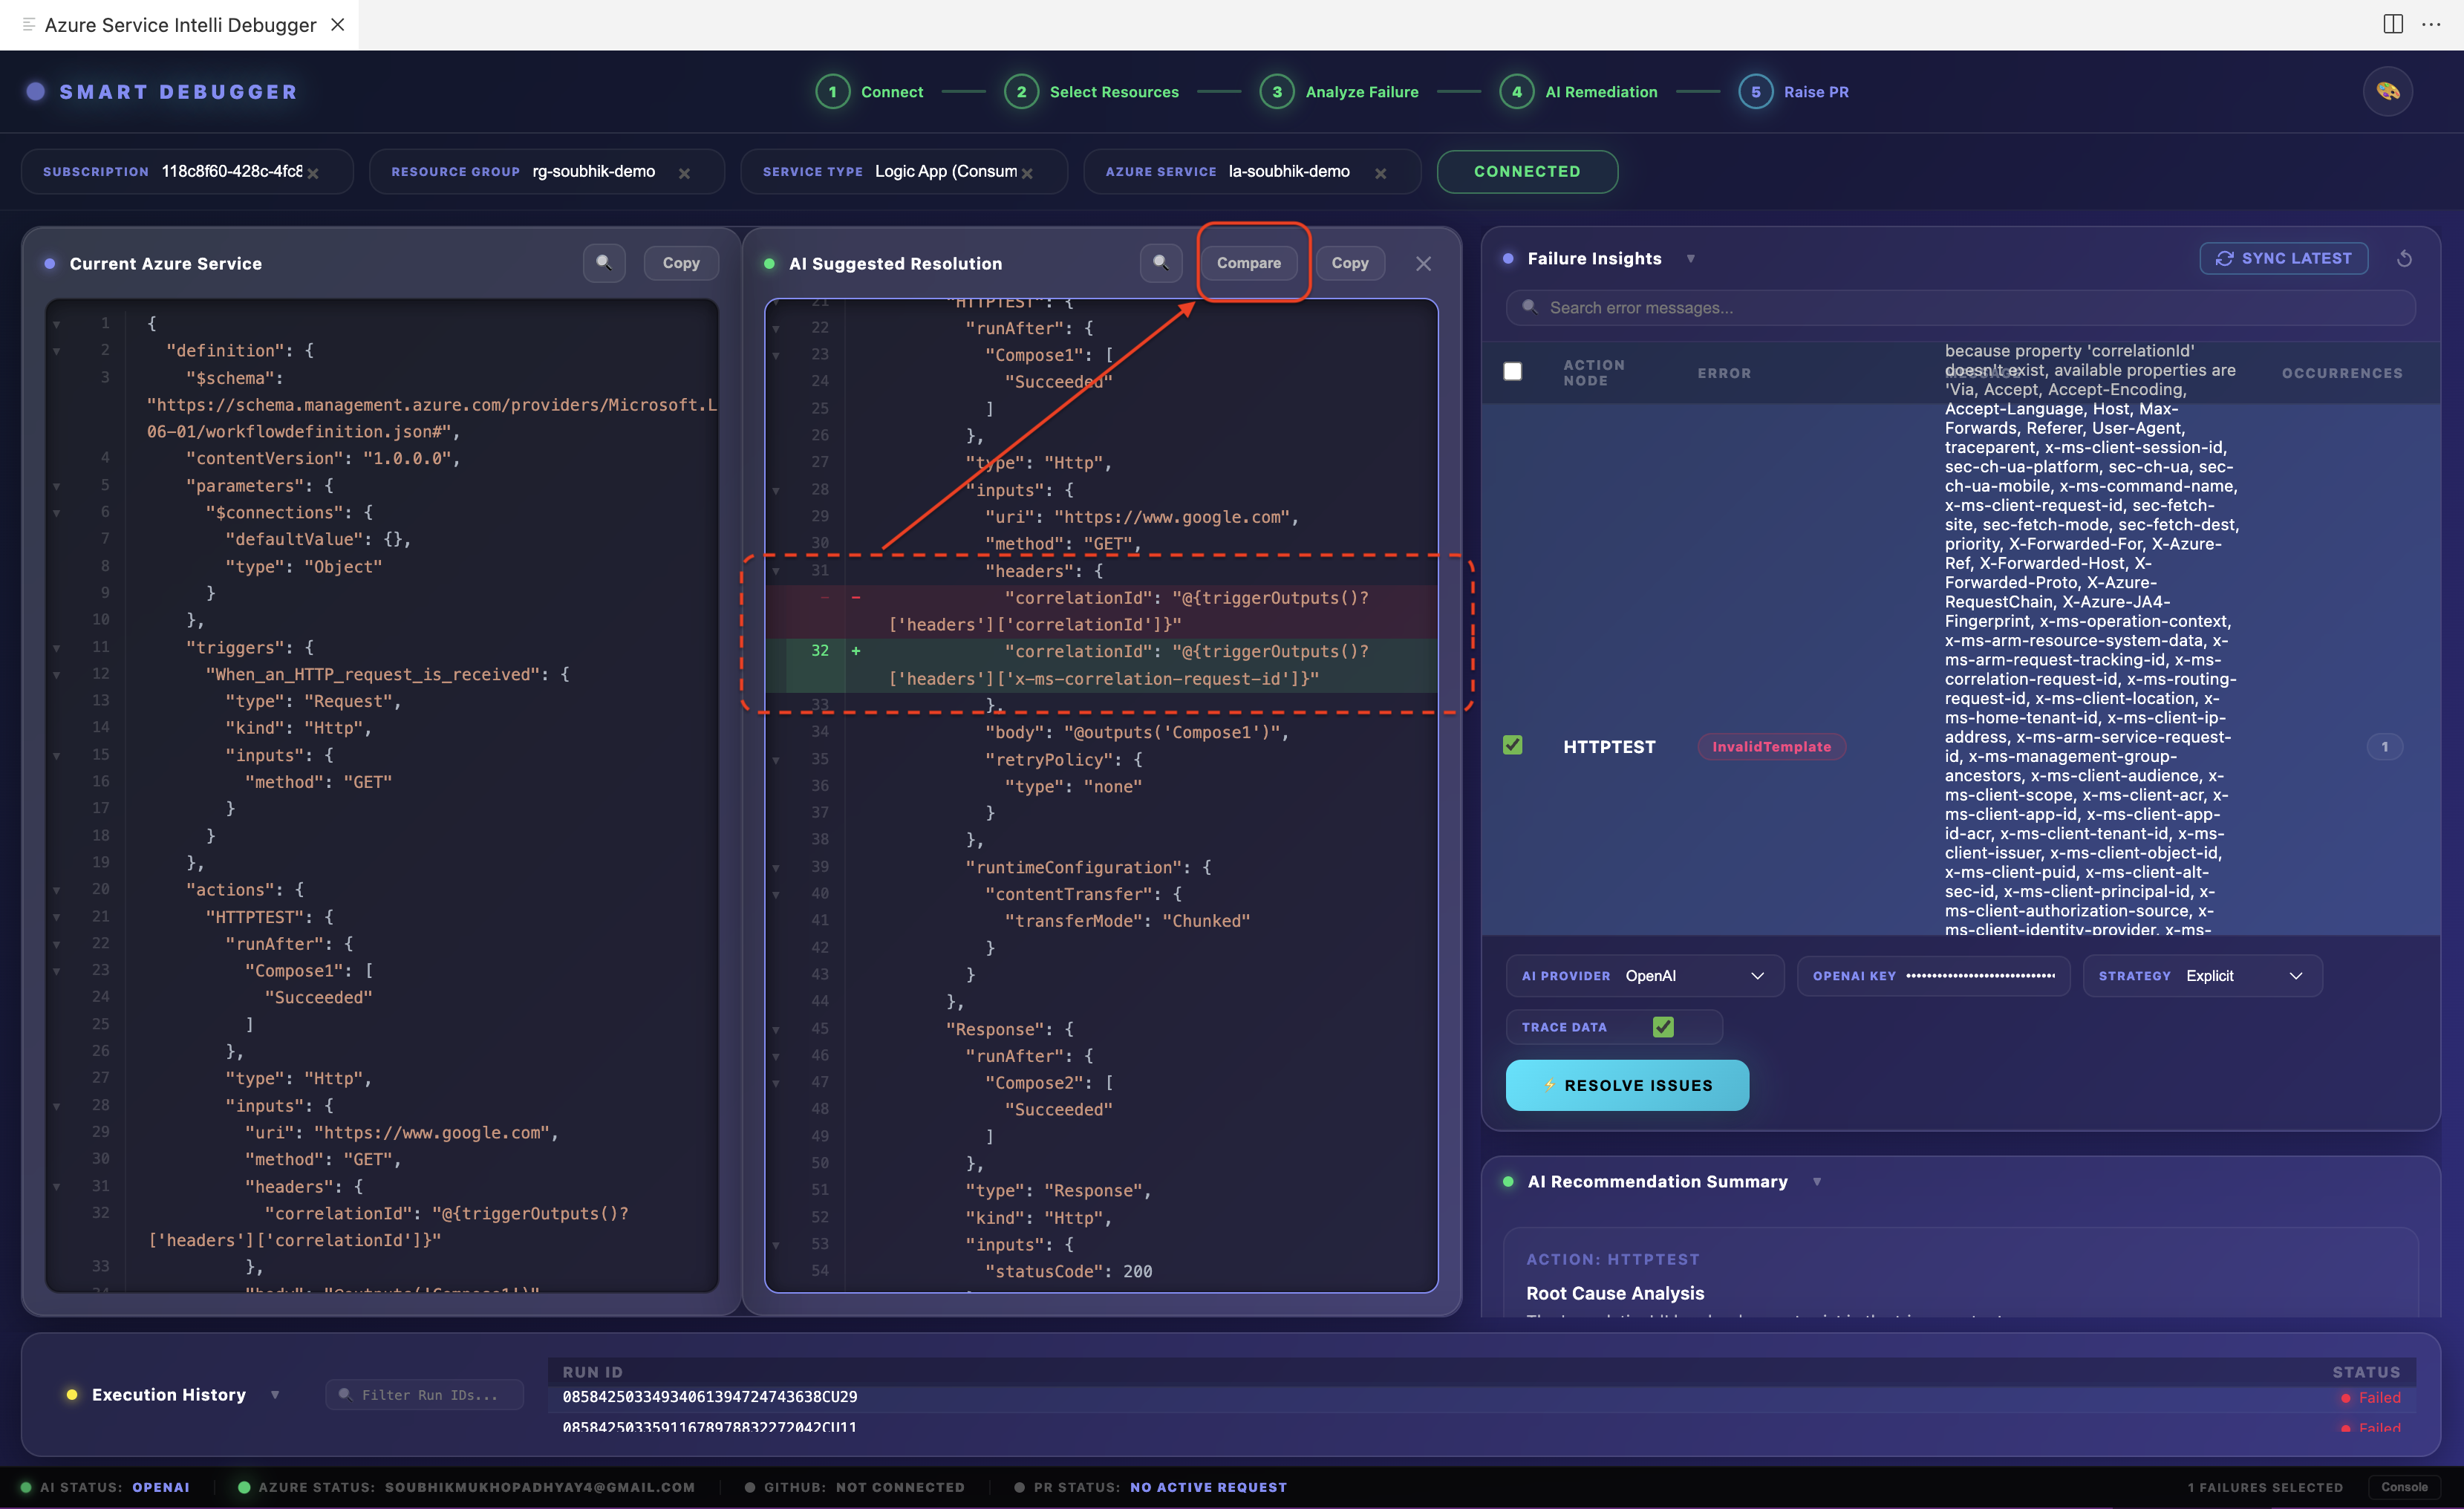
After self-healing completes, click Show Diff to open a VS Code diff editor:
- Left panel: The current (broken) workflow definition
- Right panel: The AI-proposed (fixed) workflow definition
Changes are shown at the action level. You can manually edit the right panel before proceeding. The dashboard also displays the Analysis Panel — a human-readable RCA summary per action, listed in plain language.
Step 7 — Raise a Pull Request
Once satisfied with the diff:
- Click Raise Pull Request in the dashboard.
- Fill in or confirm:
- PR Title (auto-generated from failure context, editable)
- PR Body (auto-generated with RCA summary, editable)
- Base Branch (e.g.,
main or master)
- Click Submit.
What the extension does automatically:
- Fetches the latest SHA of your base branch from GitHub.
- Creates a new feature branch named
ai-fix-<timestamp>.
- Commits the patched workflow file(s) to that branch (handles both new files and updates to existing files by fetching the current file SHA first).
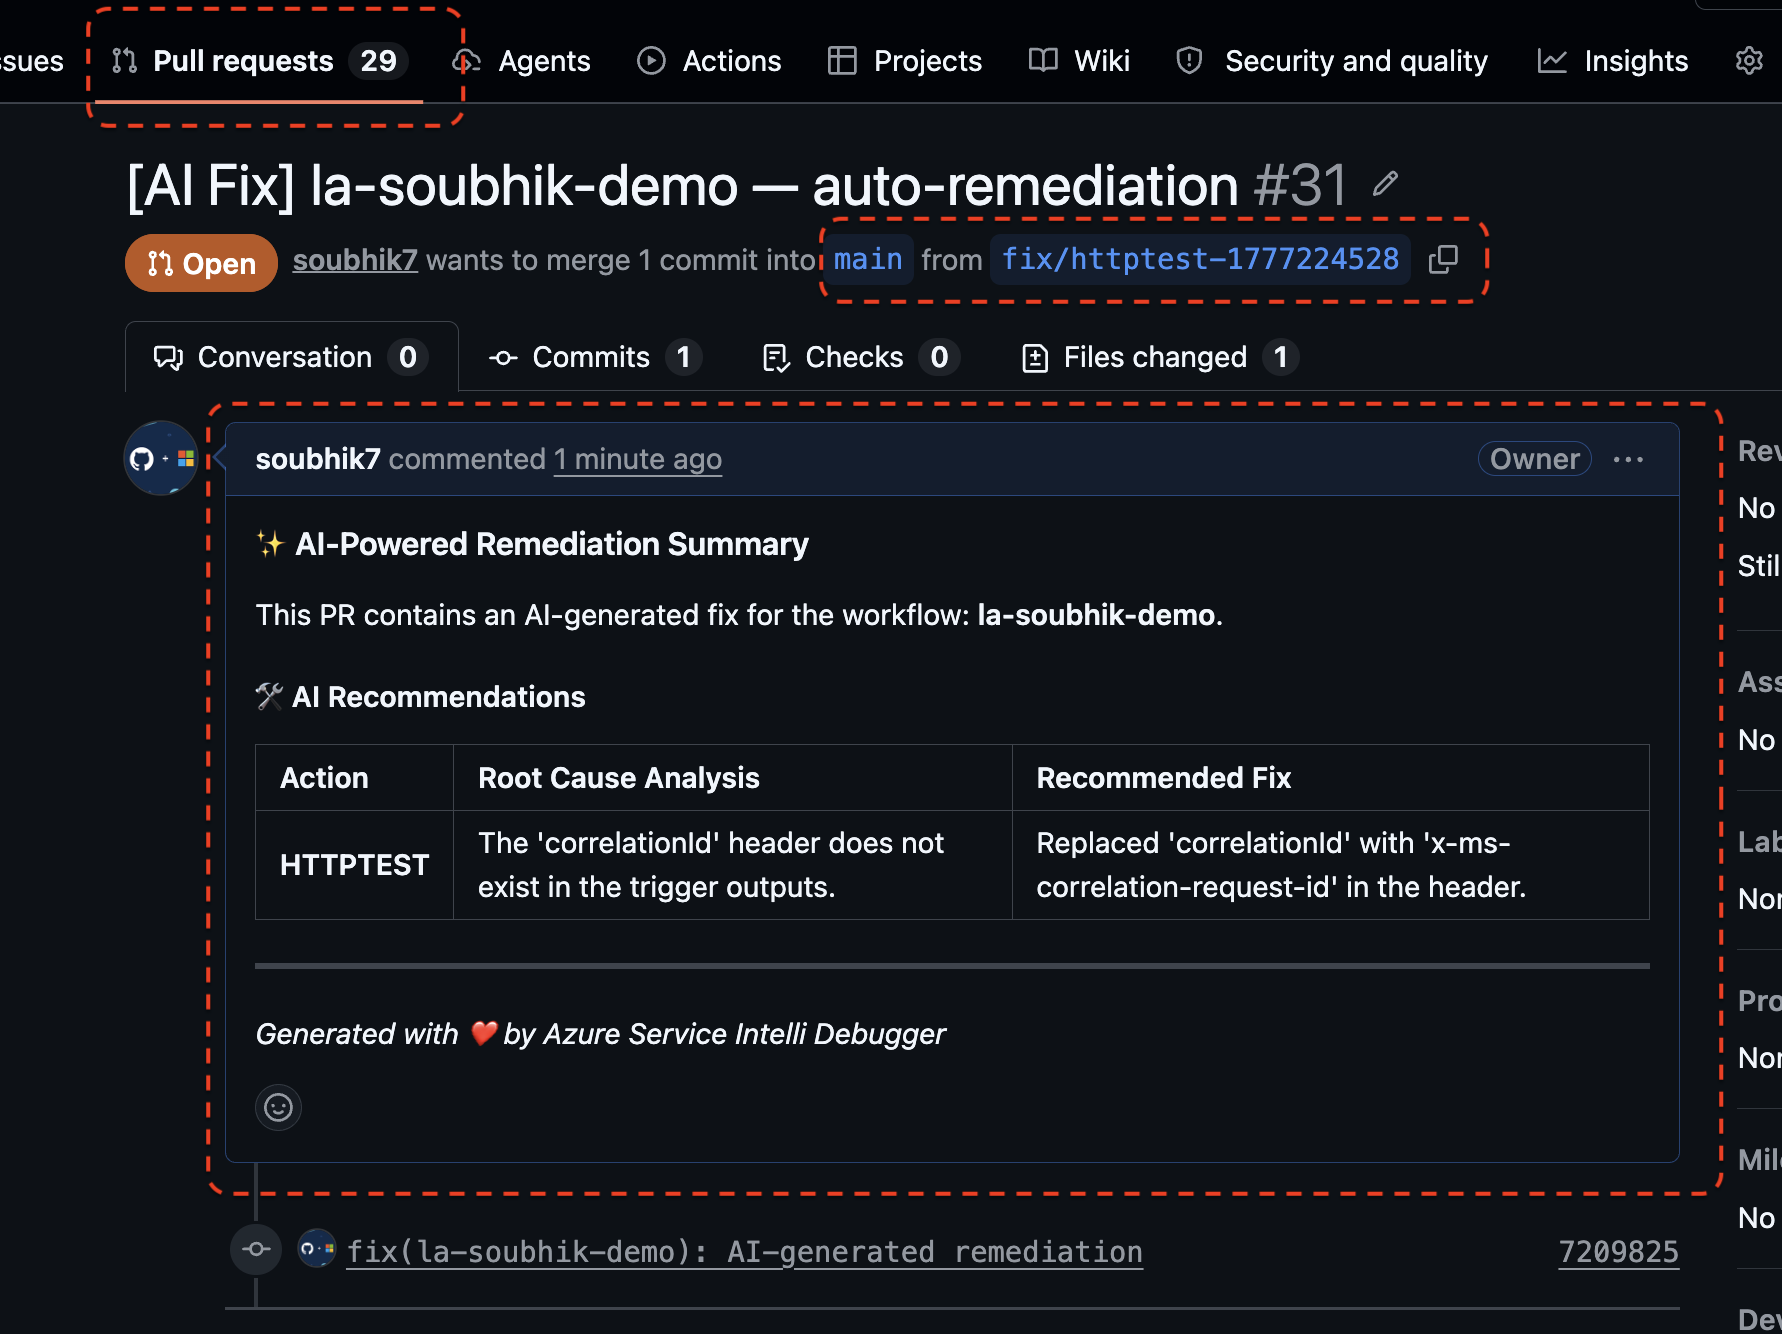
- Opens a Pull Request from the feature branch into your base branch.
A VS Code notification appears with a clickable link directly to the newly created PR on GitHub. The PR is raised under your own GitHub identity — every commit is attributed to you, providing a full audit trail.
No code is merged automatically. A human must review and approve the PR.
5. AI Providers In Detail
5.1 Google Gemini (Cloud)
- Model: Gemini 1.5 Pro (latest available)
- Setup: Set
smartLogicApp.googleApiKey in settings
- Privacy: Workflow data is sent to Google's API. Do not use if data must not leave your network.
- Best for: High-fidelity analysis of complex multi-action Logic App failures
5.2 OpenAI GPT (Cloud)
- Model: GPT-4 (latest available)
- Setup: Set
smartLogicApp.openaiApiKey in settings
- Privacy: Workflow data is sent to OpenAI's API. Do not use if data must not leave your network.
- Best for: Teams already using OpenAI infrastructure with enterprise data agreements
5.3 Ollama (Local / Air-Gapped)
- Models available: llama3.2:1b, llama3.2:3b, llama3:8b, mistral:7b
- Setup: Automatic on first use — no API key required
- Privacy: 100% local. No data leaves your machine.
- Auto-install: Supported on macOS (
.dmg), Windows (.exe), and Linux (install.sh). The extension detects your OS and installs the correct binary automatically.
- Service monitoring:
OllamaMonitor runs in the background to detect if the Ollama service stops and alerts you before you attempt analysis, preventing silent failures.
- Best for: Enterprises with strict data residency requirements, air-gapped environments, or developers who want zero cloud dependency
5.4 Isolated Custom AI (Local NumPy / PyTorch)
- Requires: Companion extension
soubhikdevtools.azure-smart-ai-model-extension
- Engines:
- NumPy — Lightweight, runs on any CPU, zero heavy dependencies
- PyTorch — Higher fidelity inference, GPU-accelerated when available
- Privacy: 100% local, isolated process — nothing leaves your machine
- Switching engines: When you select
custom_iso as your provider, a VS Code prompt lets you switch between NumPy and PyTorch without restarting VS Code
- IsolatedAiMonitor: Monitors the companion extension process health and reports status in the VS Code status bar
- Best for: On-device model training on your own organisation's failure history (Phase 2 capability)
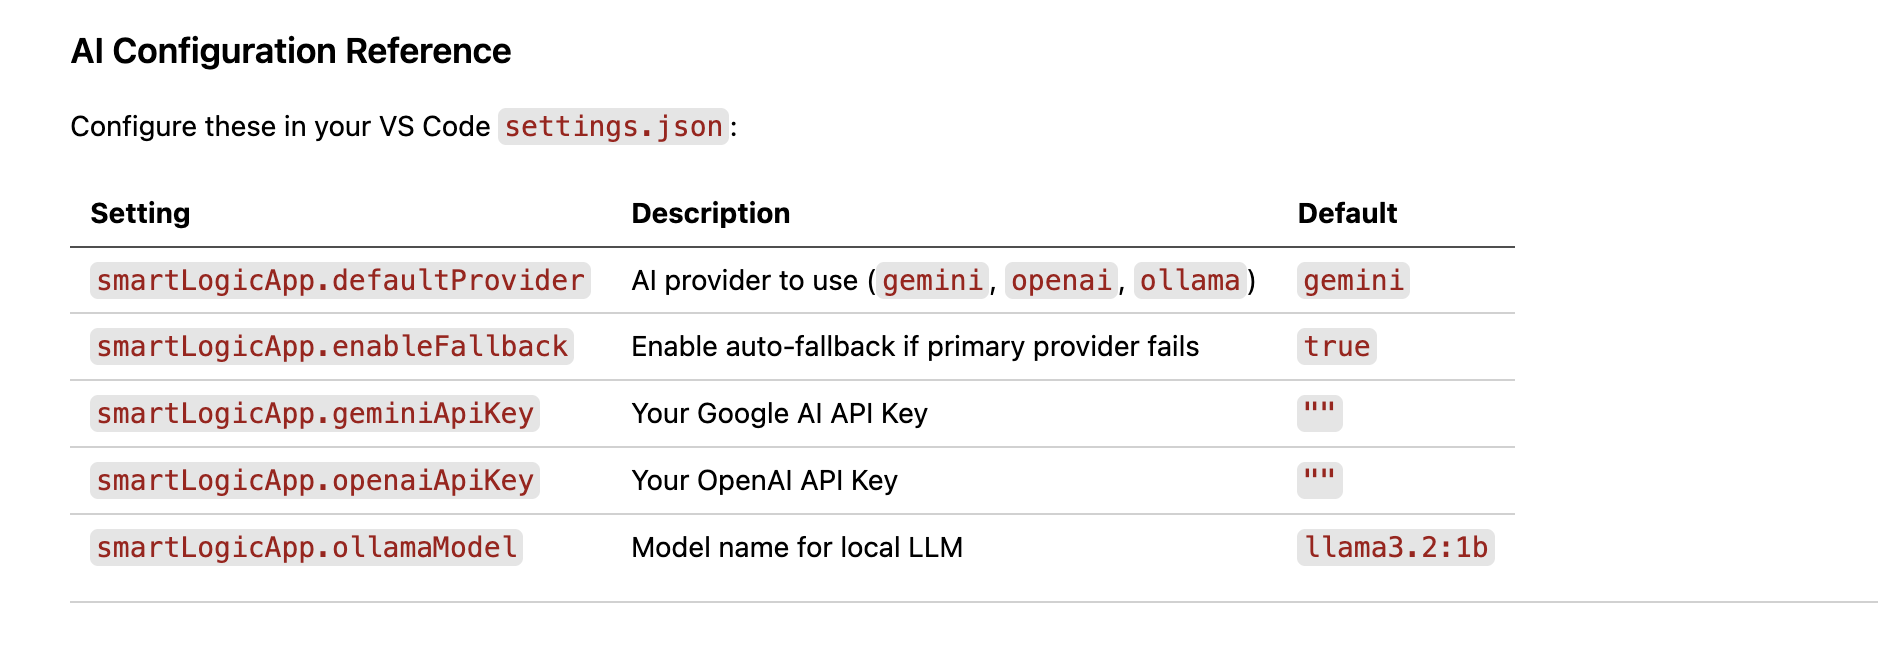
5.5 Automatic Provider Fallback
Enable smartLogicApp.enableFallback (default: true) to let the extension automatically switch providers if your primary choice fails.
Fallback order: Gemini → OpenAI → Ollama → Custom ISO
When a fallback is triggered:
- A VS Code warning notification identifies which provider was used instead.
- The AI Console log records
[FALLBACK TRIGGERED] with the original and actual provider names.
Set smartLogicApp.enableFallback to false for strict provider control (useful for data residency compliance).
6. Dashboard Themes
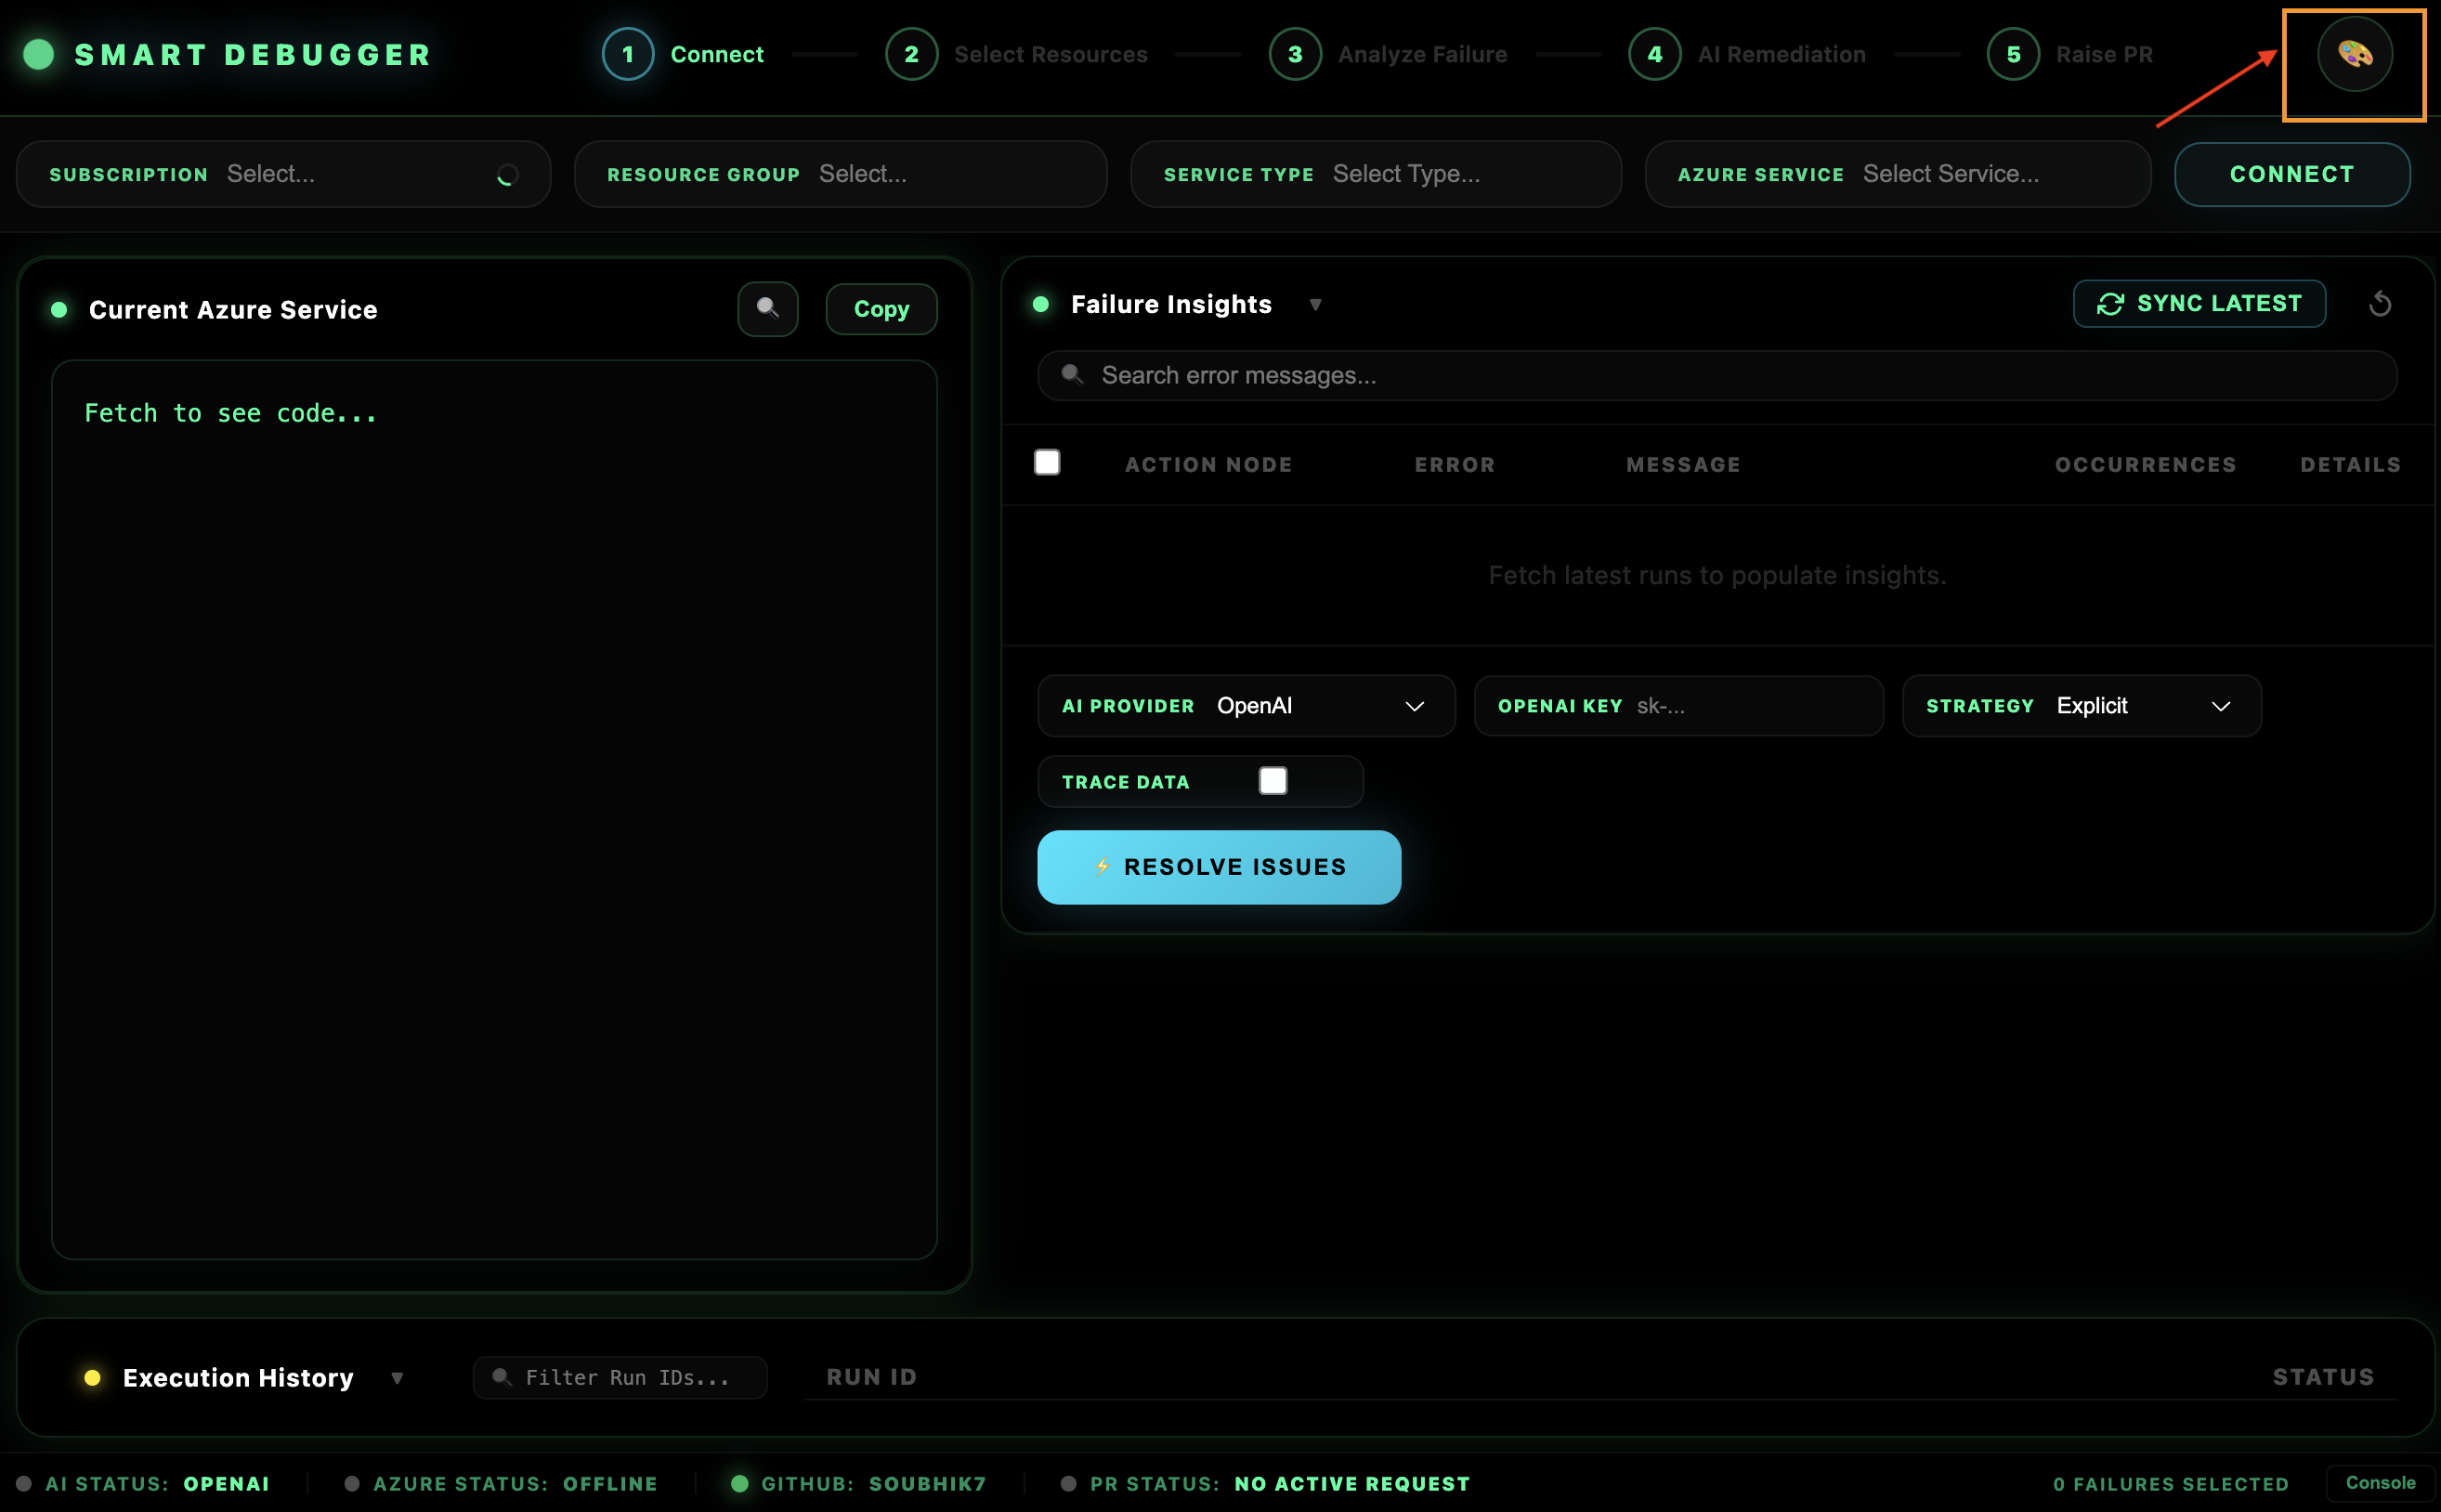
Set smartLogicApp.dashboardTheme in settings to change the visual style:
| Theme |
Description |
midnight |
Deep space dark with neon blue accents (default) |
cyber |
High contrast matrix-style green on black |
light |
Clean professional light mode |
glass |
Semi-transparent frosted glass with deep gradients |
Changes apply immediately on the next dashboard open.
7. All Commands Reference
Access any command via the Command Palette (Cmd+Shift+P / Ctrl+Shift+P):
| Command |
Description |
Azure Smart Debugger: Open Dashboard |
Opens the main unified dashboard panel |
Azure Smart Debugger: Show Observability Panel |
Alias — opens the same unified dashboard |
Azure Smart Debugger: Select AI Model |
Alias — opens the same unified dashboard |
Azure Smart Debugger: Run Self-Healing |
Alias — opens the same unified dashboard |
Azure Smart Debugger: Review & Approve Changes |
Alias — opens the same unified dashboard |
Azure Smart Debugger: GDPR - Export My Data |
Exports all stored personal data to a JSON file |
Azure Smart Debugger: GDPR - Delete My Data |
Permanently deletes all stored personal data |
All workflow actions (connect, analyse, heal, raise PR) are performed inside the dashboard UI — you do not need to remember individual command IDs for day-to-day use.
8. All Settings Reference
Open settings with Cmd+, / Ctrl+, and search Smart Logic App, or edit settings.json directly:
| Setting |
Type |
Default |
Description |
smartLogicApp.defaultProvider |
enum |
openai |
Primary AI provider: gemini, openai, ollama, custom_iso |
smartLogicApp.googleApiKey |
string |
"" |
Google Gemini API key (stored in OS keychain, not in settings.json) |
smartLogicApp.openaiApiKey |
string |
"" |
OpenAI API key (stored in OS keychain, not in settings.json) |
smartLogicApp.enableFallback |
boolean |
true |
Auto-switch to next available provider on failure |
smartLogicApp.ollamaModel |
enum |
llama3.2:1b |
Local Ollama model: llama3.2:1b, llama3.2:3b, llama3:8b, mistral:7b |
smartLogicApp.githubRepo |
string |
"" |
GitHub repository for PRs, format: owner/repo |
smartLogicApp.azureTenant |
enum |
common |
Azure tenant: common, organizations, consumers |
smartLogicApp.azureClientId |
string |
PowerShell client ID |
Azure app client ID. Use 1950a258-... for personal accounts, 04b07795-... for org-only |
smartLogicApp.dashboardTheme |
enum |
midnight |
Dashboard theme: midnight, cyber, light, glass |
9. GDPR & Privacy Controls
The extension provides two built-in GDPR commands accessible from the Command Palette.
Export My Data
Azure Smart Debugger: GDPR - Export My Data
Exports all data the extension has stored about you to a .json file. A Save dialog lets you choose the destination. The export includes:
- Your GDPR consent timestamp
- Your current extension settings (non-sensitive fields only — API keys are excluded)
- The in-memory security audit log (event history)
Delete My Data
Azure Smart Debugger: GDPR - Delete My Data
Permanently and irreversibly deletes:
- Your GDPR consent record
- Any cached healing results stored in VS Code global state
- The in-memory security audit log
A modal confirmation dialog prevents accidental deletion. If the dashboard is open, it is automatically cleared after deletion.
Data retention policy: The extension does not persist raw Azure logs or workflow definitions beyond the current session. Data used during analysis is held only in memory and is discarded when VS Code closes. Any cached data is subject to a 90-day maximum retention limit enforced programmatically.
10. Security Architecture (Read Before You Connect)
Security is a first-class design principle, not an afterthought. This section documents every security mechanism in the extension so you can make an informed decision about using it in your enterprise environment.
10.1 Azure Authentication Security
OAuth2 Device Code Flow — your password never enters VS Code.
When you click "Connect to Azure", the extension requests a device code from Microsoft's identity platform. You enter that code in your browser at microsoft.com/devicelogin. The extension receives only a short-lived OAuth2 access token — it never sees your username or password.
Bearer Token Handling:
- Tokens include an automatic
Bearer prefix and are validated to be at least 50 characters (JWT minimum length) before use.
- Tokens are stored using VS Code's internal session handler, which encrypts them using OS-level facilities.
- Tenant IDs are validated against a strict GUID regex or an allowlist (
common, organizations, consumers) before being passed to any CLI or API call, preventing command injection.
RBAC Respect: The extension calls Azure ARM APIs using your own token. It can only access resources your account has Reader or Contributor rights to. No elevated permissions are ever requested or required.
10.2 API Key Storage
Cloud AI API keys (Google Gemini, OpenAI) are stored exclusively via the VS Code Secret Storage API:
- On macOS: macOS Keychain
- On Windows: Windows Credential Manager
- On Linux: libsecret / Secret Service API
Keys are never written to settings.json, workspace files, or any file on disk in plaintext. If you inspect settings.json, the smartLogicApp.googleApiKey field will be blank — the actual secret is held in the OS keychain.
10.3 GitHub Integration Security
No Personal Access Tokens (PATs) required.
GitHub connection uses VS Code's built-in GitHub Authentication Provider — the same mechanism used by GitHub Copilot. This provider follows the OAuth2 authorization code flow with PKCE, managed entirely by Microsoft.
Minimum Scopes: Only repo (to create branches, commit files, and open PRs) and user (to attribute commits to your identity) are requested. No admin, delete, or webhook permissions are ever requested.
Identity Integrity: Every commit created by the extension is made under your authenticated GitHub token — automated commits are not anonymous and appear in the PR history under your name.
Input Validation on PR Creation:
| Field |
Limit |
| PR title |
Max 256 characters |
| PR body |
Max 65,536 characters |
| Files per PR |
Max 100 files |
| Individual file size |
Max 1 MB |
| File paths |
No .. traversal, no absolute paths, no backslashes |
10.4 Webview & Message Security
The dashboard runs inside a VS Code webview. All inter-process messages between the webview and the extension host are protected by CSRF (Cross-Site Request Forgery) tokens:
- A cryptographically random 64-character hex token is generated using Node.js
crypto.randomBytes(32) when the dashboard opens.
- Every message sent from the webview must include this token.
- The extension host validates incoming tokens using
crypto.timingSafeEqual — a constant-time comparison that prevents timing-based oracle attacks.
- Tokens expire after 1 hour as an absolute maximum session bound.
- After sensitive operations, tokens are rotated automatically.
XSS Protection: All HTML content rendered inside the dashboard is processed through a sanitiser that strips:
<script> tags and their content- All inline event handlers (
onclick, onload, etc.)
javascript: protocol links<iframe>, <object>, <embed>, and <applet> tags<style> tags
Path Traversal Prevention: All file paths submitted through the dashboard are validated to reject absolute paths, .. sequences, Windows drive letters, null bytes, double slashes, and paths longer than 255 characters.
10.5 Data Privacy & Local AI
Zero data egress with local AI providers.
When using Ollama or the Isolated Custom AI engine, all reasoning occurs on your local machine. Your Azure workflow definitions, error logs, and runtime input/output data never leave your environment.
This mode satisfies:
- Enterprise data residency requirements
- Air-gapped network environments
- GDPR and regional data sovereignty laws
For cloud AI providers (Gemini / OpenAI), only the surgically extracted subset of your workflow (the failing actions and their immediate context) is transmitted — not the entire workflow definition.
Ollama Installer Security:
- Users are shown an explicit consent dialog before any files are downloaded.
- SHA-256 checksum verification is performed on downloaded binaries.
- The user consent decision is logged in the security audit log.
All user-supplied and API-supplied inputs are validated before use:
| Input |
Validation Rule |
| Azure Subscription ID |
Must match GUID regex xxxxxxxx-xxxx-xxxx-xxxx-xxxxxxxxxxxx |
| Azure Resource Name |
Alphanumeric + hyphens/underscores, 1–64 chars |
| GitHub Repository |
Must match owner/repo pattern |
| GitHub Token |
Minimum 20 characters, validated character set |
| Bearer Token |
Must be present, minimum 50 characters |
| Tenant ID |
Must be a GUID or common/organizations/consumers |
| AI Response Size |
Capped at 1 MB to prevent memory exhaustion |
| Request Size |
Capped at 10 MB |
Error messages returned to the UI are sanitised — internal stack traces and sensitive details are never exposed to the webview.
10.7 Audit Logging
A security audit log records all significant events in memory during the session:
- GDPR consent grants and revocations
- User data export and deletion events
- CSRF token validation failures
- Ollama installer consent decisions
- Checksum verification results
The log is capped at 1,000 entries (circular buffer — oldest entries are discarded first). You can export it at any time with the GDPR Export command. It is cleared by the GDPR Delete command.
In production mode (NODE_ENV=production), the general log level is WARN — debug output is suppressed. Security events are always logged regardless of log level.
10.8 GDPR Compliance
| GDPR Principle |
Implementation |
| Lawful basis |
Explicit user consent obtained via modal dialog on first use |
| Right to access |
Export command provides a complete JSON export of all stored data |
| Right to erasure |
Delete command irreversibly removes all stored data with modal confirmation |
| Data minimisation |
Only settings references and the audit log are stored — no raw Azure logs or workflow definitions are persisted |
| Retention |
90-day retention enforced programmatically for any cached data |
10.9 Human-in-the-Loop Governance
No AI fix is ever applied automatically.
The self-healing engine generates a proposed patch. That patch is presented in a diff viewer for human review. The only way the fix reaches your codebase is through a GitHub Pull Request that a human must review and approve. This is a hard architectural guarantee — there is no "auto-apply" mode.
This design ensures that every AI-generated remediation goes through your existing code review process, change management controls, and branch protection rules before it affects any environment.
11. Feature Phases
11.1 Phase 1 — Core Capabilities (Current)
Phase 1 establishes a robust foundation for Azure service monitoring and cloud-based AI integration.
- Unified Monitoring Dashboard with live run history and observability panel
- Azure Logic Apps Standard support (workflow-level analysis)
- Azure Logic Apps Consumption support (trigger-level analysis)
- Azure Data Factory pipeline support (activity-level analysis)
- Cloud AI integration: Google Gemini and OpenAI GPT-4
- Local AI integration via Ollama with one-click auto-install (macOS/Windows/Linux)
- Surgical context slicing for minimal AI token usage and cost
- Multi-stage AI prompting with automatic fallback to full context
- Surgical merge: precise patching of only affected actions
- Automatic multi-provider fallback chain
- VS Code diff editor integration for fix review
- Automated GitHub Pull Request creation via Octokit
- GDPR data management: export and delete commands
- Status bar AI provider indicator with health status
- Four dashboard themes: midnight, cyber, light, glass
- Security audit logging with circular buffer
- CSRF and XSS protection for the webview
- OS keychain-backed API key storage
11.2 Phase 2 — Azure Smart AI Model (Custom Isolated)
Phase 2 introduces the Azure Smart AI Model, a specialised companion extension (soubhikdevtools.azure-smart-ai-model-extension) for organisations requiring maximum isolation and custom model tailoring.
What it adds:
- Custom Isolated Engine: A standalone AI engine built using NumPy and PyTorch that runs entirely within your local environment — no cloud connectivity required.
- Proprietary Model Training: Train the model on your specific organisation's historical logs and failure patterns for more accurate remediation than any general-purpose LLM.
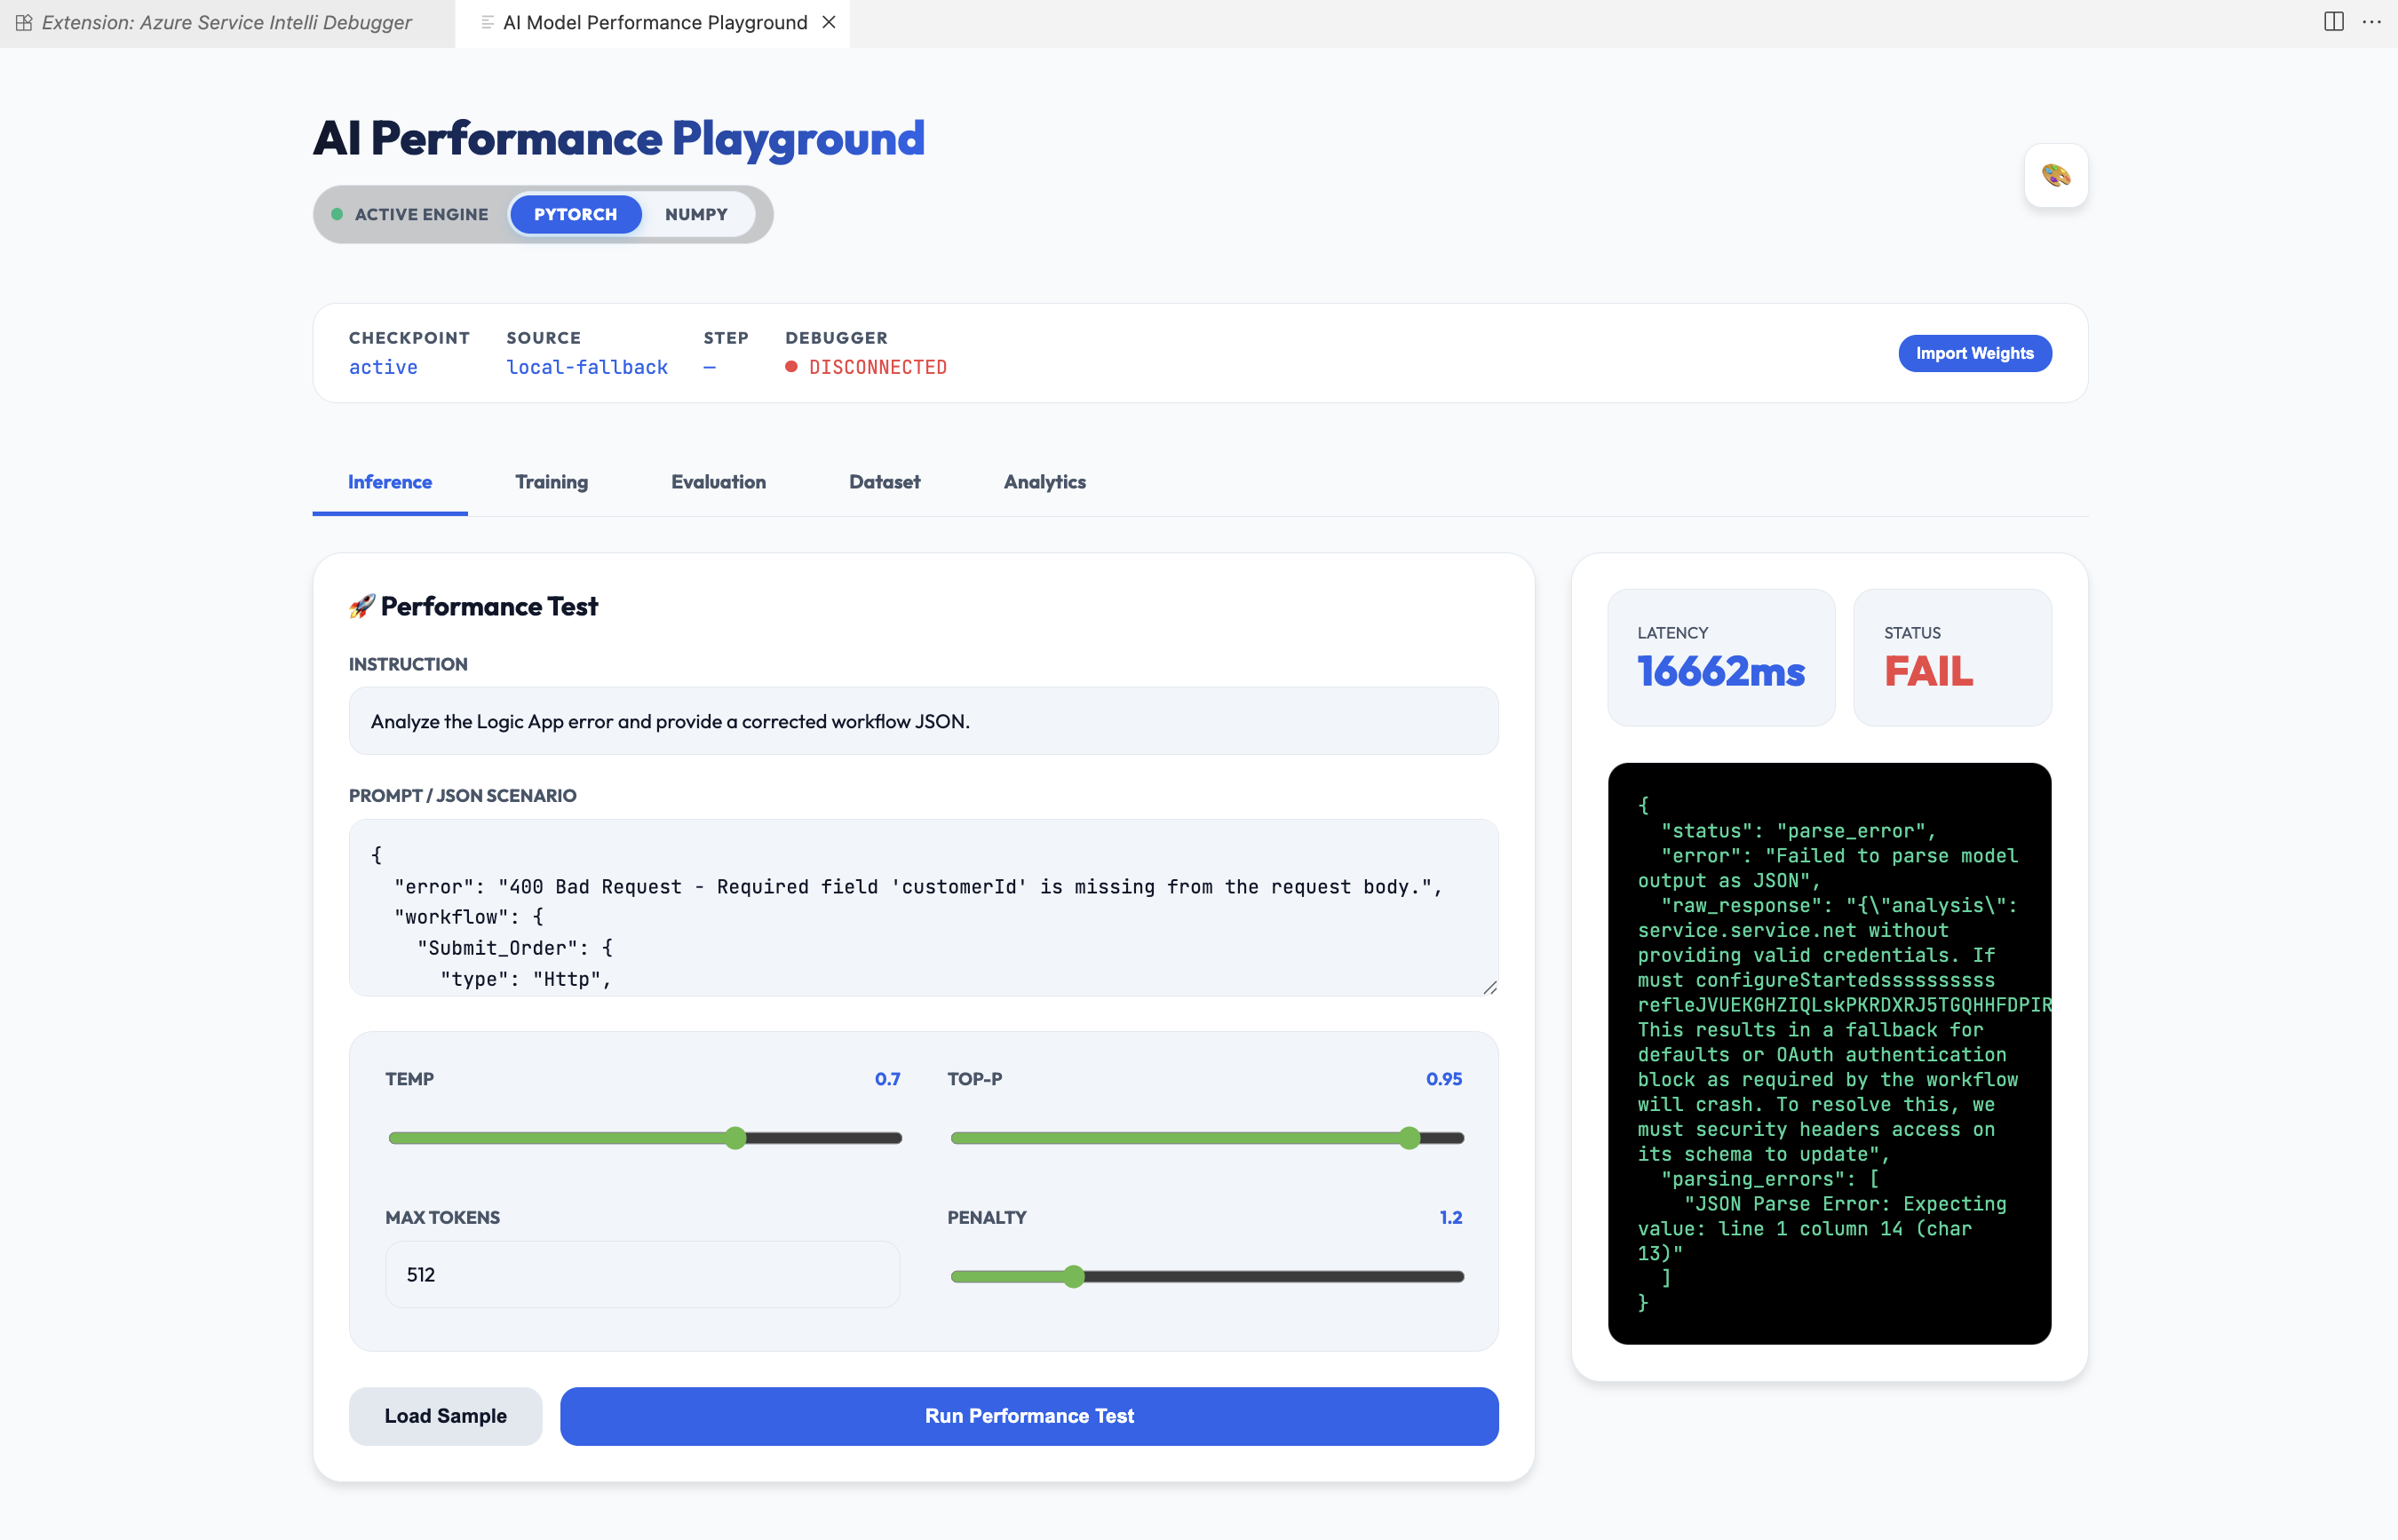
- Engine Selection: Switch between NumPy (CPU, lightweight, zero heavy dependencies) and PyTorch (GPU-accelerated, higher fidelity) from a VS Code prompt without restarting.
- Performance Playground: A dedicated interface to test and compare model inference speed and accuracy across NumPy and PyTorch engines.
- IsolatedAiMonitor: Background health monitoring for the companion extension process, with status bar reporting.
Model Training Workflow:
- Collect historical execution logs from Azure Monitor for your Logic Apps and ADF pipelines.
- Preprocess — Use the Kaggle-integrated pipeline to clean, label, and structure failure modes into training data.
- Train — Run the NumPy-based neural network training pipeline on your local hardware using your labelled dataset.
- Deploy — Export the trained model weights and deploy them directly into the companion extension.
- Infer — The companion extension uses the deployed weights for all subsequent healing analysis, producing remediation suggestions tuned to your organisation's specific patterns.
Why this matters:
A general-purpose LLM has never seen your organisation's specific connector configurations, custom APIs, or recurring failure patterns. A model trained on your own Azure Monitor data will recognise those patterns and propose fixes that are directly informed by what has worked before in your environment.
12. Future Scope
The roadmap expands autonomous debugging capabilities to additional Azure services:
| Service |
Planned Capabilities |
| Azure Functions |
Trigger failure analysis, binding errors, execution timeouts |
| Azure App Service |
Configuration drift detection, high latency patterns, 5xx error trend analysis |
| Azure SQL Database |
Predictive indexing suggestions, deadlock root cause analysis |
| Azure API Management |
Policy snippet validation, backend connectivity troubleshooting |
| Proactive Optimisation |
AI-driven resource right-sizing recommendations based on historical performance |
| Multi-Tenant Dashboard |
Enterprise-scale single-pane governance across multiple subscriptions and tenants |
13. Troubleshooting
Dashboard does not open
Run Azure Smart Debugger: Open Dashboard from the Command Palette. If nothing happens, check the VS Code Output panel (select Azure Smart Debugger from the dropdown) for error messages.
Azure login fails with "Device code expired"
Device codes expire in approximately 15 minutes. Retry the login flow.
Azure login fails for a personal Microsoft account
Set smartLogicApp.azureTenant to consumers and smartLogicApp.azureClientId to 1950a258-227b-4e31-a9cf-717495945fc2 (the Azure PowerShell client ID, which supports personal accounts).
"No runs found" for a Logic App
Ensure your account has at least Reader access to the Logic App. Standard-tier Logic Apps require both the resource group and app name — confirm the correct tier is selected in the dashboard resource type dropdown.
Ollama not starting
Check that port 11434 is not blocked by a firewall or in use by another process. Start Ollama manually with ollama serve in a terminal and then retry analysis.
GitHub PR creation fails with "Branch not found"
Ensure smartLogicApp.githubRepo is set to the correct owner/repo and that the base branch name (main or master) matches the actual default branch in your repository.
AI response is empty or the fix makes no sense
Try switching to a larger Ollama model (e.g., llama3:8b or mistral:7b) or switch to a cloud provider. Enable Include Input/Output Trace Data to give the AI more context about the actual runtime failure.
CSRF validation errors in the developer console
This can happen if the dashboard webview is open for more than 1 hour without interaction. Close and reopen the dashboard to get a fresh CSRF token.
Phase 2 companion extension not detected
Open the Extensions panel and verify soubhikdevtools.azure-smart-ai-model-extension is installed and enabled. Then set smartLogicApp.defaultProvider to custom_iso and reopen the dashboard.
Azure Service Intelli Debugger — Empowering developers with secure, autonomous, and intelligent Azure debugging.
Built by Soubhik Mukhopadhyay · GitHub Repository

