
LooperVisualize the Node.js call stack, microtask queue, and macrotask queue live from inside VS Code. Installation Launch VS Code Quick Open ( Ctrl+P), paste the following command, and press enter.Copied to clipboard |

Looper — Event Loop VisualizerA VS Code extension that visualizes the Node.js call stack, microtask queue, and macrotask queue live — using your real function names — without modifying, wrapping, or adding any dependency to your app.
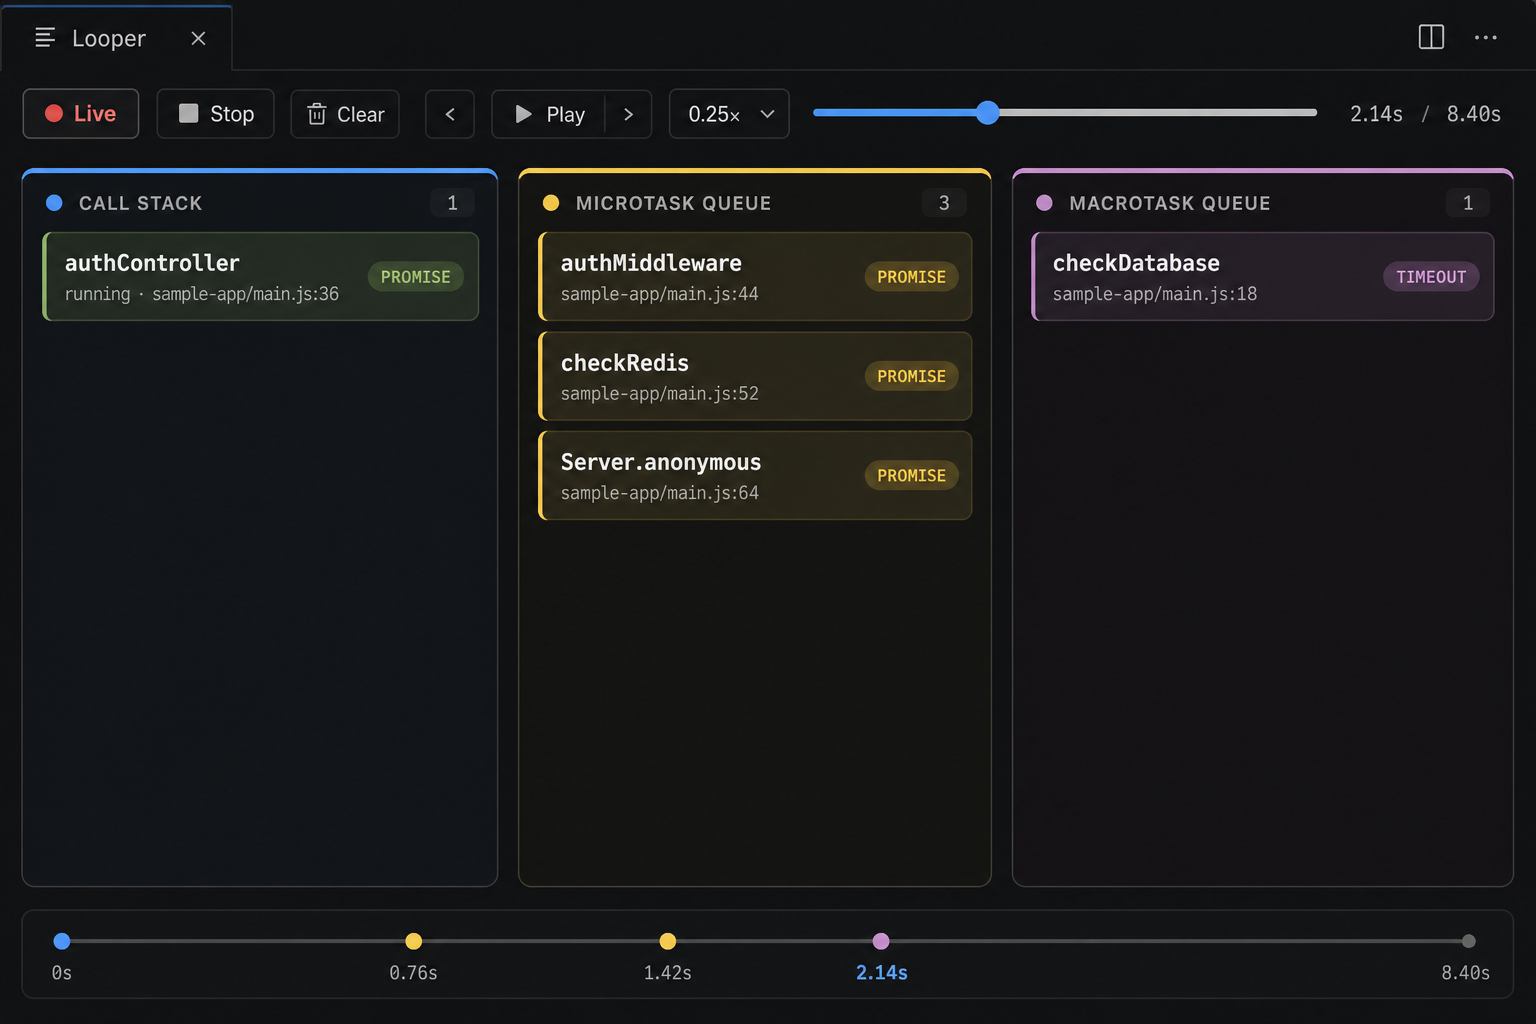
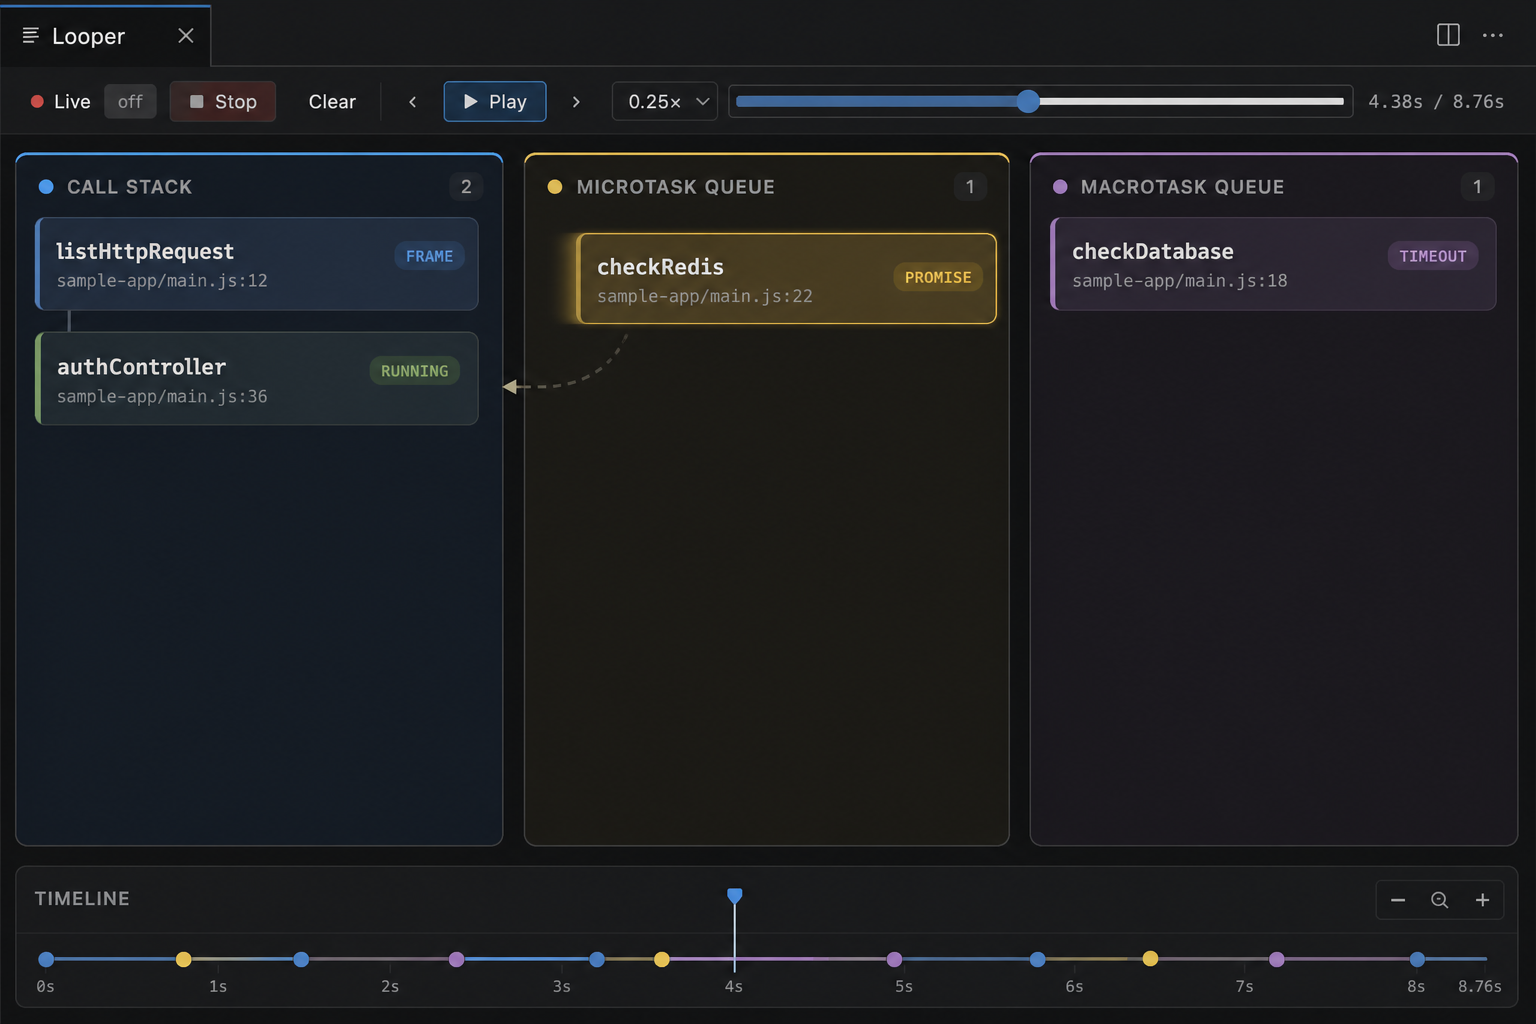
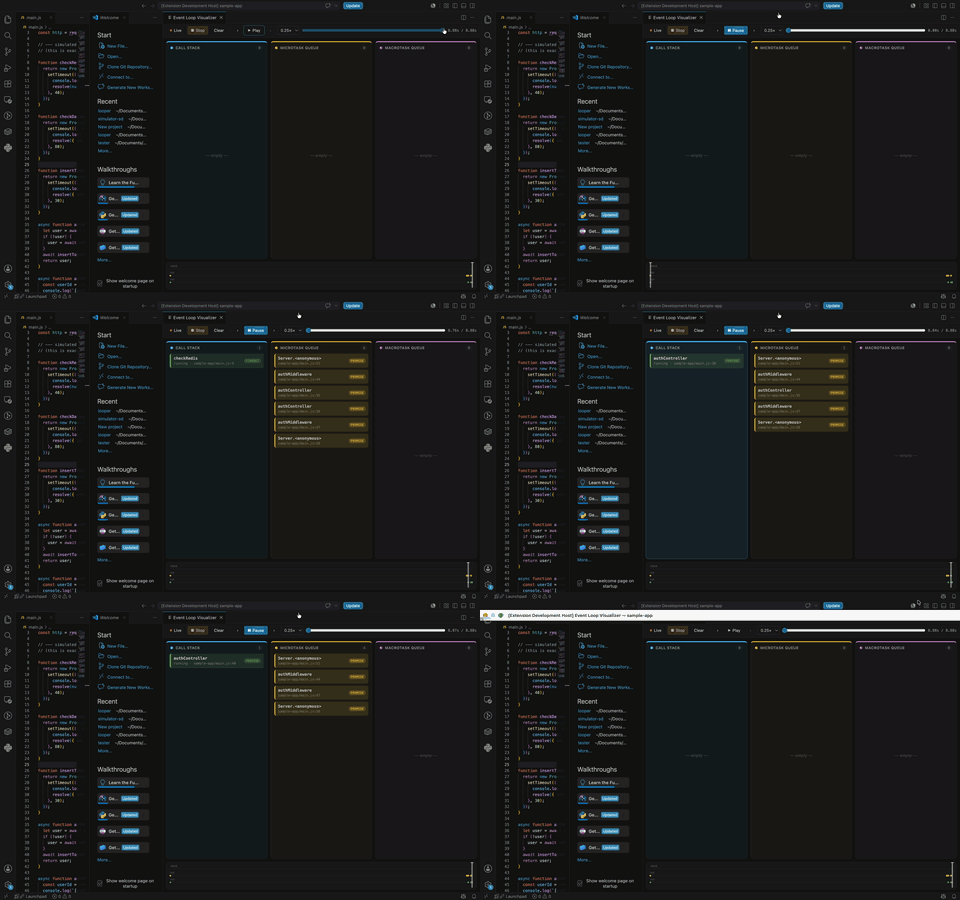
Working demo
Usage
Or Attach to Running Process and enter an inspector port (default How the logic worksLooper is a teaching visualization of the common “call stack + microtasks + macrotasks” mental model. It is not a literal dump of every libuv phase. 1. Injecting without touching your repo
2. Queues —
|
| Hook | What we do in the UI |
|---|---|
init |
Enqueue a chip in microtask (PROMISE, TickObject) or macrotask (Timeout, Immediate). Label comes from the nearest named user frame on the creation stack (skips node:, node_modules, and the agent itself). |
before |
Chip leaves its queue and is pushed onto the call stack as “running” (with a short fly animation). |
after / destroy |
Remove from stack / queues. |
promiseResolve |
Remove resolved promises from the microtask lane. Promises often never get timely before/destroy (GC-delayed), so without this chips would stick forever. |
Why the same name can appear in both queues: e.g. checkRedis does
new Promise(...) and setTimeout(...). Those are two resources. Chips carry
a type badge (Promise / Timeout / …) so they stay distinguishable.
3. Call stack — CDP sampling profiler
The extension host talks to V8 over the Chrome DevTools Protocol:
- Start a sampling window, periodically
Profiler.stop→ walk the parent chain of the latest sample →Profiler.startagain. - That yields a real root→leaf stack (not a flat list of leaf hits).
- Short promise callbacks often finish between samples, so the UI also synthesizes
stack frames from async
beforeevents. Sampling and hooks share one clock by stamping stacks with target-processperformance.now()(calibrated skew).
4. Transport and replay
- Agent → extension: newline-delimited JSON over a local TCP socket.
- Extension → webview:
postMessageevent stream; host keeps anEventStorefor history. - Replay (play / scrub / speed) runs in the webview against its event buffer. Speed options are ≤ 1× with a minimum gap so dense bursts stay readable.
- Clear clears store + UI only. Stop tears down process, CDP, and agent.
5. Motion / lanes (teaching UI)
Three color-coded lanes (stack / micro / macro). Motion vocabulary:
- Enqueue — fly from stack leaf → queue chip
- Run — fly from queue → stack
- Complete — fade out
Concurrent flies are capped; prefers-reduced-motion falls back to simple fades.
TypeScript projects
Source maps are not wired yet. The visualizer attaches to the running Node process, so what you see is whatever V8 is executing:
| You run | What Looper shows |
|---|---|
Compiled JS (node dist/server.js, tsc output) |
Function names from the compiled file; line numbers point at .js, not .ts |
tsx / ts-node on a .ts file |
Often works for names, but locations still follow the runtime’s view (transpile-only / loader), not a mapped .ts editor path |
| Bundled apps (esbuild/webpack/etc.) without maps in the inspector | Bundled names / paths |
Practical guidance today:
- Prefer launching the compiled entry (
node dist/...) for predictable results. - The Launch picker can suggest
npx tsx <file.ts>for an open TypeScript file — useful for demos, not a substitute for source-map support. - Named
function/async functiondeclarations visualize best; anonymous arrows still show as anonymous /anon (file:line).
Full TypeScript source-map mapping (click-through to .ts) is on the roadmap.
Project layout
src/
  agent/instrument.js      # async_hooks agent (injected into target)
  debug/                   # CDP client + process launch/attach
  transport/agentServer.ts # TCP receiver for agent events
  webview/                 # panel HTML + media (UI)
  extension.ts             # commands, session lifecycle
  stateStore.ts            # captured event buffer
  shared/types.ts
assets/                    # screenshots + demo
fixtures/event-loop-demo.js
Known limitations (v0.1)
- Anonymous inline callbacks show as anonymous /
anon (file:line). - Visualizes the call stack + micro/macrotask mental model, not every libuv phase.
- No TypeScript/bundler source-map resolution yet (see above).
- Worker threads / cluster / child processes each need their own agent (not multiplexed).
async_hooksadds overhead — use as a debug-time tool, not in production.
Roadmap
- Source-map support for TypeScript and bundled apps
- Worker / cluster process picker
- Persist replay sessions to disk
- Blackbox / allowlist for
node_modulesframes