C ThroughRelational function call tree and reference visualizer for C/C++ code Installation Launch VS Code Quick Open ( Ctrl+P), paste the following command, and press enter.Copied to clipboard |

C Through
C Through brings Source Insight-style code intelligence into VS Code — built specifically for C and C++ developers who need more than what a standard editor provides. Large C codebases are hard to navigate. Functions call other functions across dozens of files. Global variables get written in one place and read in five others. You spend more time chasing references than writing code. Source Insight solved this for decades with its Relational Window — but it's a separate, aging tool that lives outside your modern workflow. C Through closes that gap. It runs entirely inside VS Code, requires zero configuration, no compiler, no build system — just open a file and your code structure appears instantly.
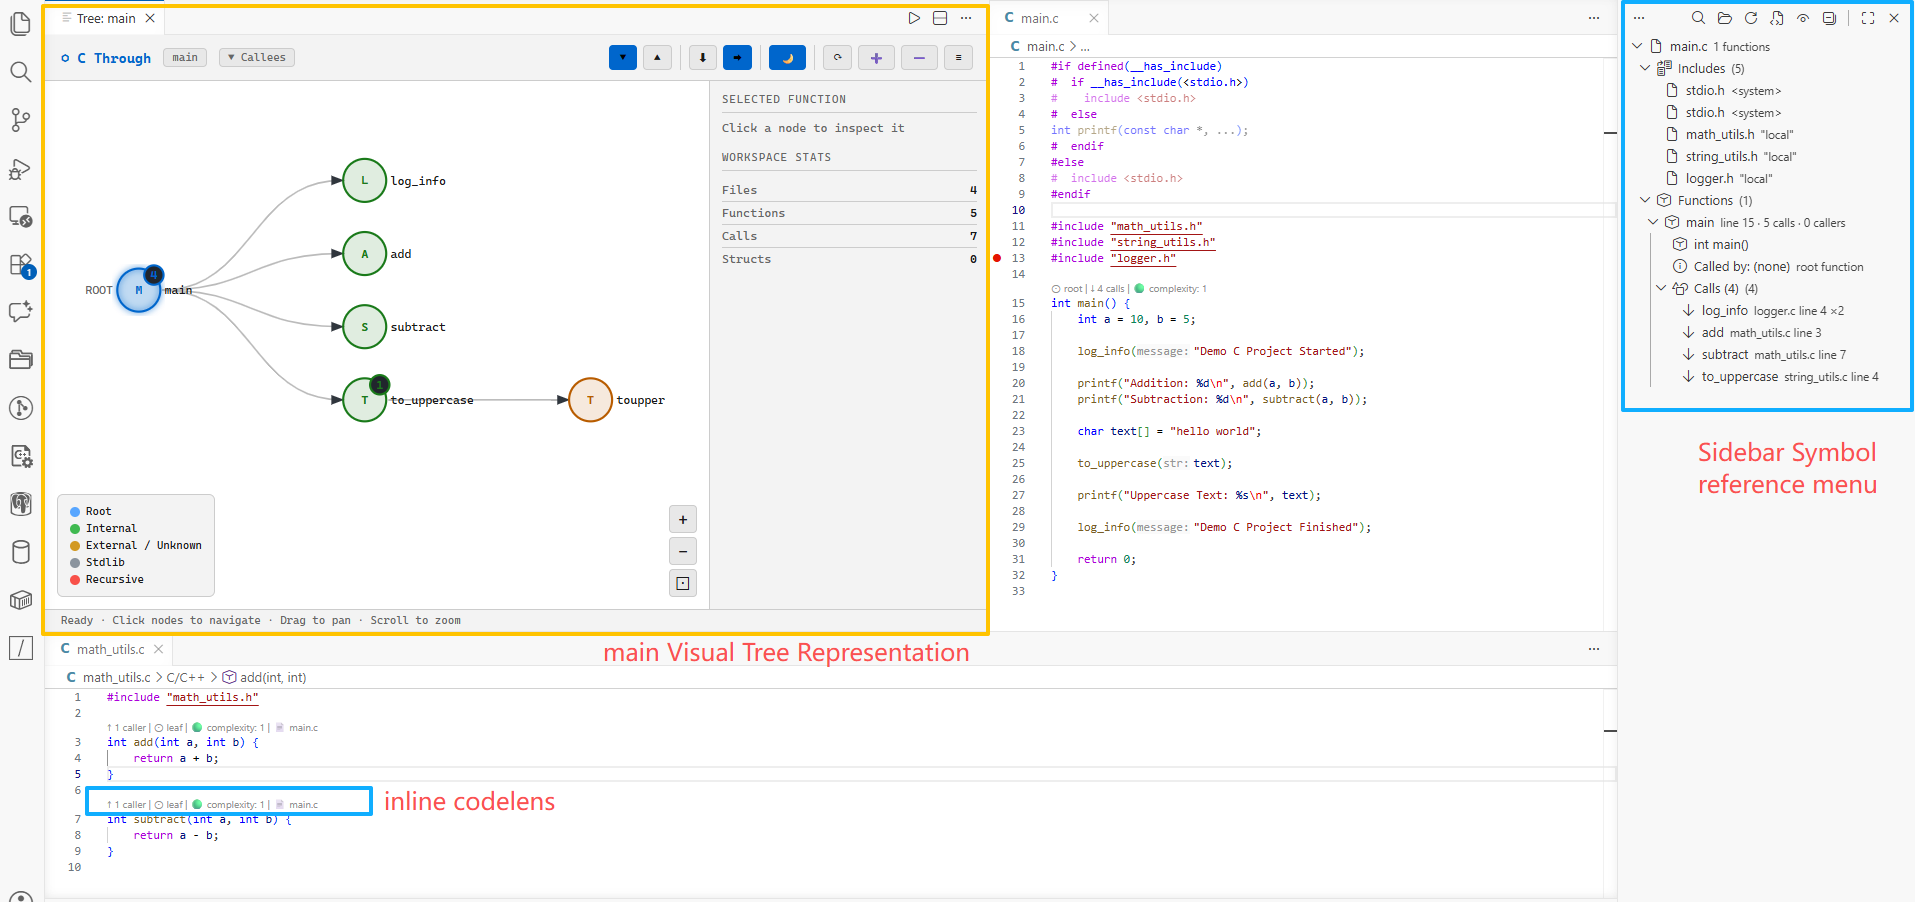
Features🌳 Sidebar Tree ViewA live, structured breakdown of every C/C++ file — organized into collapsible sections:
Click any item to jump directly to its definition in the source file. 🔍 Interactive Call GraphA fully interactive visual graph of function call relationships.
Node colors:
💡 CodeLens Inline MetricsClickable annotations appear directly above every function definition — no panel switching required.
Complexity thresholds:
📂 Flexible Scan Scope
Cross-file caller/callee relationships are fully resolved after any multi-file scan. 🔍 Search & FilterSidebar Search: Filter functions and globals in the sidebar by name instantly.
Call Graph Search: Search inside the visual call graph to find nodes quickly.
☠ Dead Code ReportA dedicated report panel showing all dead and unused code across your entire workspace. Open via Detects:
Panel features:
Severity levels:
⚡ Auto-Refresh on Save🔎 Global Variable Reference TrackerExpand any global variable in the sidebar to see its complete usage across all files:
Every entry is clickable and jumps to the exact source line. CodeLens above every global declaration shows: InstallationFrom VS Code Marketplace
From VSIXUsageQuick Start
Commands (
|
| Command | Description |
|---|---|
C Through: Analyze Current File |
Parse the active C/C++ file |
C Through: Analyze Entire Workspace |
Scan all C/C++ files in workspace |
C Through: Analyze This Directory |
Pick a folder to scan |
C Through: Re-scan Last Scope |
Repeat the previous scan |
C Through: Show Relational Tree |
Open call graph for symbol at cursor |
C Through: Show Functions Called By This |
Open callees tree |
C Through: Show Functions Calling This |
Open callers tree |
C Through: Toggle CodeLens |
Show/hide inline CodeLens |
C Through: Search Sidebar |
Filter sidebar functions and globals by name |
C Through: Show Dead Code Report |
Open the dead code analysis report panel |
Context Menus
- Editor — right-click inside any C/C++ file for tree commands
- Explorer — right-click any folder for Analyze This Directory
Settings
| Setting | Default | Description |
|---|---|---|
cThrough.maxDepth |
5 |
Maximum call tree traversal depth |
cThrough.showStdLib |
false |
Include stdlib calls in tree |
cThrough.autoRefresh |
true |
Re-parse file on save |
cThrough.enableCodeLens |
true |
Show inline CodeLens |
cThrough.includeGlob |
**/*.{c,h,cpp,hpp} |
File pattern for scan |
cThrough.excludeGlob |
**/node_modules/** |
Paths to exclude from scan |
Example — scan only src/, skip build/ and vendor/:
{
  "cThrough.includeGlob": "src/**/*.{c,h}",
  "cThrough.excludeGlob": "{**/build/**,**/vendor/**,**/third_party/**}"
}
How It Works
C Through uses regex-based static analysis — no compiler, no language server, no build system required. Works on any C/C++ file that can be opened in VS Code.
The parser:
- Strips comments and string literals
- Extracts
#include,#define,struct/typedefdefinitions - Identifies function definitions by signature pattern matching
- Extracts all call sites inside each function body
- Calculates cyclomatic complexity per function
- Builds a cross-file caller/callee index across all scanned files
Known Limitations
- Function pointers are detected but cannot be statically resolved to targets
- Heavily macro-expanded signatures may not be fully parsed
- Very large files (10,000+ lines) may have partial symbol extraction
- C++ template specializations may be missed
License
MIT © 2026