FireDBG - 🔥 Time Travel Visual Debugger for Rust
Overview
A time travel visual debugger based on LLDB Debug Server. It allows users to debug Rust code using Visual Studio Code (VS Code). Here's a list of features:
- Time travel / reverse debugging
- Launch, tail and replay program execution history
- Record execution of multi-threaded program
- Record function calls and track function arguments and its return value
- Jump to any thread in your program execution history
- Jump to any function call in your program execution history
- Visually navigate and zoom through the execution flow of the function call tree
- Visually inspect local variables, function arguments and its return value
- Visually conceptualize the function call and return of a multi-threaded program
Installing FireDBG Binaries
Building FireDBG from source can be tricky, so we provided prebuilt binaries for the following CPU and OS combination:
|
Linux |
macOS |
Windows (WSL 2) |
| x64 |
✅ |
✅ |
✅ |
| arm64 |
⛔️ |
✅ |
⛔️ |
Once the the Extension has been installed, you should see a prompt hinting that FireDBG binaries are missing. Click on the "install" button to run the installer.
Or, you can run the installer manually.
curl https://raw.githubusercontent.com/SeaQL/FireDBG.for.Rust/main/install.sh -sSf | sh
FireDBG binaries will be installed in ~/.cargo/bin and a debugger self test will be conducted to verify the installation.
In case you got error messages when performing self test, read Troubleshooting Guide for the solution of common errors.
Getting Started
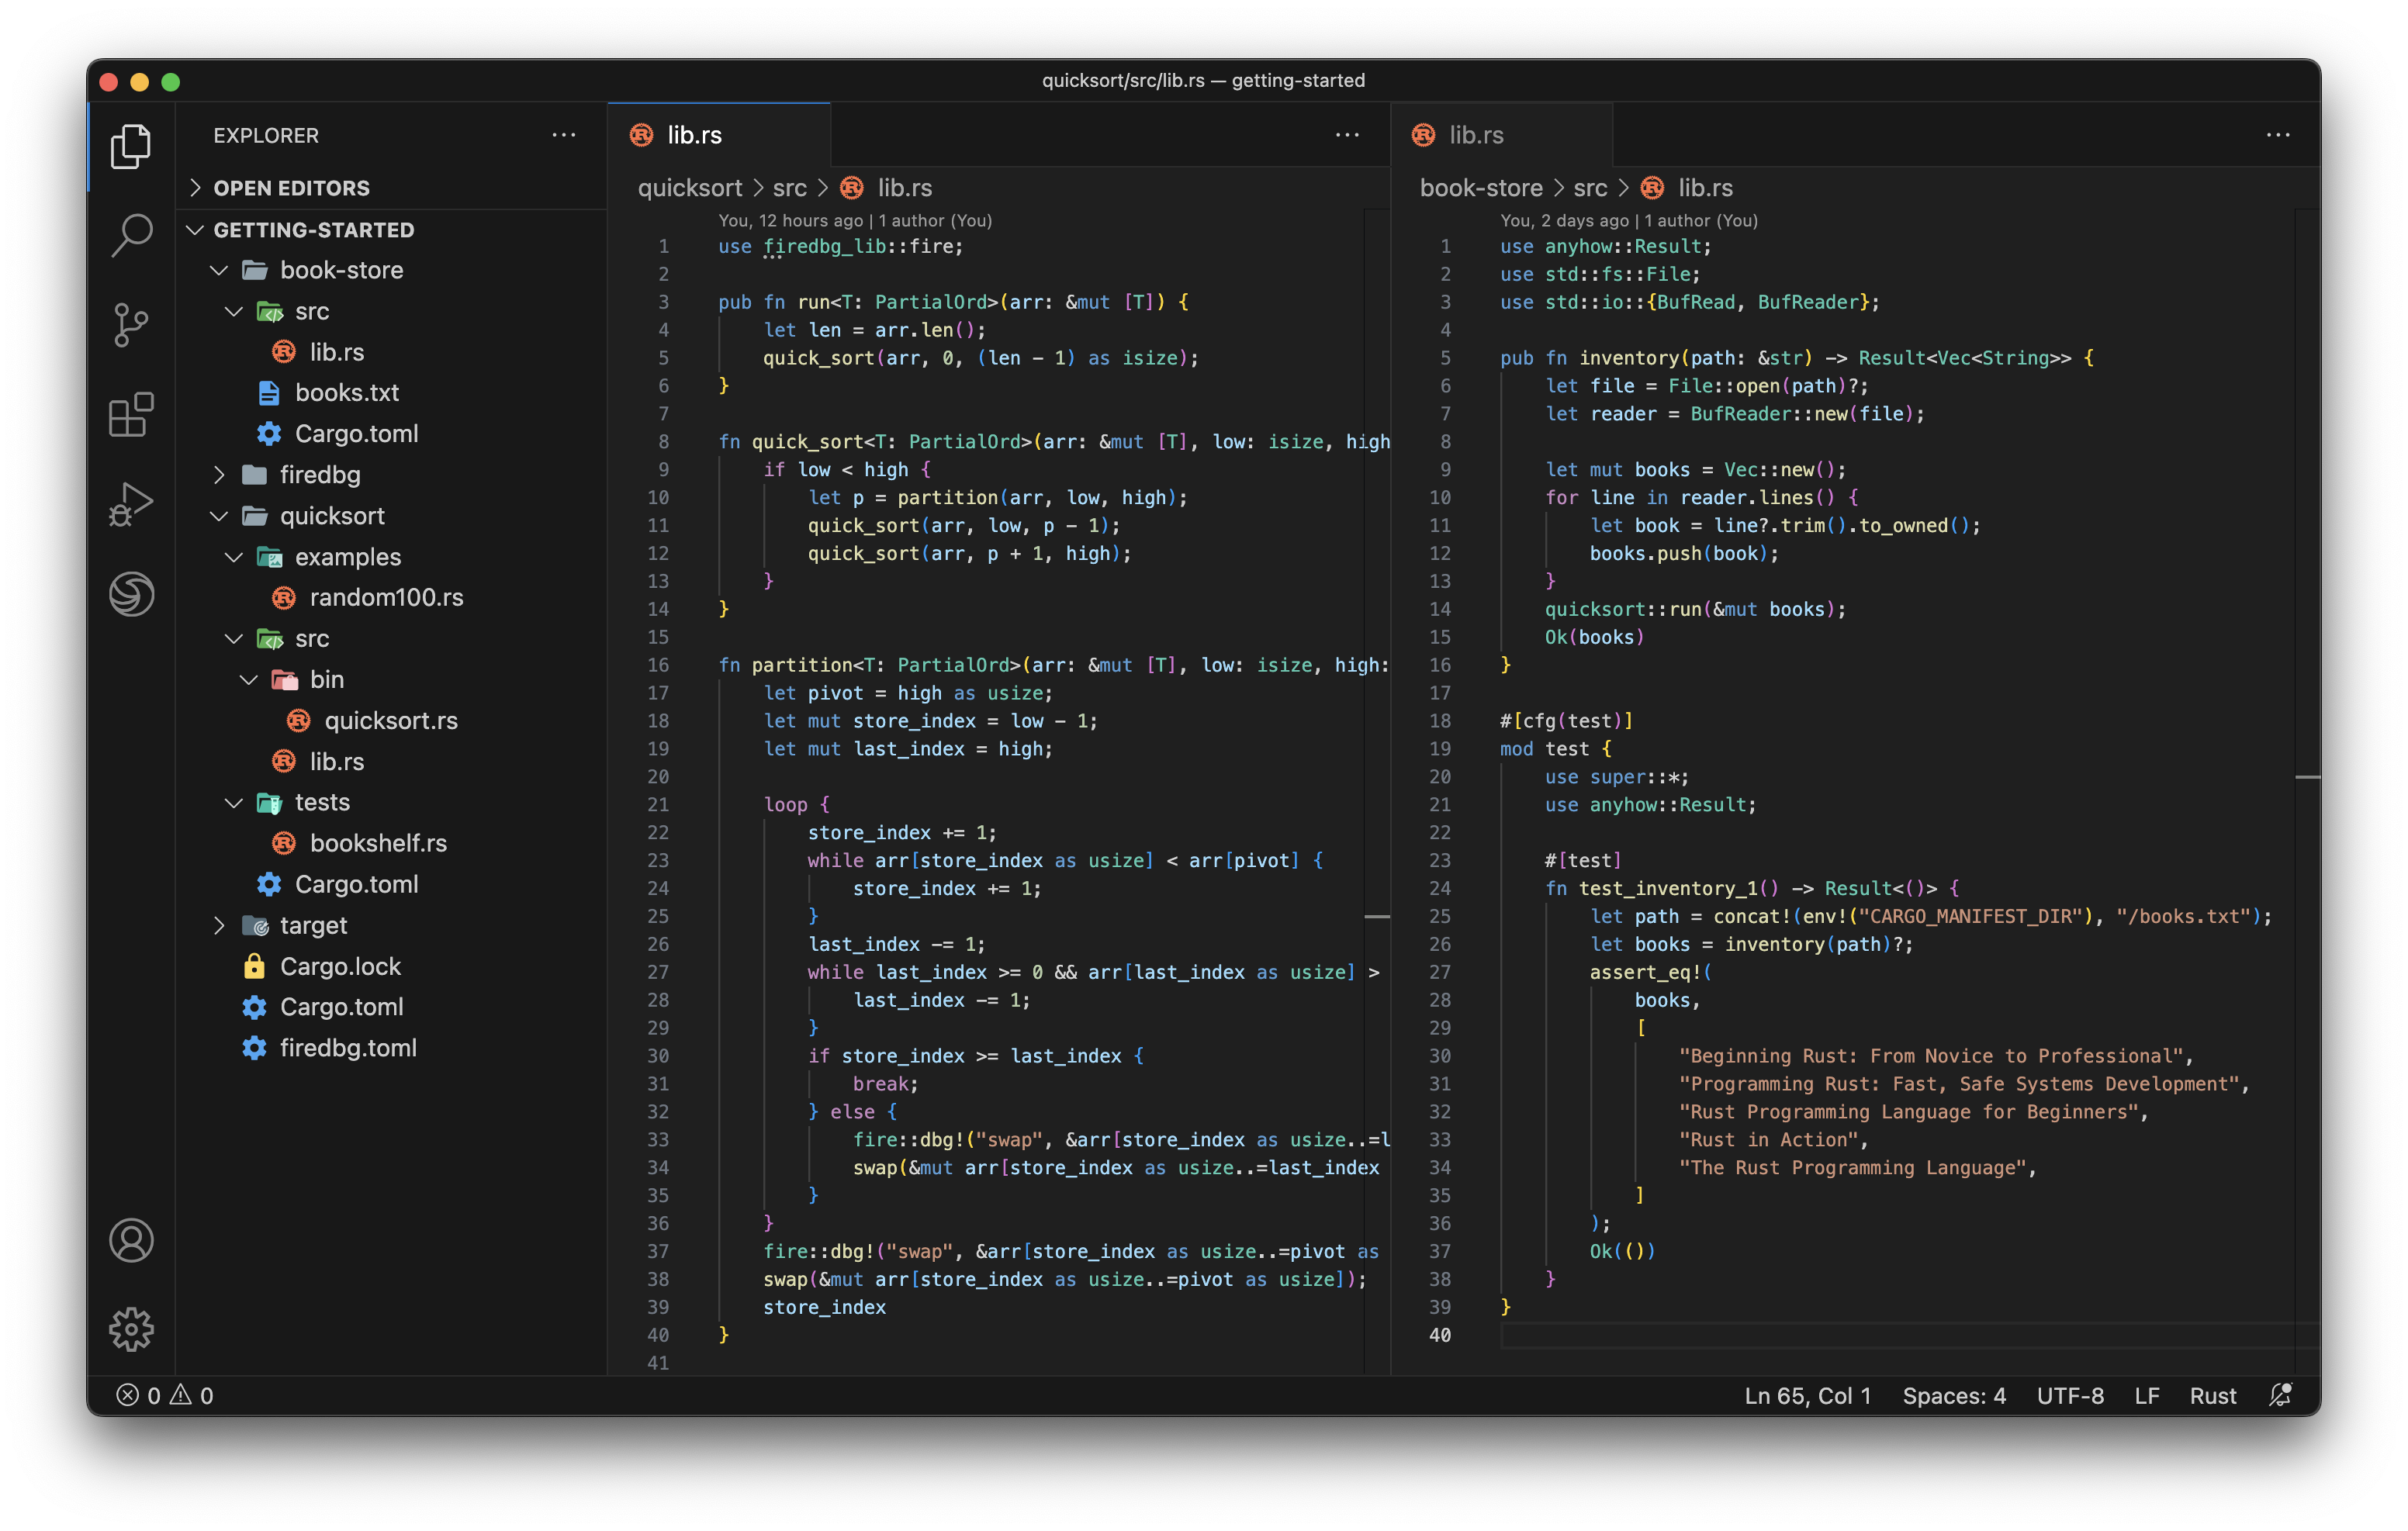
Read the Getting Started for the installation and the basic usage of FireDBG VS Code Extension ("the Extension") and FireDBG CLI ("the CLI").
Download the zipped source code, or cloning Rust Testbench for FireDBG to your local machine, then follow the tour below to learn the basic usage of the Extension.
git clone git@github.com:SeaQL/FireDBG.Rust.Testbench.git
GUI Tour
Debug Targets and Runs
Where can I see the list of all debuggable Rust targets, how can I debug it and how to inspect previous runs?
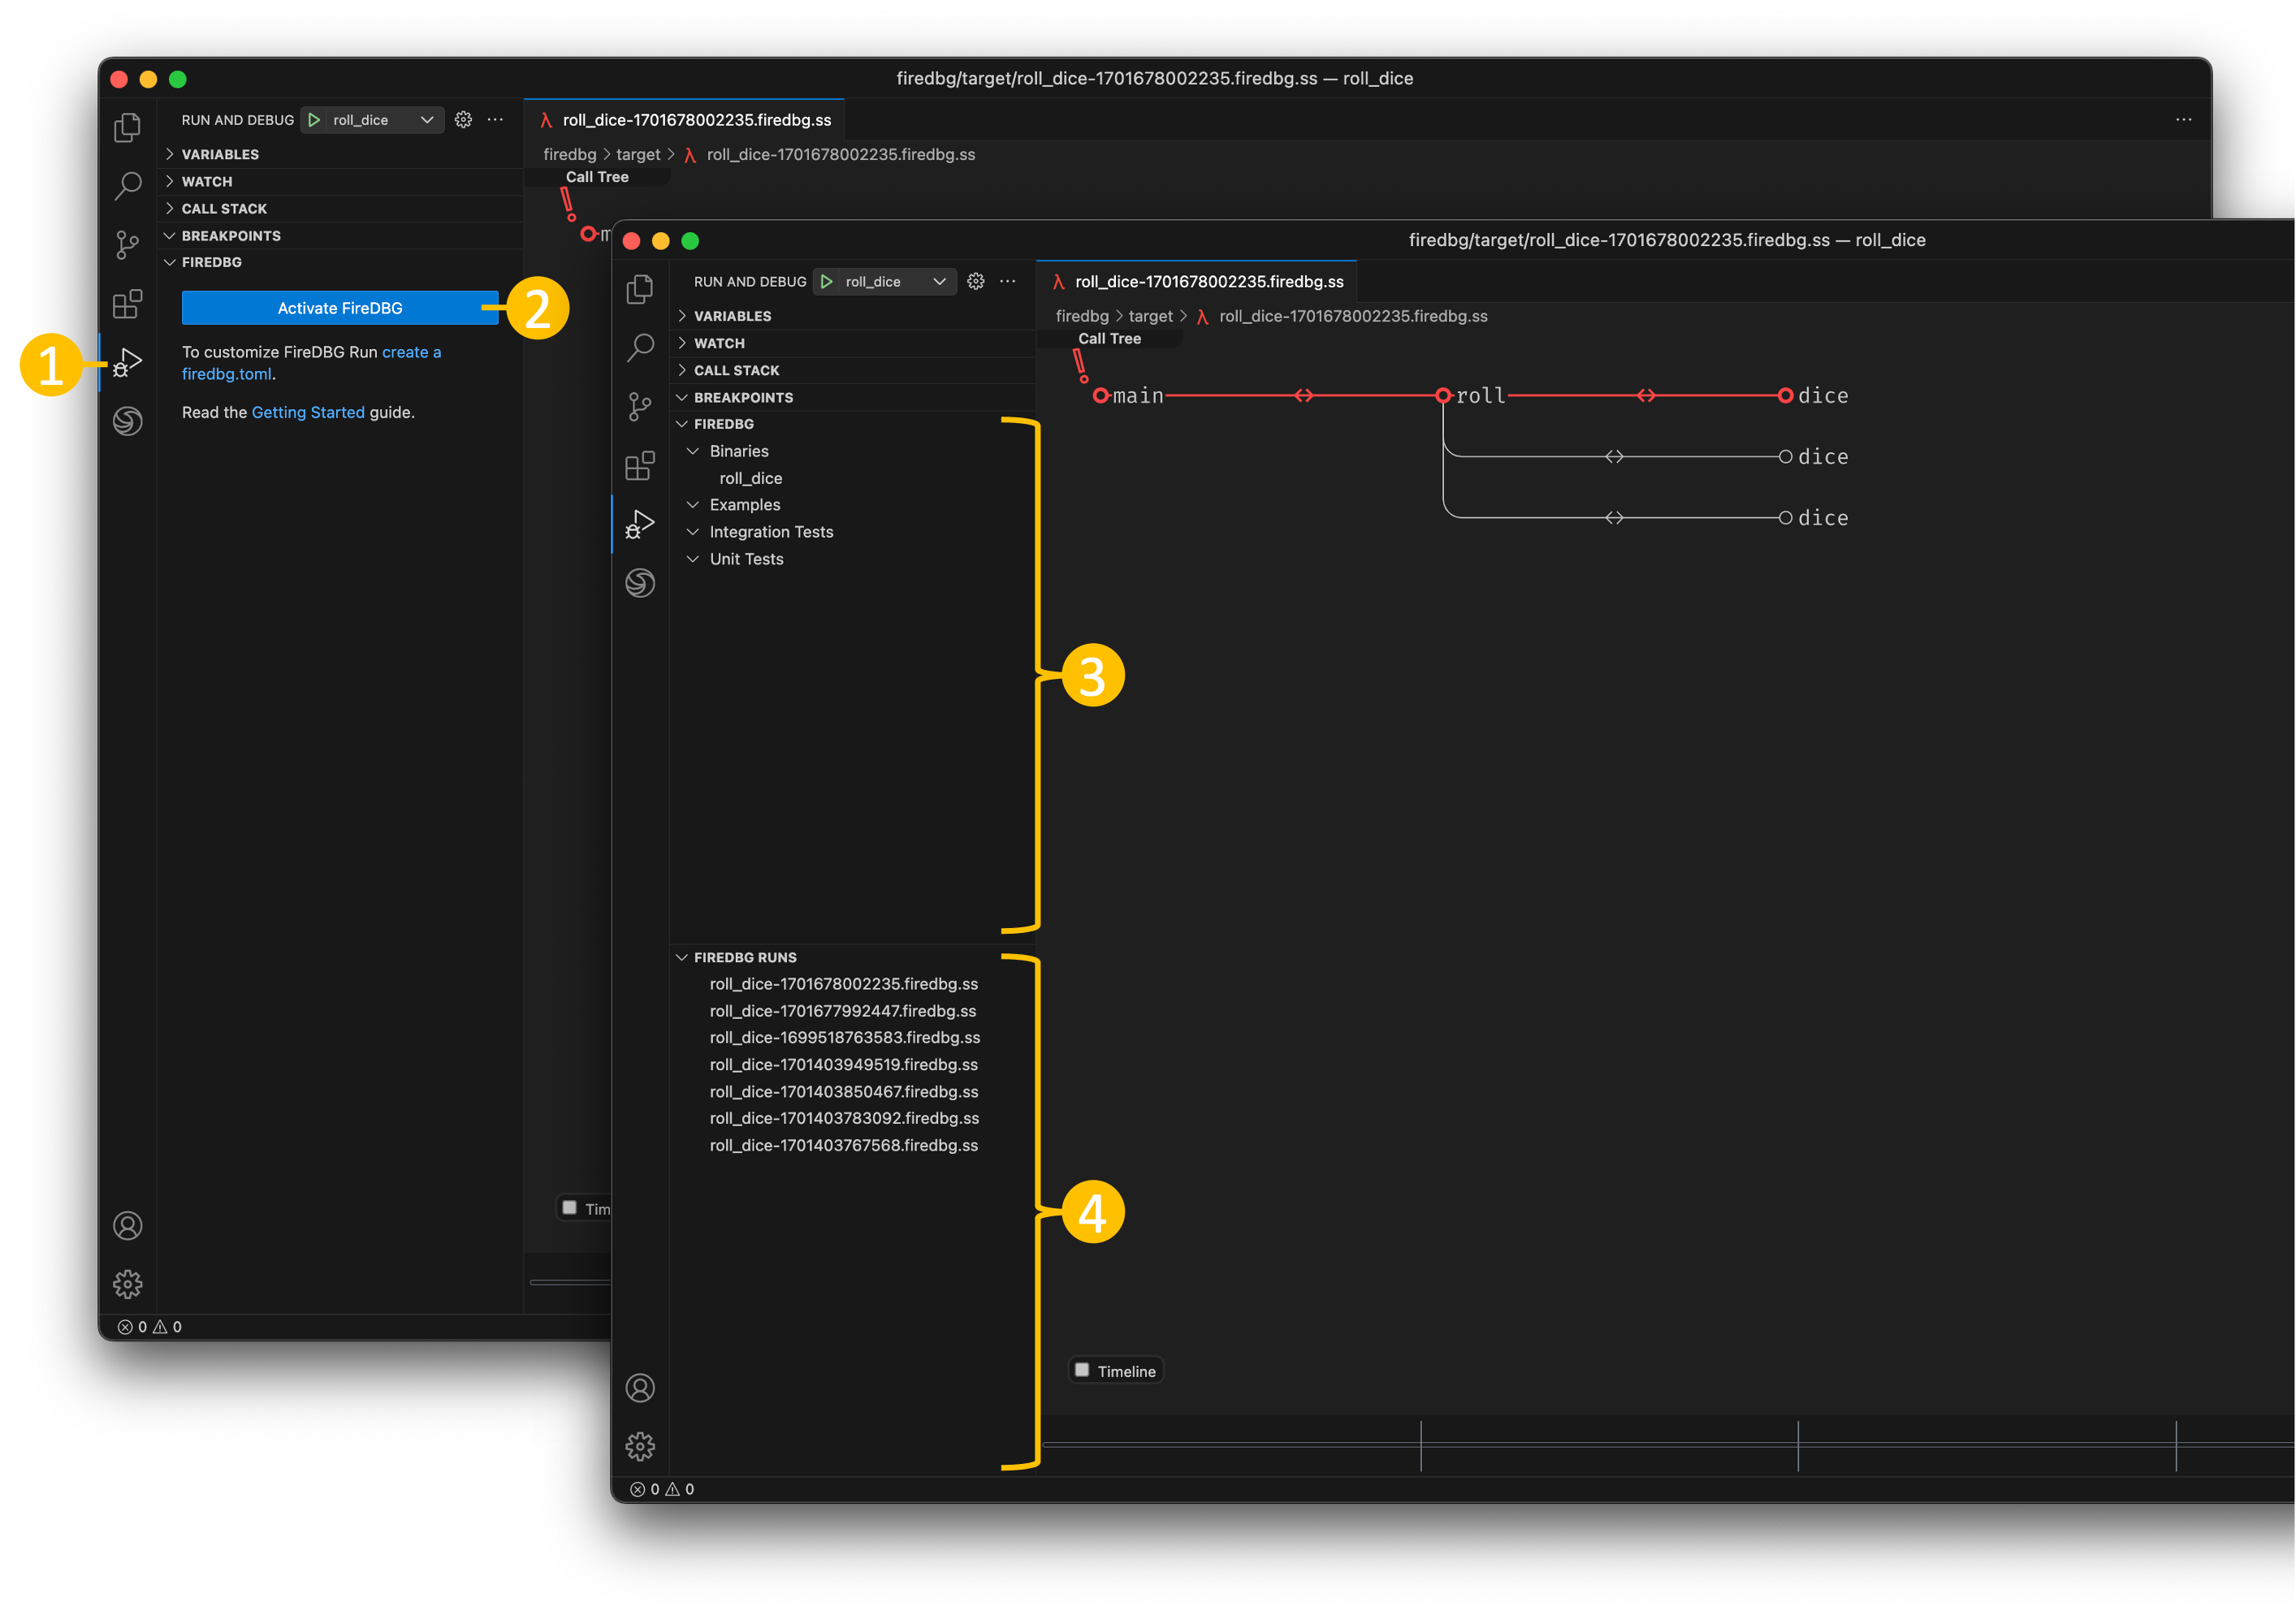
- Click on the "Run and Debug" panel on your primary sidebar, you should see two new panels on the bottom
- Click on the "Activate FireDBG" to enable FireDBG debugger on this workspace
- The
FIREDBG panel should display all binaries, examples, integration tests and unit tests in your current Rust workspace. Click on the list item to reveal the Rust source code. To debug it, hover the list item and click on the play icon ▶️ on the list item. A new debugger view will be shown and tail the progress in real time.
- All previous debug runs can be found in the
FIREDBG RUNS panel, simply click on it to open.
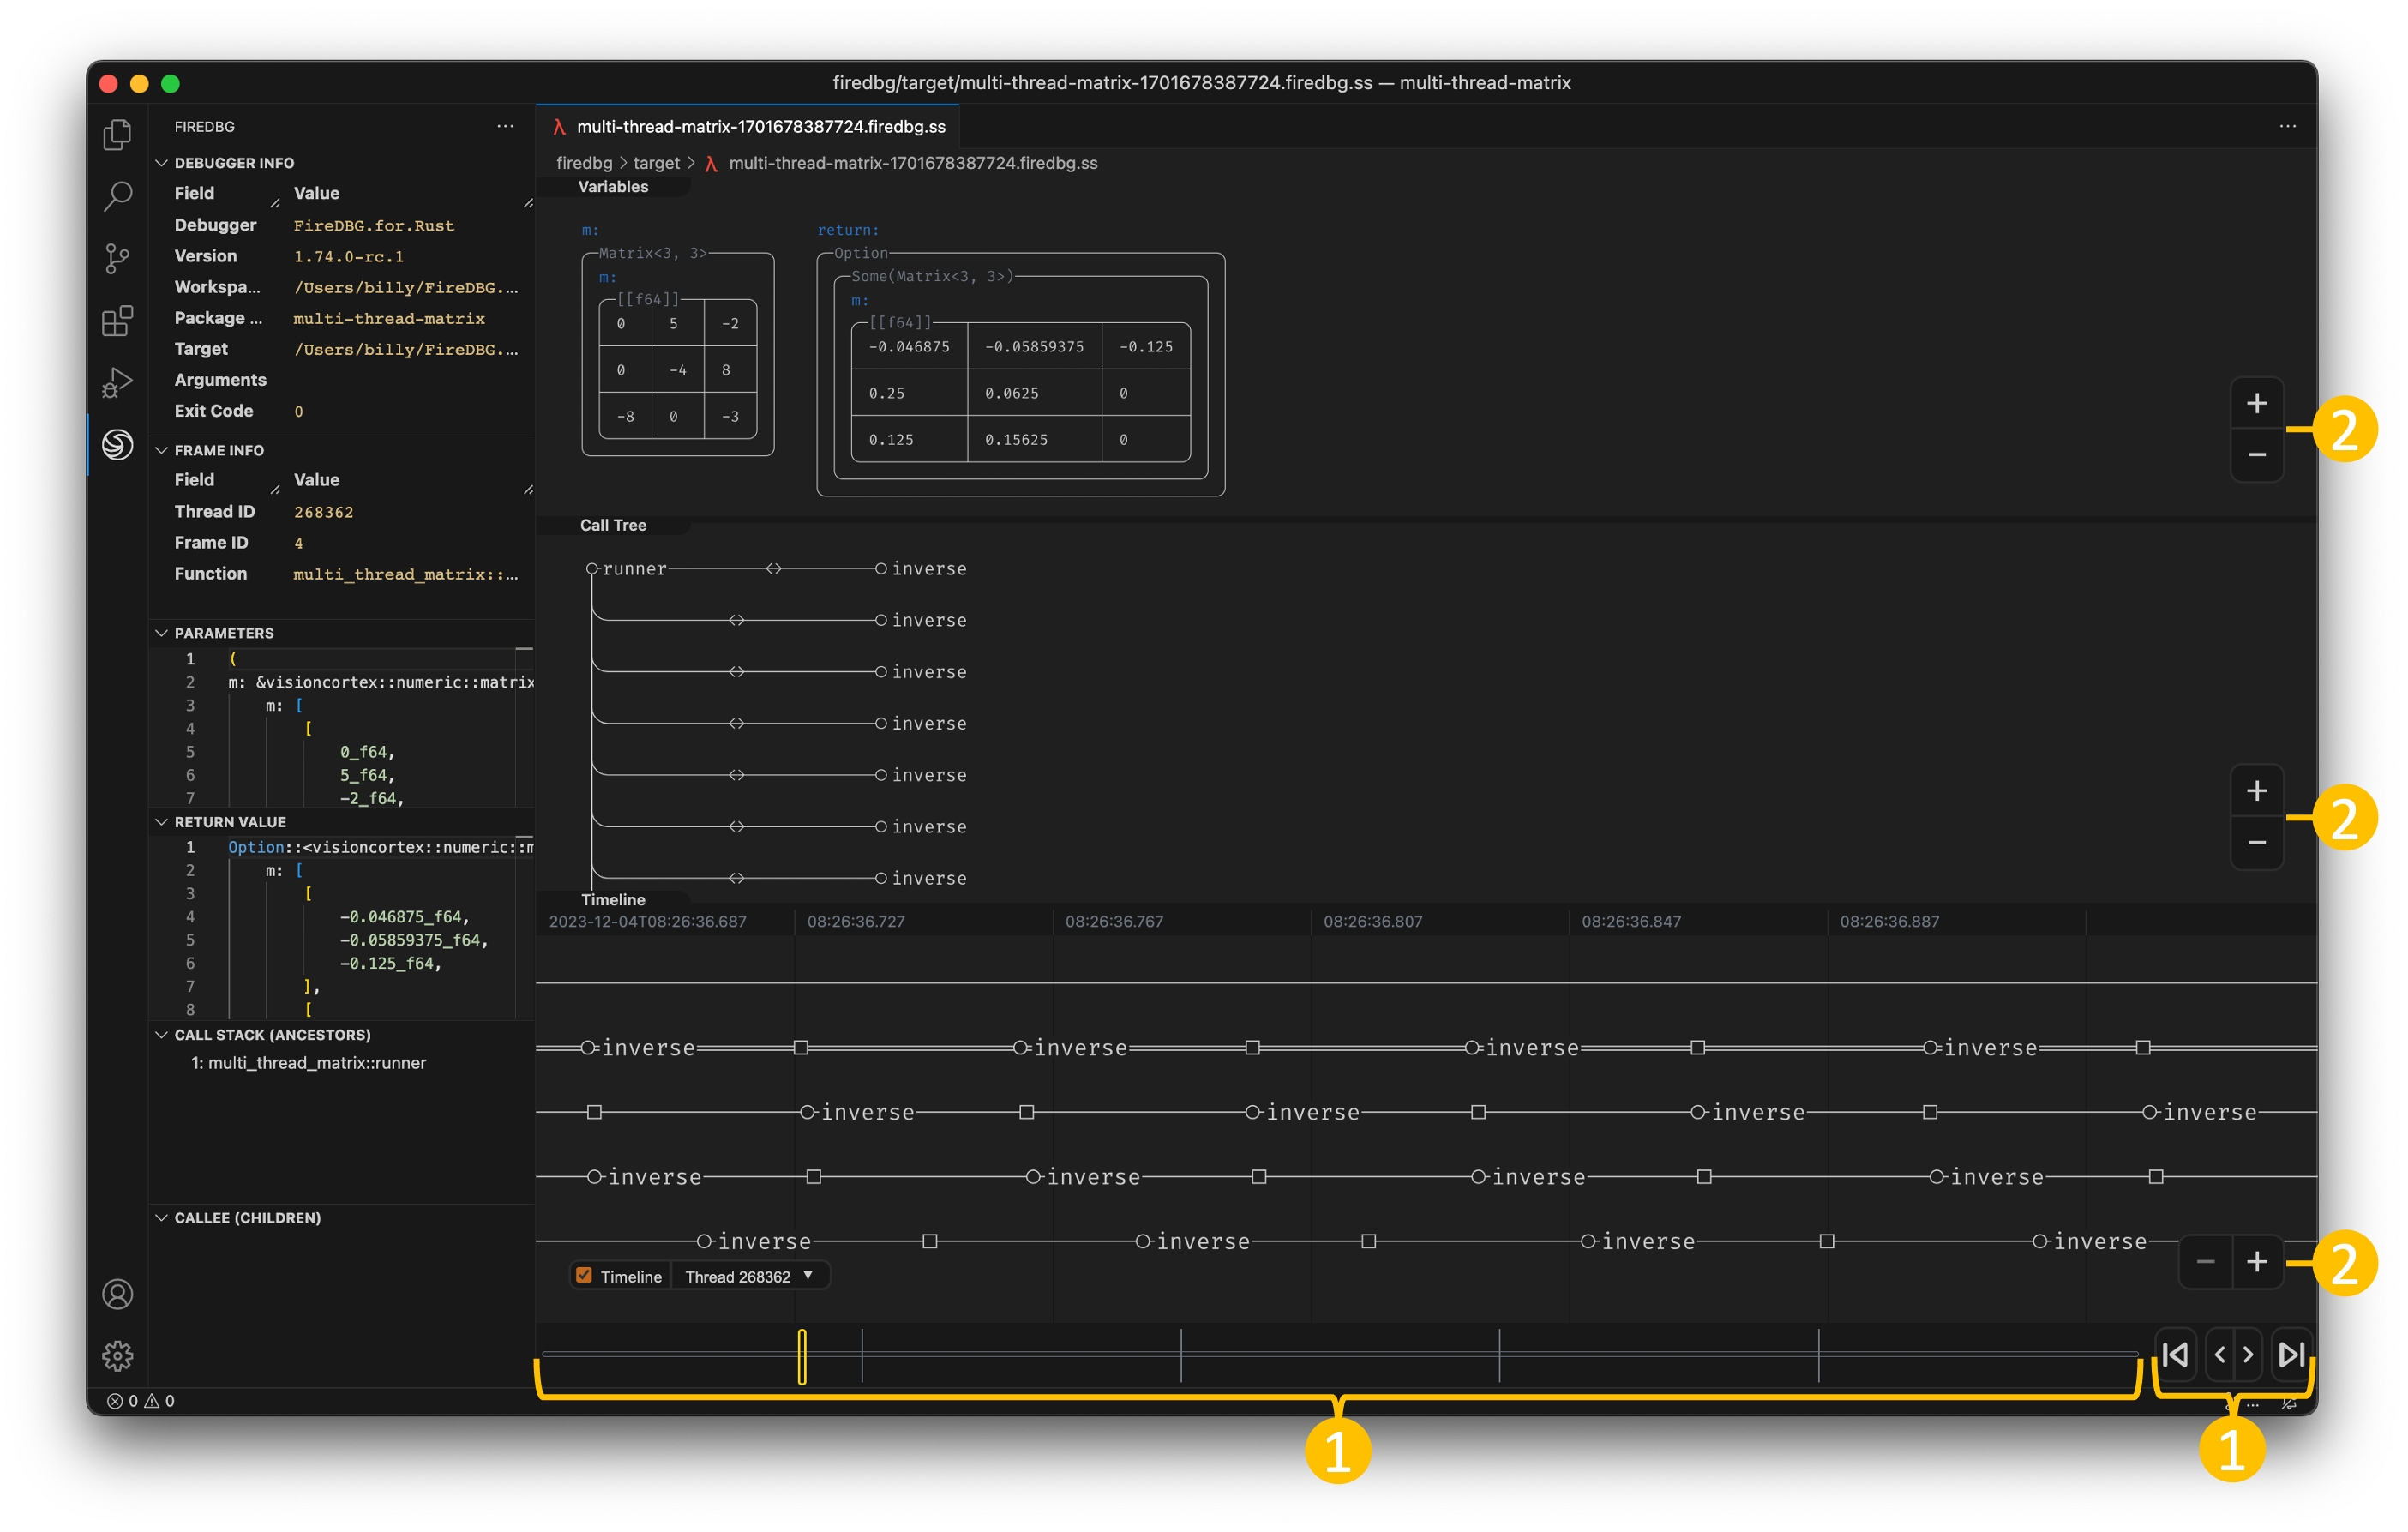
Visual Debugger
How to interpret and inspect visualized call tree, variables, timeline and threads in the Extension?
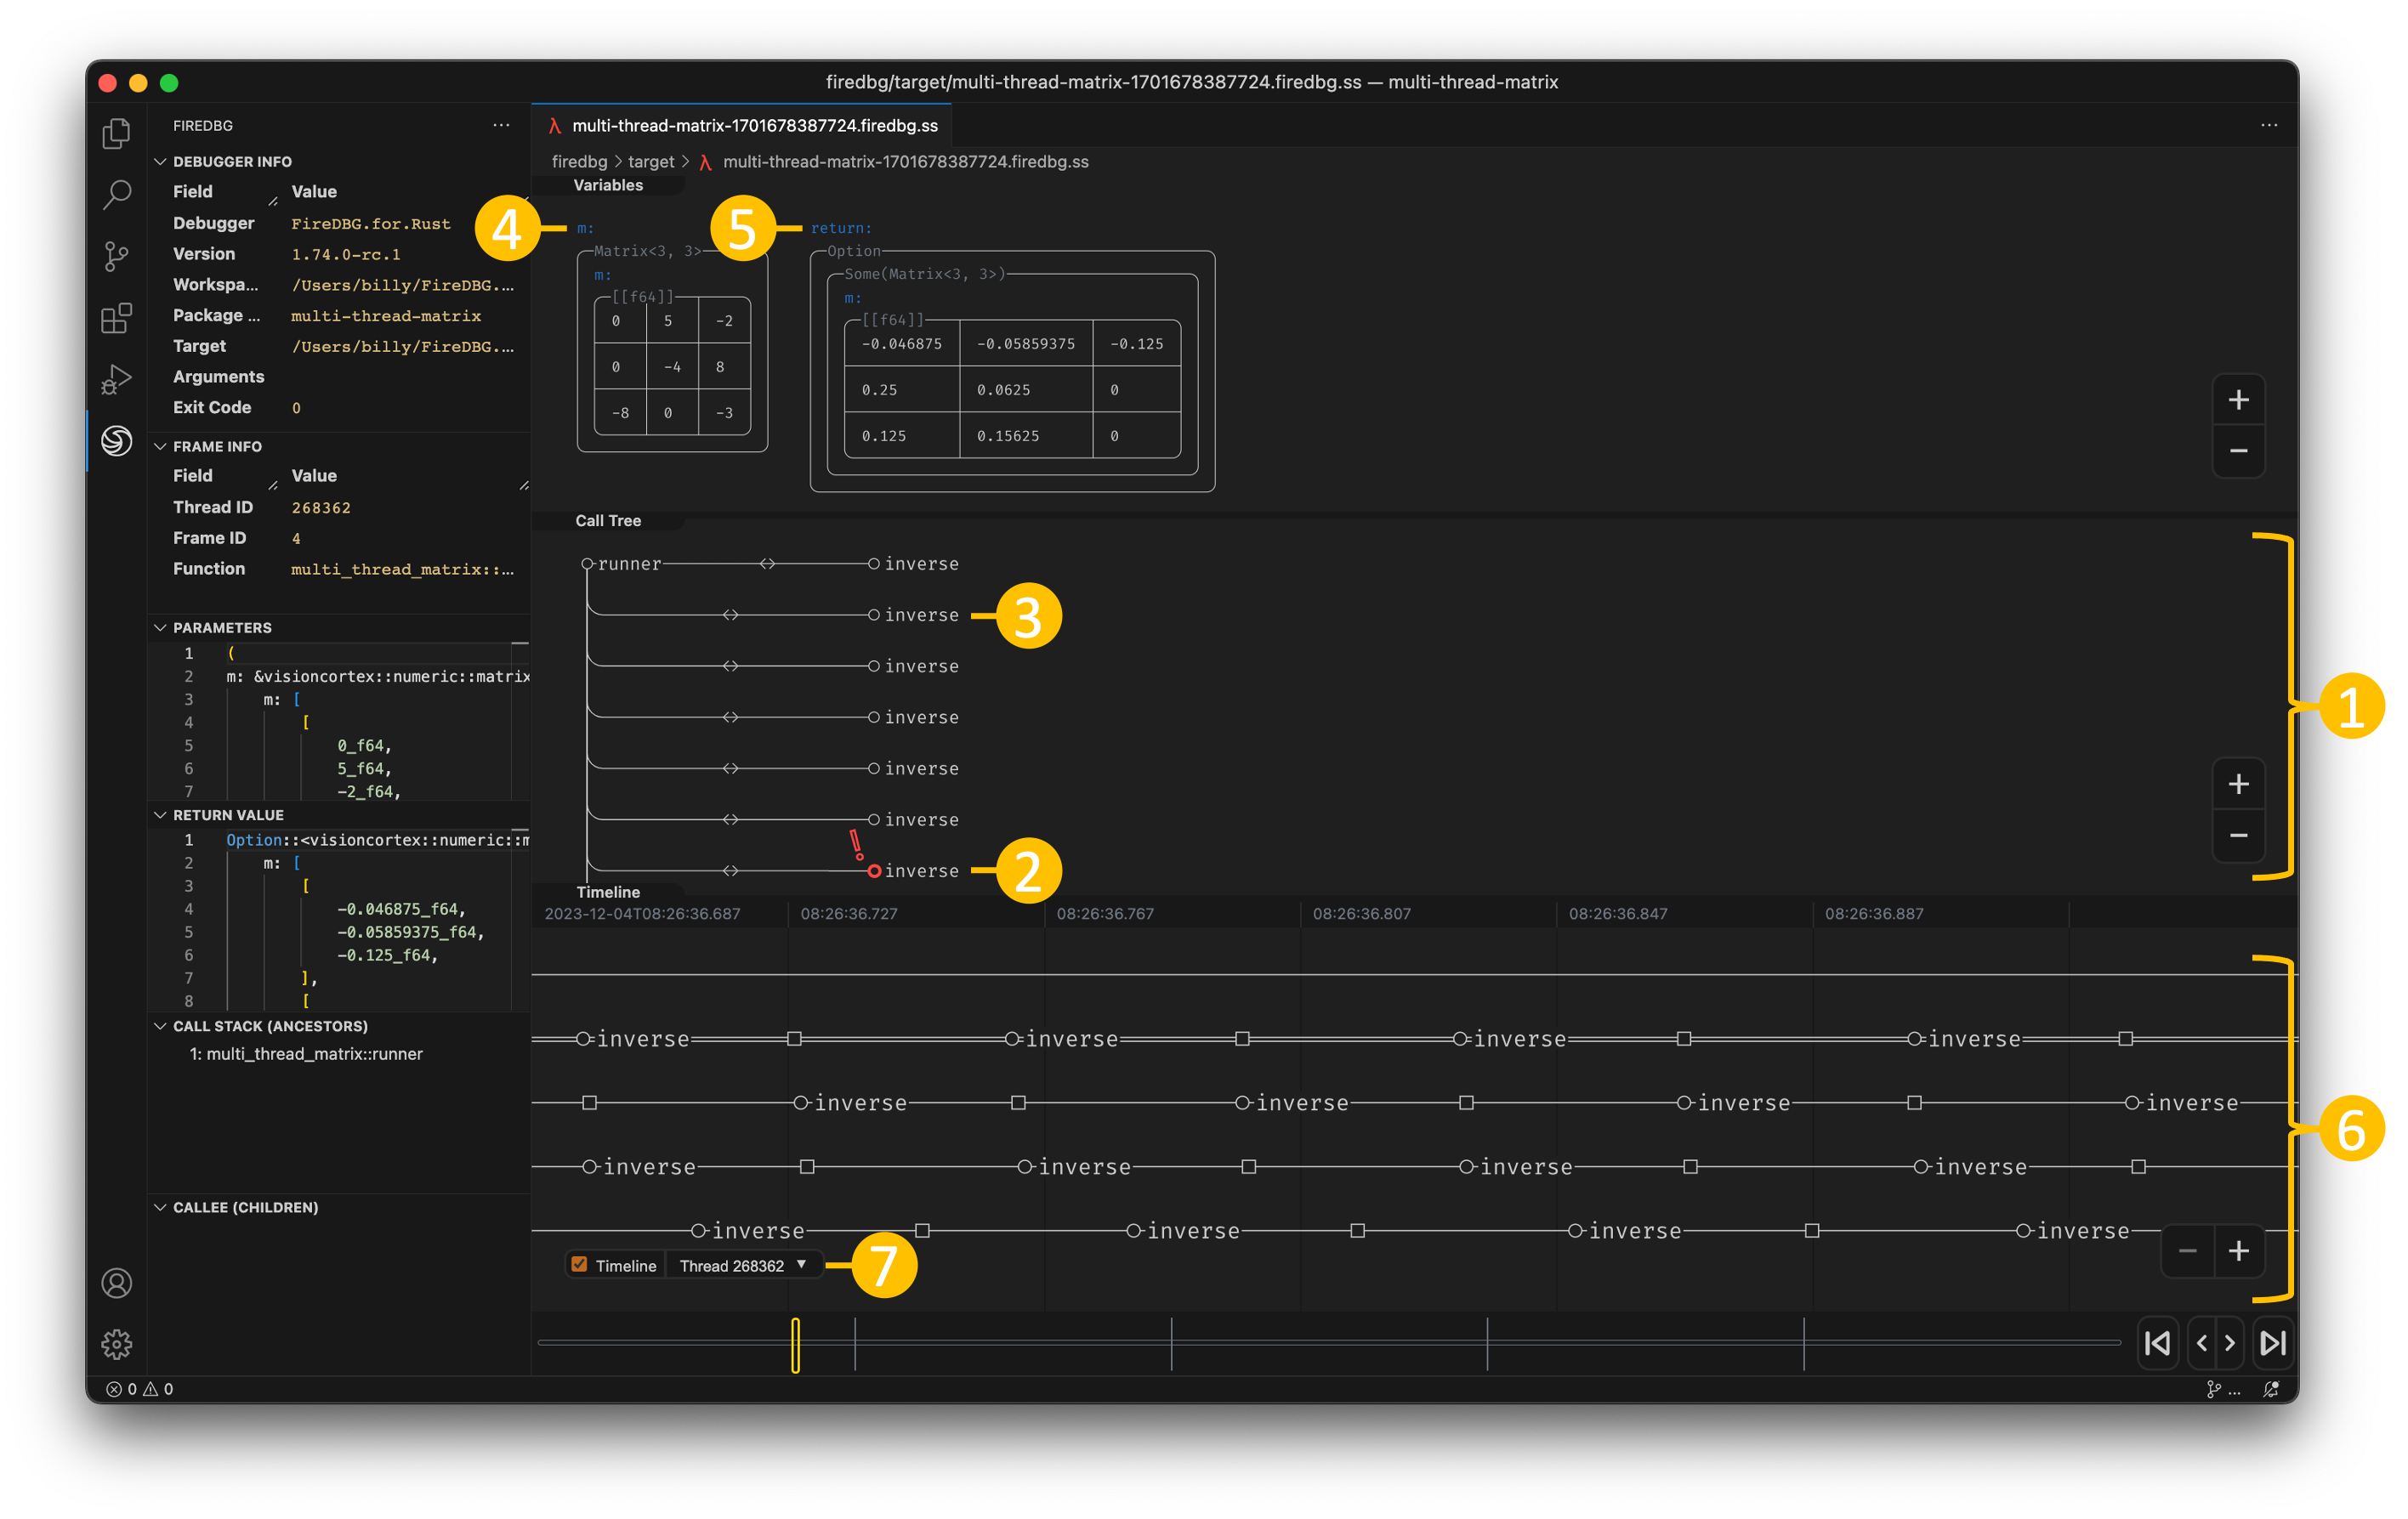
- Each node represent a function call; the depth of each node resemble the depth of the function call in the call stack; There are two types of edge:
- Function call with return value:
-<->-
- Function call only:
-->--
- If the program exited with a panic, the panicking function will be highlighted in red with an exclamation mark.
- Click on the function name on the call tree node to reveal the Rust source code.
- Function Arguments: the name of the argument is shown as the label. The faded text on the bounding box denote the type name, where hovering on it will reveal the fully-qualified name. The actual value is enclosed in the bounding box.
- Function Return Value: the return value will be shown on the far right with the label
return.
- Timeline: toggle the timline by checking the timeline checkbox on the bottom. There are two kinds of node:
- Circle: function call
- Square: function return
- Thread selector: If the program has more than one thread, a dropdown will be shown on the bottom. You can switch to inspect the execution of other threads. Bring up the timeline to view the execution of all threads in a single view.
Controls
How to time travel debug and how to navigate and zoom through the program execution flow?
- Use the control buttons on the timebar to jump to the beginning or the end of program execution. Use
J/K on your keyboard or stepping button to step backward and forward. Click on the timebar would jump to the exact function call.
- The visualization will be updated as you traverse the call tree. Use
W/A/S/D keys on your keyboard or your left mouse click to pan; Click the +/- buttons on the bottom right or -/= on your keyboard or use your mouse scroll wheel to zoom. To resize the panel, move the mouse to the panel edge then drag to resize.
How to retrieve the detailed debug info?
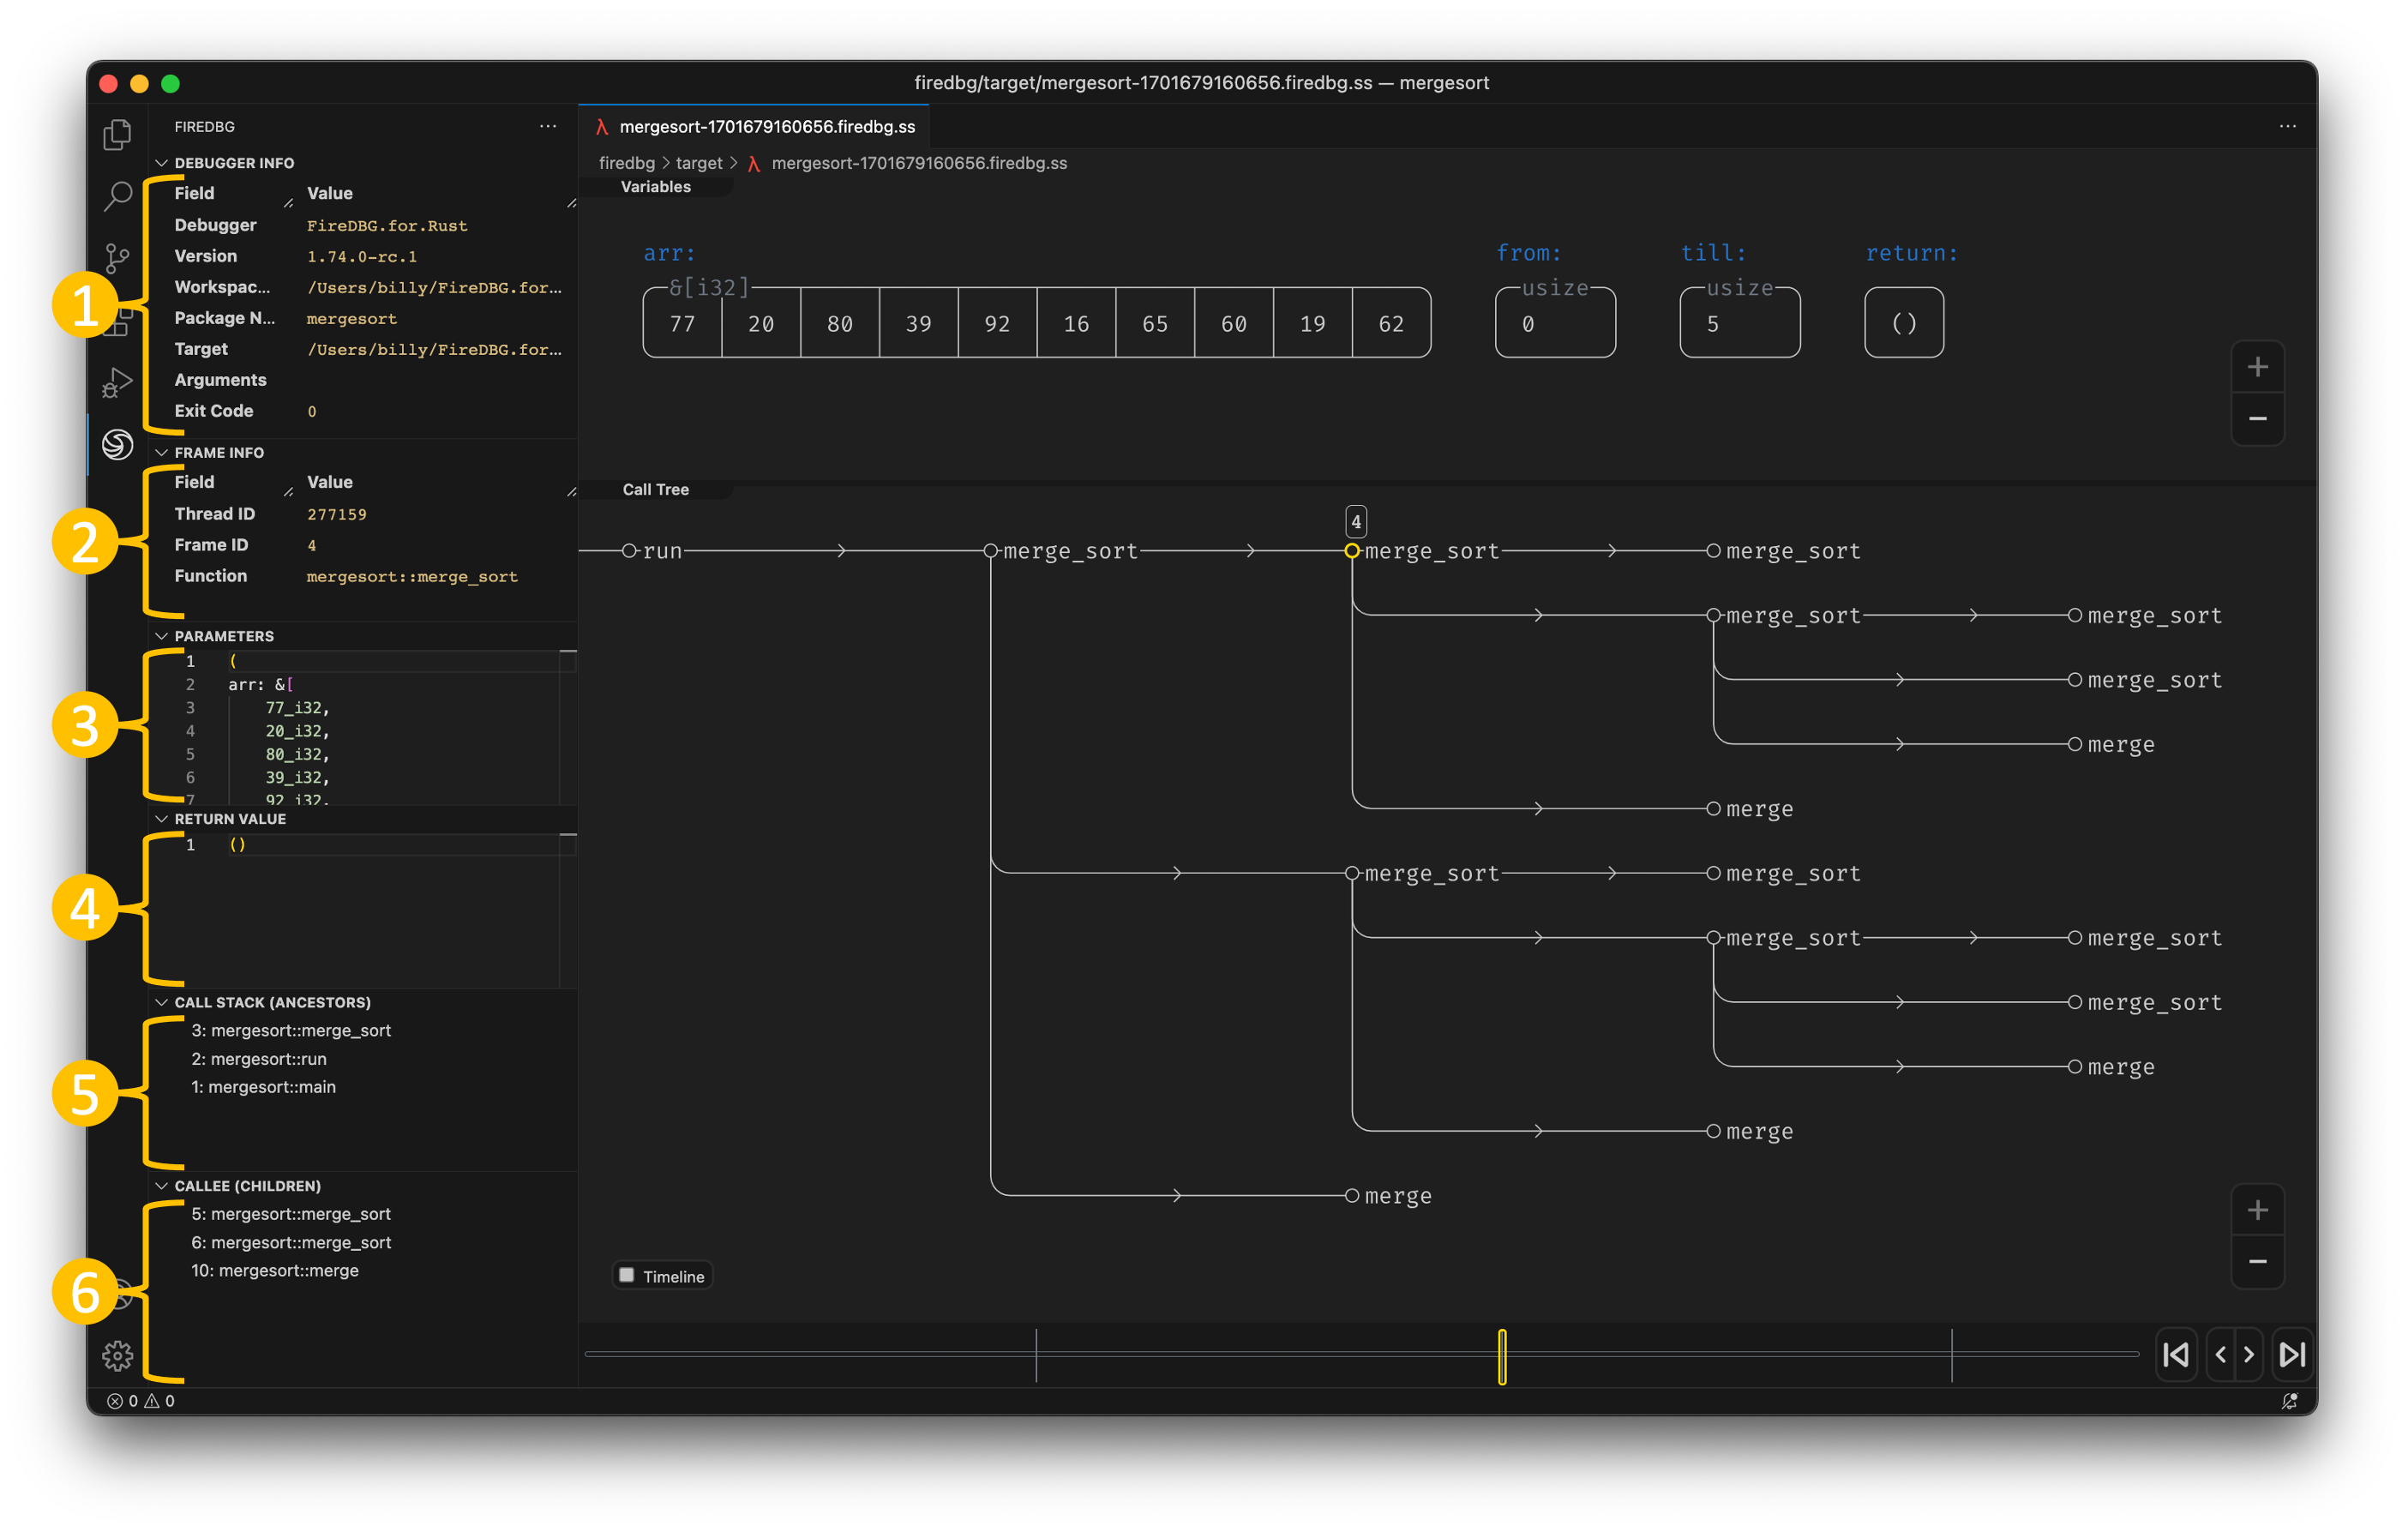
The FireDBG sidebar contains all debug info. It will be updated as you traverse the call tree.
Debugger Info: FireDBG debugger info, program executable info and runtime infoFrame Info: frame metadata of the inspected function callParameters: Rust-like representation of the inspected function call's argumentsReturn Value: Rust-like representation of the inspected function's return valueCall Stack (Ancestors): ancestors of the inspected function; up until rootCallee (Children): immediate children of the inspected function
Extension Options
firedbg.callTreeXInterval: Specifies the x_interval of call tree renderingfiredbg.callTreeYInterval: Specifies the y_interval of call tree renderingfiredbg.scrollToZoom: Zoom in / out using the mouse wheel and scroll gesturefiredbg.initZoomLevel: Specifies the initial zoom level of call tree rendering (higher is zoom out)firedbg.baseDirectory: Specifies the FIREDBG_HOME directory, the root directory of all FireDBG binaries (bundle binaries will be used if not specified)firedbg.showWelcome: Shows FireDBG welcome page on startupfiredbg.telemetry: Allow FireDBG to send usage telemetry to SeaQL.org
Telemetry
This extension collects usage statistics and sends it to SeaQL.org (Us) to help improve our products and services. This does NOT include any data about the programs that you are debugging. Read our privacy statement to learn more. If you don't wish to send usage statistics to Us, you can set the firedbg.telemetry setting to false.
Contributing
If you are interested in fixing issues and contributing directly to the code base, please see the document How to Contribute.
Feedback and Questions
You can find the full list of issues at Issue Tracker. You can submit a bug or feature suggestion.