
      F5 debug  ──►  output  ──►  saved to  reports/*.log
                                        │
                                        ▼
                    ┌─────────────────────────────────────────┐
                    │  VIEWER (what VS Code doesn't give you) │
                    │  · Search all logs (regex, history)     │
                    │  · Click  file.dart:42  →  open source  │
                    │  · Filter by error / warning / level    │
                    │  · Keep many sessions, compare two      │
                    │  · Export HTML, CSV, or share .slc      │
                    └─────────────────────────────────────────┘
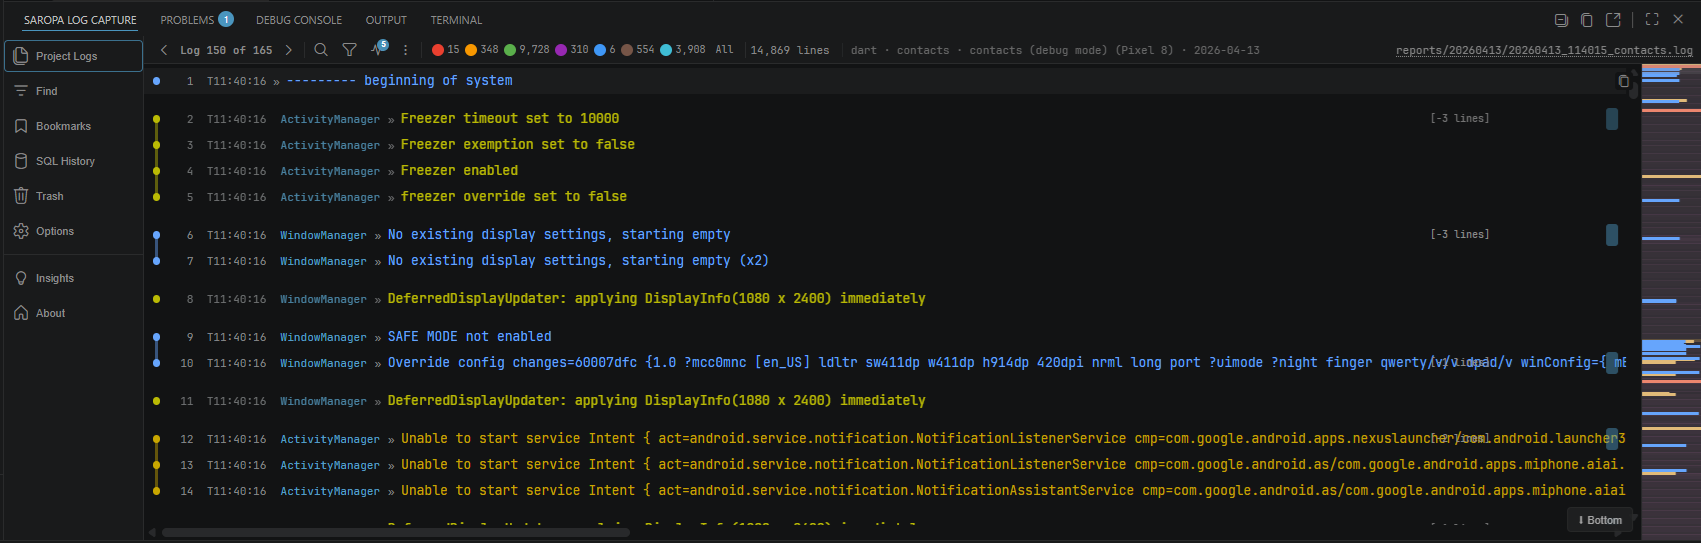
VS Code deletes your Debug Console the moment you stop debugging — every print, stack trace, and clue gone. Saropa Log Capture fixes that: install it, hit F5, and every debug session is saved, searchable, and browsable with no configuration. Works with any debug adapter — Dart, Flutter, Node, Python, C++, Go, Java, and more.


Feedback or ideas? Open an issue.
Quick Start
- Install from the VS Code Marketplace
- Start a debug session (F5)
- Output is automatically captured to
reports/
- Click the Saropa Log Capture icon on the activity bar to view output in real time
Testing the extension (F5): Use VS Code (not a downstream fork) for the Extension Development Host — File → Open Folder → this repo → F5. Some forks won't load the extension as the F5 host.
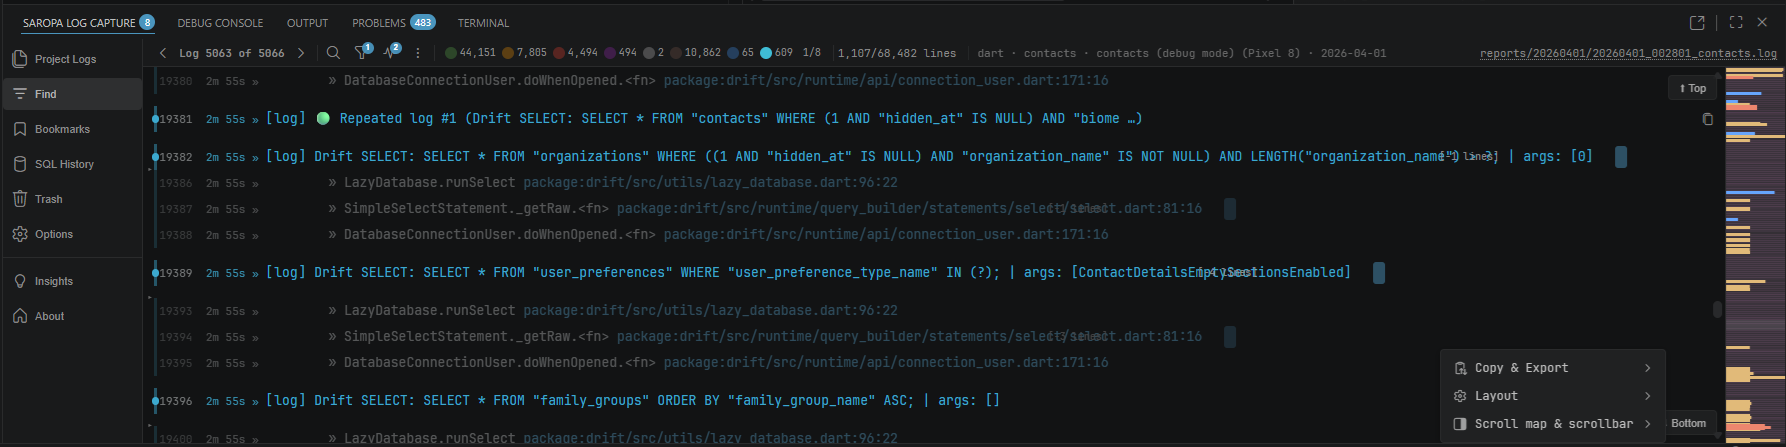
Screenshots
Why Use This?
- Never lose output again — Debug Console output saved to
reports/*.log automatically. Restart, switch targets — your logs survive.
- Click to source — Click
file.ts:42 in any log line to jump to the code (Ctrl+Click for split editor).
- Search everything — Regex search with history, floating overlay (Ctrl+F), cross-session search.
- Filter the noise — Eight severity levels, log source tiers (Flutter DAP / Device / External), source tag chips, exclusion patterns, and saved presets. Tags & Origins side panel for browsing sources.
- Compare sessions — Side-by-side diff of any two runs.
- 100K+ lines, no lag — Virtual scrolling handles massive logs without freezing.
- Signals — Automatic detection of slow operations, N+1 queries, ANR risk, and error clusters with evidence-backed signal reports. Unified Signals panel with collections, all signals, hot files, and performance data.
- Error intelligence — Errors auto-classified as CRITICAL, TRANSIENT, or BUG with inline badges. Recurring patterns surfaced across sessions. Configurable alerts (flash, sound, badge, modal).
- SQL diagnostics — Drift ORM query fingerprinting, repeat compression, N+1 detection, slow query burst markers, and session SQL comparison.
- Structured file support — Open
.md, .json, .csv, and .html files in the viewer with format-aware previews.
- Typography controls — Live font-size and line-height adjustment via keyboard shortcuts (Ctrl+=/-, Ctrl+Shift+=/-) or the Options panel.
- Post-capture workflow — Actionable end-of-capture toasts: Open Log, Always Open, or Don't Ask Again.
- Pop-out viewer — Move the viewer to a second monitor for full-screen analysis.
- Export anywhere — HTML, CSV, JSON, shareable
.slc bundles, or push to Grafana Loki.
- Collections — Pin logs and files into named collections. Dedicated slide-out panel for merging and managing grouped sessions.
- Tail any log — Open any workspace
.log file and watch new lines live.
- Run navigation — Jump between Flutter runs (launch, hot restart, hot reload) inside a single log.
- Session groups — A debug session and its sidecar logs collapse into one entry in the Logs panel with severity totals.
- Logs panel tree — Runs nest under their project (the Controller); peripheral logs (Lint Report, Arb Translate, Drift Advisor) group beneath. Every run shows by default; "Latest only" is an opt-in toggle with a "+N older" expander.
- Logs panel filters — Date, size, and name filters with active-filter chips you can clear individually, grouped Filter / Display / Actions menus, and a recently-opened-files list for one-click re-open. Open any log by path or URL, or drag one in.
- Flow Map reports — Turn a log into a screen-journey report with an activity timeline, screen visit log, and sortable issue report (see below).
- Integration adapters — Opt-in adapters attach Git state, lockfile hashes, env snapshots, test results, crash dumps, Docker inspect, and more to each session header.
Flow Map — turn a log into a screen-journey report
New in v8. Run Export Session Flow Map on any log and Saropa Log Capture reconstructs the user's path through your app as a readable report — a diagram on the left, detail columns on the right, divider draggable to trade width between them.
   Export Session Flow Map
   ┌──────────────────────┬──────────────────────────────────┐
   │  Home ─► Login ─► …  │  Executive Summary           [⧉]  │
   │    │                 │  Activity Timeline   ▁▂▅█▇▃▁▂     │
   │    ▼  screen journey │  Screen Visit Log    Home  4.2s   │
   │  Cart ─► Checkout    │  Issue Report   ⌄ time│sev│source │
   └──────────────────────┴──────────────────────────────────┘
            drag the divider ◄──► to trade width
- Executive Summary — a two-to-three sentence plain-language recap, with a hover copy icon to grab the whole thing.
- Activity Timeline — a chart of log volume over the session, so bursts and quiet stretches are obvious at a glance.
- Screen Visit Log — which screens were entered, in what order, and how long each was on top, with visit badges and edge-dwell timing.
- Interactive diagram — zoom (wheel or the +/− buttons) and drag to pan; the chart centers and fits on open and grows scrollbars instead of cropping when you zoom in. Double-click any node for a full detail card (type, time on screen, visit count, first/last times, source
file:line, log line, actions, and issues), use Center the fault to jump to the crash node, or pop the chart out (⤢) into its own panel.
- Return navigation — when the session closes a screen and goes back to an earlier one, a distinct back arrow is drawn from the closed surface to the caller, so re-entries read as returns rather than new steps.
- Off-app handoffs — when the app emits the
[flowmap] handoff tag, exits to an external app (maps, dialer, browser, share sheet) or outbound API calls appear as distinct ↗️ leaf nodes off the screen they left from, so the journey shows where the user went, not just where they stayed.
- Issue Report — every performance warning and error in one sortable table; click any header (time, severity, source…) to re-sort.
Collapse any column's sections to shrink that column aside and give the open side the room.
Features
Click to expand full feature list
Capture & Storage
- Auto-capture: Debug Console output saved to
.log files automatically.
- Deduplication: Identical rapid lines grouped as
Message (x54). Flood protection suppresses >100/sec repeats.
- File retention: Oldest logs auto-deleted when limit exceeded.
- Auto file split: Split logs by line count, size, keywords, duration, or silence.
- Context header: Each log starts with session metadata.
- Integration adapters: Opt-in adapters add header lines per session (packages, build/CI, Git, env, test results, coverage, crash dumps, Docker, performance, terminal output, Drift Advisor, and more). Configure via
saropaLogCapture.integrations.adapters. When your pubspec.yaml or package.json declares a package an adapter can enrich, Saropa Log Capture offers once to turn the matching adapter on — never enabling anything without your tap.
- Full Debug Console capture: Toggle "App Only" or set
captureAll to include system/framework logs.
- AI Activity (opt-in): Stream Claude Code AI activity into the log viewer, with colored borders and category filters. Settings under
saropaLogCapture.aiActivity.*.
Viewer
- Live sidebar viewer: Real-time output with virtual scrolling, auto-scroll, and theme support.
- Floating search: Compact search overlay (Ctrl+F) with case, whole word, regex, match navigation, and highlight vs filter mode.
- Pop-out viewer: Open the viewer as a floating window on a second monitor.
- Click-to-source: Click
file.ts:42 to jump to source; Ctrl+Click for split editor.
- Collapsible stack traces: Grouped and collapsed by default. Click to cycle: preview (first 3 app frames) / expanded / collapsed.
- Flutter exception grouping: Every copy of an
Exception caught by … block is banded as one incident (stderr, console, and FlutterErrorDetails shapes), and the verbose render-tree descendant dump folds into a collapsible group.
- Structured files:
.md, .json, .csv, .html rendered with format-aware previews.
- Insert markers (M), pin lines (P), annotate (N), bookmark (Ctrl+B).
- Inline peek: Double-click to expand surrounding context. Escape to dismiss.
- JSON rendering: Embedded JSON shown as collapsible pretty-printed blocks.
- ASCII art detection: Box-drawing characters and figlet banners detected and grouped.
- Scroll position memory: Viewer remembers position per file when switching logs.
- Tail mode: Open any workspace file matching
tailPatterns and append new lines live.
- Run navigation: "Run 1 of N" with Prev/Next; run separators with time range and issue counts.
- Explain with AI: Right-click a log line to get an explanation from the VS Code Language Model (e.g. GitHub Copilot Chat).
Logs Panel
   Logs
   ├─ contacts                  ◄ Controller (the project's own run)
   │    ├─ Lint Report
   │    ├─ Arb Translate         peripheral logs nest beneath
   │    └─ Drift Advisor
   └─ saropa.com   ⊕ 2 older    ◄ "Latest only": expand folded runs
- Controller-rooted tree: Each project's runs nest under its own session (the Controller); peripheral logs (Lint Report, Arb Translate, L10n Failures, Drift Advisor) group beneath the nearest earlier Controller of that day. Right-click Set as Controller / Mark as Peripheral, or set
saropaLogCapture.controllerNames.
- Latest only (opt-in): Off by default — every run shows. When on, the newest log of each name carries a clickable +N older badge that expands the rest in place; Controllers are never folded.
- Active-filter chips: Date, size, and name filters appear as removable chips under the header, with a dot on the options (⋮) button while any filter is active.
- Size filter: Filter the list by file size ("Filter by size"), alongside date and name filters.
- Grouped options menu: The options (⋮) menu is split into Filter, Display, and Actions flyout submenus so it fits short panels.
- Recently-opened files: The options menu lists your 10 most recently opened files (newest first) for one-click re-open.
- Open by path, URL, or drag: Open any log via Open log file… / Open log from URL…, or drag a file into the viewer.
- Markdown reports render on open; deep report folders load faster.
Search & Filter
- In-log search: Floating overlay with case, whole word, regex, and recent terms.
- Category filter: Filter by DAP category (stdout, stderr, console).
- Level filter: Toggle buttons for all 8 severity levels. Per-file state persisted.
- Log Sources: Three tier radios — Flutter DAP, Device, External — each with All / Warn+ / None.
- Tags & Origins panel: Browse auto-discovered source tags and code origins with visibility toggles.
- Source tag filter: Auto-discovers logcat tags and bracket prefixes. Click chips to toggle.
- Exclusion filter: Patterns as removable chips with count badge.
- Keyword watch: Track patterns with live counters, flash alerts, and badges.
- Saved filters: Save and apply filter combinations; built-in presets included.
- Cross-session search: Search all log files via Quick Pick.
Error Intelligence
- Smart classification: Errors auto-classified as CRITICAL, TRANSIENT, or BUG with inline badges. Configurable detection mode (strict/loose). User-editable severity keywords.
- Alerts: Flash border, sound, counter badge, optional modal popup on errors.
- Multi-level classification: Eight severity levels (Error, Warning, Info, Performance, TODO, Debug/Trace, Notice, Database) with dedicated colors and filters.
Signals
- Signals panel: Single icon-bar panel (lightbulb). Accordion sections: Collections (named groups of logs/files), All Signals (unified cross-session list sorted by severity), Frequently Modified Files, and Performance (current, trends, database, errors).
- Signal reports: Evidence-backed reports for each detected signal with confidence labels, line links, and action buttons.
- Copy a signal: Each signal row has a 📋 Copy action that puts a paste-ready markdown block on the clipboard — the signal's metadata, raw example, and full supporting log lines — ready to drop into an analysis engine.
- Database signals: N+1 detection, slow query burst markers, baseline volume hints, and session SQL comparison — each independently togglable.
Display & Layout
- Line decorations: Severity dots, counters, timestamps, elapsed time — each togglable independently.
- Lint diagnostic badges: Inline badges for lines referencing files with active VS Code diagnostics. Works with all linters.
- Severity bar mode: Colored left borders by log level.
- Visual spacing: Optional breathing room before/after level changes, markers, and stack traces (V key).
- Font size / line height: Adjustable via Options panel sliders or keyboard shortcuts.
- Scrollbar minimap: Visual overview showing search matches, errors, warnings, and viewport position.
- Highlight rules: Color lines matching patterns (configurable colors, labels).
Collections
- Named collections: Group related logs and files for investigating a specific bug, feature, or incident.
- Collections panel: Dedicated slide-out panel (I key) for creating, merging, and managing collections.
- Share: Export as
.slc bundle, Gist, deep link, or LAN share.
- Import: Command Palette → Import .slc Bundle to restore shared collections.
Export
- Flow Map report: Export a log as a screen-journey report — activity timeline, sortable Issue Report, executive summary, and collapsible/resizable sections (Export Session Flow Map).
- Per-level export: Export filtered logs with preset templates (Errors Only, Full Debug, etc.) or custom level selection.
- HTML export: Static or interactive with search, filters, and theme toggle.
- CSV / JSON / JSONL export: Structured formats for external tools.
- Export to Loki: Push sessions to Grafana Loki.
- Hover copy icon: Hover any line to copy with one click.
- Multi-format copy: Plain text, markdown, raw, snippet (GitHub/GitLab fence).
Status Bar & Audio
- Status bar: Pause/resume icon + line count with watch counts.
- Audio alerts: Configurable sounds for errors/warnings with volume, rate limiting, and preview.
Infrastructure
- Project index: Lightweight index under
.saropa/index/ for faster analysis and doc matching.
- Script fault isolation: Each viewer feature runs in a separate script block.
- App-only stack traces (A key), stack deduplication, session summary.
Works Best With
Works standalone, but unlocks richer diagnostics paired with these companion extensions:
| Extension |
What it adds to Log Capture |
| Saropa Lints |
Bug reports include lint violations filtered by impact, OWASP summaries, health scores, and "Explain rule" links. |
| Saropa Drift Advisor |
Session metadata carries query performance stats, schema summaries, anomaly counts, and index suggestions. Right-click SQL lines for "Open in Drift Advisor". |
One-click install: Get all three with the Saropa Suite extension pack.
Requirements
- VS Code ^1.108.1 — also available via Open VSX for compatible editors.
- Node.js >= 22 for building and tests. Optional: use the Dev Container (
.devcontainer/devcontainer.json). See CONTRIBUTING.md.
Remote Development
Fully supports Remote SSH, WSL, and Dev Containers. Use a relative logDirectory (reports, .logs) to keep captures inside your remote workspace — no extra setup.
Configuration
All settings are prefixed with saropaLogCapture. — see plans/guides/configuration.md for the full settings reference.
Key settings:
| Setting |
Default |
Description |
enabled |
true |
Enable/disable automatic log capture |
logDirectory |
"reports" |
Where to save log files (relative to workspace root) |
captureAll |
false |
Capture all Debug Console output, bypassing filters |
Tip: To capture system/framework noise alongside your app logs, toggle App Only: OFF in the viewer or set captureAll to true.
Log Tag Vocabulary
Prefix a log line with a recognized bracket tag to route it to a severity level the viewer's filter dots control. The classifier auto-detects framework database lines (Drift SQL, [Drift]/[Isar] tags, DRIFT: prefixes); tags route your own lines — those using app vocabulary the heuristic can't read — into the same groups.
[db] bulkPreload wrote 185 rows          → database level (hidden by the DB dot)
[perf:cold start] first frame 1840ms     → performance level
[todo:DRIFT-412] backfill missing rows   → todo level
Format: [TAG] or [TAG:metadata]. The tag name is everything before the first colon; metadata after it stays visible inline. So [db:phase 2] and [db:retry] both group as db. The tag is matched at the start of the line, tolerating logcat (I/flutter), threadtime, and Flutter [log] prefixes. An explicit tag wins over keyword guesses ([db] … failed stays database, not warning), but a real error still wins over the tag ([db] Error: … stays error).
Unlisted bracket tags still work — they become free-form Message-Tag chips in the filter drawer (they just don't change the severity level).
Tags that set a severity level (case-insensitive):
- database —
db database sql query drift isar sqlite sqlite3 sqflite hive realm postgres mysql mongo mongodb dynamodb redis orm dao prisma sequelize migration rowcount
- error —
err error fatal panic crash exception abort
- warning —
warn warning caution deprecated retry fallback degraded
- performance —
perf performance slow latency timing profile jank frame fps gc memory bench benchmark
- todo —
todo fixme hack xxx kludge workaround tech-debt
- notice —
notice note important banner milestone lifecycle
- debug —
debug trace verbose breadcrumb dump spew devlog
Recommended neutral tags (stay info — no level change, but group as filterable chips; use whatever your domain needs):
- network / http —
net network http https api request response rest graphql ws websocket socket grpc rpc fetch download upload
- auth / security —
auth login logout session token jwt oauth sso perm permission acl role crypto sign verify security
- ui / render —
ui ux widget render paint layout theme anim animation gesture focus scroll view screen page
- navigation —
nav route router deeplink tab redirect
- sync / state —
sync state store redux bloc provider riverpod getx reducer hydrate persist
- data / serialize —
json parse serialize deserialize encode decode mapper schema validation form
- lifecycle / system —
init boot startup shutdown config env version build release feature-flag flag experiment plugin native platform isolate thread worker queue job scheduler timer
- media / device —
media image photo audio video camera file fs io disk location gps geo map bluetooth ble nfc sensor battery
- product / domain —
analytics telemetry metrics event track notification push fcm apns badge billing purchase iap payment subscription ads share social onboarding search filter pagination
- i18n / format —
i18n l10n locale intl currency date tz timezone
See plans/guides/source-logger-best-practices.md for emit examples, and plans/guides/correlation-tags.md for the separate mid-line type:value correlation tags.
Extension API
Other VS Code extensions can consume a typed API from Saropa Log Capture:
import * as vscode from 'vscode';

// In your extension's activate():
const ext = vscode.extensions.getExtension('saropa.saropa-log-capture');
if (!ext) { return; }
const api = ext.isActive ? ext.exports : await ext.activate();

// Subscribe to live log lines
context.subscriptions.push(
    api.onDidWriteLine((line) => {
        // `stderr` can carry non-error info; classify by text/category policy instead.
        if (/\b(error|exception|fatal|failed)\b/i.test(line.text)) {
            console.log(`Error: ${line.text}`);
        }
    }),
);

// Session lifecycle
context.subscriptions.push(
    api.onDidStartSession((session) => {
        console.log(`Capture started: ${session.projectName}`);
    }),
);

// Write lines into the active capture session
api.writeLine('Slow query detected (1250ms)', {
    category: 'drift-perf',
    timestamp: queryEndTime,
});

// Query current state
const info = api.getSessionInfo();
if (info?.isActive) {
    api.insertMarker('My extension checkpoint');
}

// Register an integration provider
context.subscriptions.push(
    api.registerIntegrationProvider({
        id: 'my-extension',
        isEnabled: () => true,
        onSessionStartSync: () => [{
            kind: 'header',
            lines: ['My Extension: active'],
        }],
    }),
);
See api-types.ts for the full type definitions.
Key Commands
| Command |
Description |
Saropa Log Capture: Start Capture |
Start capturing to a new log file |
Saropa Log Capture: Stop Capture |
Stop capturing and finalize the file |
Saropa Log Capture: Pause/Resume Capture |
Toggle capture on/off |
Saropa Log Capture: Insert Marker |
Insert a visual separator into the log |
Saropa Log Capture: Search Log Files |
Search across all log files |
Saropa Log Capture: Compare Sessions |
Side-by-side diff of two log sessions |
Saropa Log Capture: Export Session Flow Map |
Build a screen-journey Flow Map report from a log |
Saropa Log Capture: Import .slc Bundle |
Import a shared .slc session bundle |
Saropa Log Capture: Getting Started |
Open the Getting Started walkthrough |
Full command list available via Command Palette (Ctrl+Shift+P → "Saropa").
Keyboard Shortcuts
Press F1 inside the viewer for the full interactive reference with descriptions and rebinding.
| Shortcut |
Action |
| F1 |
Open keyboard shortcuts reference |
| Ctrl+F |
Open search overlay |
| F5 |
Start debugging (VS Code built-in) |
See plans/walkthrough/keyboard-shortcuts.md for the complete list, or open Options → Keyboard shortcuts... in the viewer. All 51 power shortcuts are rebindable via saropaLogCapture.viewerKeybindings.
Known Limitations
- Empty or near-empty log files: If the Debug Console has output but the open log shows only a header, use Prev/Next in the viewer and enable
diagnosticCapture to inspect the pipeline. See Runbook: Missing or empty log files.
- Viewer line cap: The viewer shows the first N lines (
viewerMaxLines, default 50,000). The full file is kept on disk up to maxLines (default 100,000). Toolbar shows "Showing first X of Y lines" when truncated.
- Debug Console only: The main capture stream is from the VS Code Debug Console (DAP). Enable the
terminal integration adapter to also capture Integrated Terminal output.
- Some Debug Console lines are not capturable: A few lines are rendered into the Debug Console by VS Code itself (e.g. adapter-internal logging or process stdout shown directly), not delivered to extensions as DAP
output events. The Debug Adapter Protocol is the only channel this extension receives, so those lines cannot be captured. Separately, when captureAll is off, lines whose DAP category is not in saropaLogCapture.categories are filtered out — the first time each such category is dropped, the Saropa Log Capture output channel logs the category name and how to capture it. Enable captureAll (the default) to capture every category. With captureAll on, the only in-extension reason a line is hidden is a matching saropaLogCapture.exclusions pattern; the first time each pattern hides a line, the output channel names that pattern too.
Accessibility
The webview viewer supports keyboard and assistive tech. Main content has a main landmark; the icon bar is a toolbar; the log area has role="log" with live region announcements. Slide-out panels have region landmarks; focus moves into them on open and returns on Escape. For the full audit, see plans/028_plan-webview-accessibility.md.
Contributing
Contributions and feedback are welcome — something broken, missing, or confusing? Open an issue or submit a PR. See CONTRIBUTING.md for developer setup, code quality standards, and contribution guidelines.
Quick start: Fork → feature branch → npm run compile → Pull Request.
Testing (F5): Open in VS Code → F5 → Extension Development Host. For the test suite, install the recommended Extension Test Runner and use the Testing view, or run npm test.
Translations
The extension ships localized UI strings for 11 locales: Chinese (Simplified & Traditional), German, Spanish, French, Italian, Japanese, Korean, Portuguese (Brazil), and Russian. Corrections welcome — email language@saropa.com.
Documentation
License
MIT — see LICENSE. Use it however you like.
Built by Saropa. Questions? Ideas? Open an issue.
GitHub | Issues | Saropa
v8.0.0 · 2026-06-09
| |