
Catch memory leaks, security vulnerabilities, and runtime crashes that standard linters miss.
Developed by Saropa to make the world of Dart & Flutter better.
💬 Have feedback on Saropa Lints? Please share it by opening an issue on GitHub!
VS Code Extension (Recommended)
Install the Saropa Lints VS Code extension for the full experience. Also on Open VSX (Cursor, VSCodium).
The package and the extension are one product — published together and versioned in sync. The Dart package provides the rules; the extension is the primary setup, configuration, and triage surface. This README is the single source for both the pub.dev and Marketplace listings.
Lint integration defaults on for Dart workspaces (saropaLints.enabled). Overview and setup stay available even when integration is off; turn it off with Saropa Lints: Turn Off Lint Integration if you only want the sidebar without analyzer runs. After installing, run "Saropa Lints: Getting Started" from the Command Palette for a guided tour of all features.
At a glance:
- Health Score — 0–100 score in the status bar; green/yellow/red bands in the Overview
- Violations view — Violations grouped by severity and file, with Error Lens-style inline annotations; multi-select works with Copy as JSON
- Security Posture — OWASP Top 10 coverage matrix, compliance export
- Triage — Disable noisy rules from the UI; see estimated score impact before acting
- Rule packs / Manage Rule Packs — Enable stack bundles (Riverpod, Drift, …) and per-package packs from Saropa Lints: Manage Rule Packs (editor tab: per-pack toggles, inline rule lists, an "Enable all recommended packs" action, target platforms when embedder folders exist); see
doc/guides/rule_packs.md
- Package Vibrancy — Dependency health, alerts, and optional version-gap PR/issue triage (enable with
saropaLints.packageVibrancy.enableVersionGap; a GitHub token improves results)
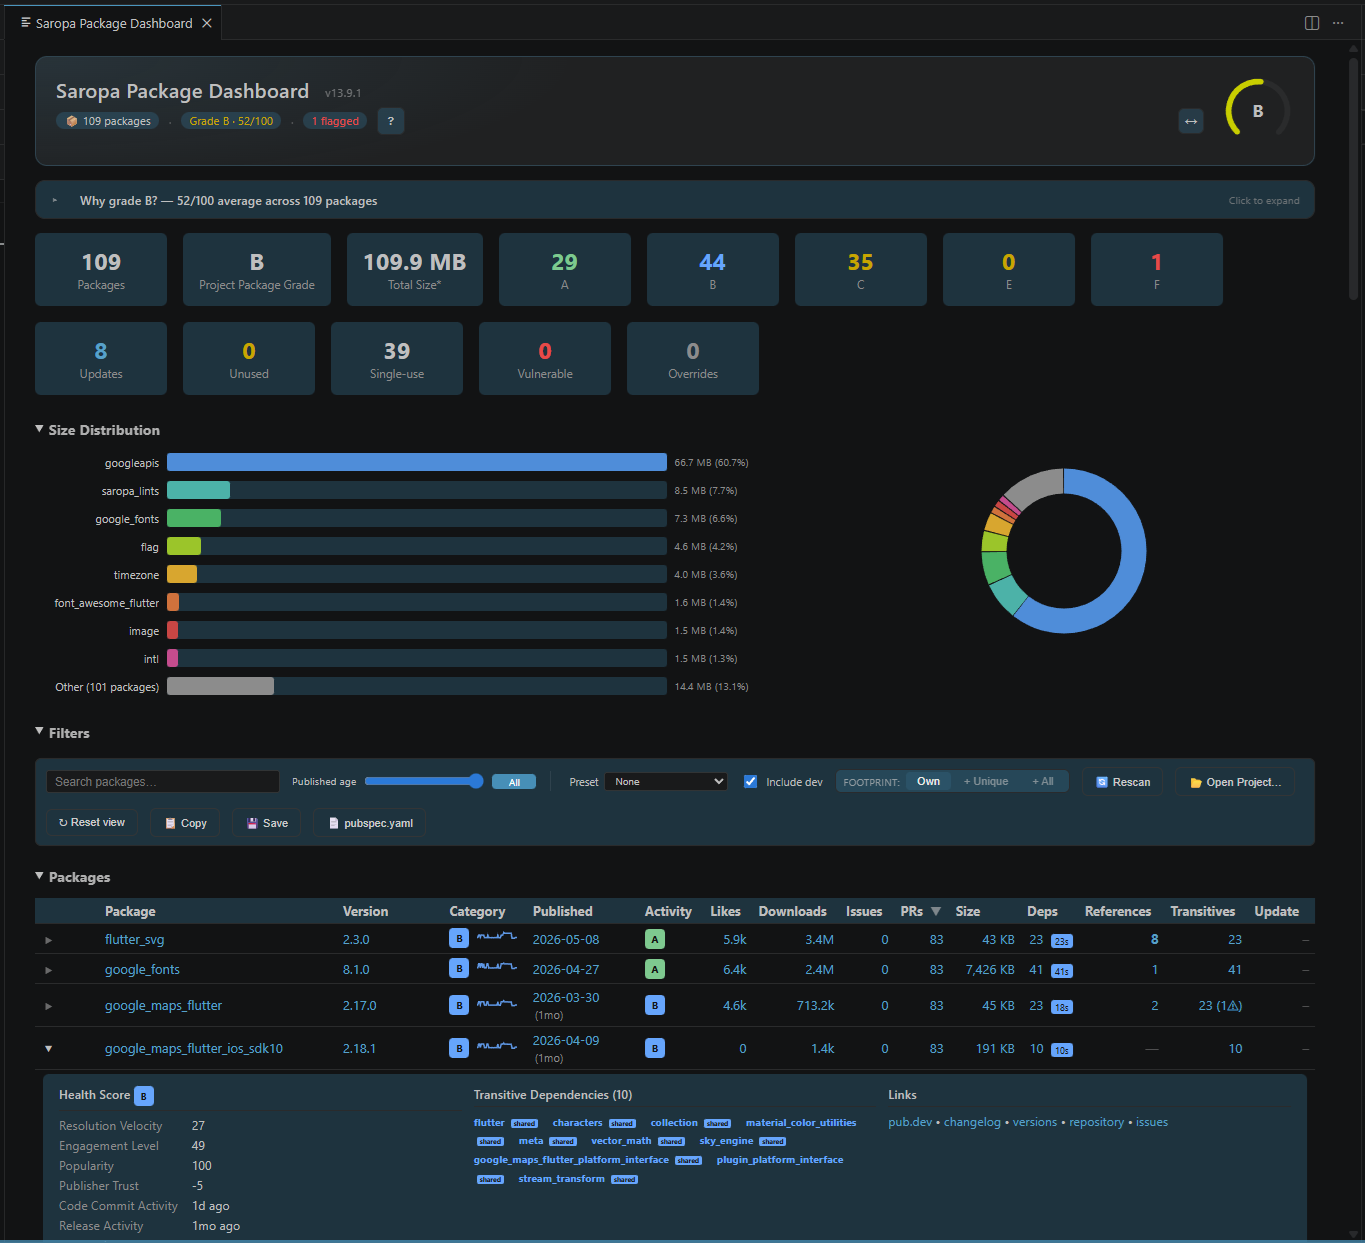
- Project Vibrancy — Project code-health scoring for your own Dart source via Open Code Health Dashboard (editor-area webview; same scan as the CLI JSON output); use the graph icon on Violations, Overview, Config, or Package Vibrancy view titles, or the Command Palette
- TODOs & Hacks — Sidebar scan for TODO/FIXME/HACK-style markers; full-workspace scan is opt-in (
saropaLints.todosAndHacks.workspaceScanEnabled; leave false until you need it) via TODOs & Hacks: Enable workspace scan
- File Risk — Files ranked by violation density; focus on the riskiest first
- Trends — Score progression over time with milestone celebrations
Problems panel empty, analyzer plugin stuck, or no lightbulb fixes? Start with doc/troubleshooting.md (narrow IDE-focused checks) — then README Troubleshooting if you still need broader setup help.
Set Up Project wires pubspec.yaml, analysis_options.yaml, and analysis. No terminal commands required for that path.
Requirements
- Dart SDK (or Flutter SDK) on PATH
- A Dart/Flutter project (workspace with
pubspec.yaml)
Usage
- Open a Dart/Flutter project.
- Open the Saropa Lints view (checklist icon in the activity bar). Overview & options lists workspace settings, Activity bar sections (the default place to show/hide panels), and links (About, Getting Started).
- When you are ready to wire the package in, run Saropa Lints: Set Up Project (pubspec + config) (or click Lint integration: Off if you disabled integration). That will add
saropa_lints to dev_dependencies, run pub get, run write_config for your tier, and optionally analyze.
- Run "Saropa Lints: Getting Started" from the Command Palette for a guided tour of all features.
- Use Run Analysis and Open Analysis Options as needed. Violations appear in the Violations view when
reports/.saropa_lints/violations.json exists (written by the analyzer).
Health Score
A single 0–100 number in the Overview and status bar, computed from violation count and impact severity. Higher is better:
- 80–100 (green): Good shape — few issues, none critical.
- 50–79 (yellow): Needs work — some high-impact issues.
- Below 50 (red): Serious problems — many critical/high-impact violations.
The status bar shows the score with a delta from the last run, plus the finding count, in a single item (e.g. "Saropa: 78 ▲4 · ⚠ 12"); its background stays neutral rather than turning red, and the score is held back until a full analysis has covered enough of the project. When violations decrease, a celebration message includes the score change.
Violations view
The Violations view lists lint findings from your analysis report in a tree: first by severity (Error, Warning, Info), then by project structure (folders and files). Each file lists violations (capped per file; excess shown as “and N more…”).
- Group by (toolbar): Change how the tree is organized — by Severity (default), File, Impact, Rule, OWASP Category, Rule Type, or Rule Status. Click the tree icon in the toolbar to switch.
- Filters (toolbar): Filter by text (file path, rule, or message), Filter by type (severity and impact), Filter by rule (multi-select), or Filter by rule metadata (
ruleType / ruleStatus). When active, the view shows “Showing X of Y”.
- Suppressions: Right-click a folder, file, violation, or severity node to hide it from the tree (e.g. “Hide folder”, “Hide rule”). Suppressions are persisted; use Clear suppressions in the toolbar to restore all.
- Code Lens: In Dart files that have violations, a lens at the top shows e.g. “Saropa: 3 violations — Show in Saropa”. Click to open the Violations view filtered to that file.
- Multi-select + JSON: Ctrl+click (Windows/Linux) or Cmd+click (macOS) multiple tree rows, then Copy as JSON (context menu or toolbar) to export those subtrees. For all violations at once, use
reports/.saropa_lints/violations.json (see VIOLATION_EXPORT_API.md).
- Context menus: Explain rule (book icon) opens a side tab with full rule details; Apply fix (wrench icon) and Copy message (clipboard icon), then a separator, then hide options: Hide rule from view, Hide rule in this file. On folders/files: Hide folder, Hide file, Copy path; on files: Fix all in file, Show only this file. On severity nodes: Hide this severity.
- Explain rule: Right-click a violation and choose Explain rule (or run Saropa Lints: Explain rule from the command palette and pick a rule) to open a tab beside your code with the rule’s problem message, how to fix, severity, impact, OWASP mapping (if any), and a link to the ROADMAP.
- Violation tooltips: Show rule name and a “More” link to rule documentation (ROADMAP).
- Summary → Violations: Click Total violations in the Summary view to open the Violations view with all findings (clears any active filters). By severity / By impact rows open Violations with the matching filter, and By rule type / By rule status rows open Violations filtered to matching metadata groups.
- Problems view: Right-click a problem and choose Saropa Lints: Show in Saropa Lints to focus the Violations view filtered to the active file.
The File Risk view ranks files by weighted violation density (same weights as the Health Score). Files with critical violations appear first with a flame icon. Click a file to filter the Violations view to that file.
The Security Posture view shows OWASP Mobile and Web Top 10 coverage based on the active rules and violations. Right-click a category to export an OWASP compliance report.
The Triage view focuses on rule groups by impact/volume and quick enable/disable actions, while full config controls live in Config Dashboard.
TODOs & Hacks — Todo-Tree-style markers (TODO, FIXME, …) after you opt in to workspace scanning (saropaLints.todosAndHacks.workspaceScanEnabled, default off to avoid heavy full-repo I/O). Until then, the view shows Enable workspace scan… (or use TODOs & Hacks: Enable workspace scan). No violations.json required. Default globs: Dart, YAML, TypeScript, JavaScript; add **/*.md to includeGlobs if you want Markdown. Toolbar: Refresh, Toggle group by tag / folder. Auto-refresh on save respects the same gate. Custom regex: saropaLints.todosAndHacks.customRegex.
The Logs view lists analysis reports from reports/. Each log shows a parsed hint (e.g. violation counts, init tier). A "Run Analysis" action appears when the latest report is over 1 hour old.
Package Vibrancy activity signal
The Package Vibrancy report includes an Activity grade column (A-F) that reflects maintenance activity separately from overall vibrancy.
- Uses both code activity (last commit from GitHub
pushed_at) and release activity (latest pub.dev publish date).
- Activity score uses a 90-day decay for both timelines and takes the weaker side.
- Report surfaces dormancy hints:
- 90+ days with no commits and no releases: stale
- 180+ days with no commits and no releases: dormant
This helps distinguish "not recently released but still actively maintained" from "no recent release and no recent code changes."
Code Health (your own source)
The Code Health Dashboard scores the functions in your own Dart code (separate from Package Vibrancy, which scores dependencies).
- Scans your project with
dart run saropa_lints:project_vibrancy and shows the worst function hotspots in an editor-tab dashboard.
- KPI cards double as one-click filters for
unused, uncovered, stub_tested, suspicious_coverage, and test_drift.
- Free-text search filter, sortable table, and active-filter chip strip.
- Quality gates (min grade, max-unused, max-uncovered, etc.) configured under Code Health settings — failures show a banner and are surfaced as a warning toast.
- Run from the Command Palette via Saropa Lints: Open Code Health Dashboard, from the Saropa Lints sidebar entry Code Health Dashboard, or from the in-dashboard Rescan button.
Extension settings
| Setting |
Default |
Description |
saropaLints.enabled |
true |
Lint integration for this workspace (upgrade checks, status-bar treatment). Overview stays usable when off; use Set Up Project to add the package and config. |
saropaLints.tier |
recommended |
Tier used when enabling or re-initializing (essential, recommended, professional, comprehensive, pedantic). |
saropaLints.runAnalysisAfterConfigChange |
true |
Run dart analyze after init when enabling. |
saropaLints.runAnalysisOpenEditorsOnly |
false |
When true, Run Analysis runs dart/flutter analyze only for Dart files currently open in VS Code (workspace text documents) under the detected project root (pubspec.yaml directory). |
saropaLints.issuesPageSize |
100 |
Max violations shown per file in the Violations tree (1–1000). Remaining appear as “and N more…”. |
saropaLints.violationsGroupBy |
impact |
Default tree grouping: impact, severity, file, rule, owasp, ruleType, or ruleStatus. impact lists Critical / High first. Change anytime from the Violations toolbar. |
Sidebar defaults: Commands (searchable index of every command), Overview & options, Violations, Config Dashboard, and Package Vibrancy show in the activity bar by default. Use Saropa: Open Package Dashboard for the full dependency report in an editor tab. Overview includes embedded Health Summary, Next Steps, and Riskiest Files groups when violations exist. Package Details appears automatically after a Vibrancy scan. Turn on standalone Triage, Summary, Security, File Risk, TODOs, etc. from Overview & options -> Activity bar sections (default path) or Settings (saropaLints.sidebar.show* advanced mirror).
| TODOs & Hacks |
|
|
saropaLints.todosAndHacks.workspaceScanEnabled |
false |
When true, the view scans the workspace for comment markers (resource-intensive). |
saropaLints.todosAndHacks.tags |
["TODO", "FIXME", "HACK", "XXX", "BUG"] |
Tags to search for in comments (case-sensitive). |
saropaLints.todosAndHacks.includeGlobs |
["**/*.dart", "**/*.yaml", "**/*.ts", "**/*.js"] |
Glob patterns for files to scan. |
saropaLints.todosAndHacks.excludeGlobs |
["**/node_modules/**", "**/.dart_tool/**", "**/build/**", "**/.git/**"] |
Extra exclude patterns (merged with search.exclude). |
saropaLints.todosAndHacks.maxFilesToScan |
2000 |
Maximum number of files to scan; view shows a message when capped. |
saropaLints.todosAndHacks.autoRefresh |
true |
Refresh the TODOs & Hacks view when a file is saved (debounced). |
saropaLints.todosAndHacks.groupByTag |
false |
When true, group tree by tag (TODO, FIXME, …) then by file; when false, by folder then file. |
saropaLints.todosAndHacks.customRegex |
"" |
Optional regex override for comment markers. Use capture group 1 for tag, optional group 2 for snippet. Empty = default (//, #, <!-- + tags). Invalid regex falls back to default. |
Extension commands
- Saropa Lints: Getting Started — Open the walkthrough with a guided tour of all features.
- Saropa Lints: Set Up Project (pubspec + config) — Add
saropa_lints to the project and run init (and optionally analyze).
- Saropa Lints: Turn Off Lint Integration — Disable integration for this workspace (does not remove files).
- Saropa Lints: Run Analysis — Run
dart analyze / flutter analyze.
- Saropa Lints: Initialize / Update Analysis Options — Write analysis_options.yaml with the current tier (uses write_config).
- Saropa Lints: Open Analysis Options — Open
analysis_options_custom.yaml or analysis_options.yaml.
- Filter by text… / Filter by severity and impact… / Filter by rule name… / Filter by rule metadata… — Filter the Violations tree (view toolbar).
- Clear filters / Clear suppressions — Reset filters or hidden items (view toolbar when active).
- Saropa Lints: Show All Violations — Open the Violations view and show all findings (clears filters). Used when clicking "Total violations" in Summary.
- Saropa Lints: Show in Saropa Lints — Focus the Violations view filtered to the active editor's file (e.g. from Problems view context menu or command palette).
- Group by… — Change how the Violations tree is organized: Severity, File, Impact, Rule, OWASP Category, Rule Type, or Rule Status (view toolbar).
- Explain rule — On a violation in the Violations tree (context menu) or from the command palette (pick a rule): open a side tab with full rule details (message, fix, severity, impact, OWASP, ROADMAP link).
- Apply fix — On a violation in the Violations tree (context menu): run the Dart analyzer's quick fix for that location without opening the file.
- Fix all in this file — On a file in the Violations tree (context menu): run all available quick fixes for that file bottom-up.
- TODOs & Hacks: Refresh — Refresh the TODOs & Hacks view (full rescan only when workspace scan is enabled).
- TODOs & Hacks: Enable workspace scan — Turn on
workspaceScanEnabled so marker search can run.
- Create Saropa Lints Instructions for AI Agents — Create
.cursor/rules/saropa_lints_instructions.mdc in the workspace from the bundled template (Overview & options → Help & resources or Command Palette). Gives AI agents project guidelines for working on saropa_lints.
- TODOs & Hacks: Toggle group by tag / folder — Switch between grouping by folder→file→line and by tag→file→line (view toolbar).
- Export OWASP Compliance Report — Generate a markdown report with Mobile/Web Top 10 coverage tables and gap analysis.
On a violation, the two “Hide” options mean:
| Option |
Effect |
| Hide rule from view |
Hides that rule everywhere in the Violations tree (all files). |
| Hide rule in this file |
Hides that rule only in this file; the same rule still appears in other files. |
(“Hide this impact” is not shown on violations: it would hide all violations with that impact level, which is confusing from a single violation. Severity nodes still have “Hide this severity”.)
These are view-only suppressions: they do not change analysis_options.yaml or source code. They are stored in workspace state and only affect what the Violations tree shows.
To undo or manage: Use Clear suppressions in the Violations view toolbar (it appears when any suppressions are active). That clears all hidden folders, files, rules, rule-in-file, severities, and impacts at once. There is no per-item “unhide”; clearing restores everything. To see or edit raw suppressions you would need to inspect workspace state (e.g. extension storage); the UI only offers Clear suppressions.
API for other extensions
When the extension is activated, it exposes a public API so other extensions (e.g. Saropa Log Capture) can read violations and run analysis without parsing violations.json from disk.
Usage:
const ext = vscode.extensions.getExtension<import('./api').SaropaLintsApi>('saropa.saropa-lints');
if (ext?.exports) {
  const data = ext.exports.getViolationsData();
  const path = ext.exports.getViolationsPath();
  const params = ext.exports.getHealthScoreParams();
  const version = ext.exports.getVersion();
  await ext.exports.runAnalysis();
  await ext.exports.runAnalysisForFiles(['lib/main.dart', 'lib/auth.dart']);
}
| Method |
Description |
getViolationsData() |
Same shape as violations.json; null if no project root or read fails. |
getViolationsPath() |
Absolute path to reports/.saropa_lints/violations.json; null if no project root. |
getHealthScoreParams() |
{ impactWeights, decayRate } used by the health score formula. |
runAnalysis() |
Runs full dart analyze / flutter analyze in the workspace. Returns true if exit code 0. |
runAnalysisForFiles(files) |
Runs analyze for the given file paths only (e.g. stack-trace files). Capped at 50 files. Returns true if exit code 0. |
getVersion() |
Extension version string (e.g. from package.json). |
The file contract reports/.saropa_lints/violations.json remains the primary integration point; the API is optional and allows Log Capture to avoid disk reads and to refresh analysis for specific files. For the violation export schema, see VIOLATION_EXPORT_API.md. The same violations.json file is used by Saropa Log Capture for bug report correlation — crash reports include the project's health score and OWASP violations affecting the crash file.
Scope: Static Code vs. Runtime Data (Drift)
saropa_lints and Saropa Drift Advisor are complementary, not overlapping. They analyze different things and should both be installed when you use Drift.
|
saropa_lints |
saropa_drift_advisor |
| Analyzes |
Dart source code (AST) |
Live database file, schema, and data statistics |
| Runs as |
Analyzer plugin (compile-time) |
VS Code extension + debug server (runtime) |
| Drift rules |
32 static code-pattern rules in lib/src/rules/packages/drift_rules.dart |
Runtime/schema diagnostics — anomalies, invariants, data quality, query performance |
| Examples |
avoid_drift_enum_index_reorder, avoid_drift_update_without_where, require_drift_database_close |
Column-value outliers, schema drift, n+1 query detection, unique-index gaps |
| Sees source |
Yes |
No |
| Sees data |
No |
Yes |
Rule of thumb:
- A problem with the code you wrote (wrong TypeConverter, missing
WHERE, unclosed DB) → saropa_lints.
- A problem with the data in your running DB (unexpected distribution, schema mismatch, missing migration) →
saropa_drift_advisor.
Neither project will ever subsume the other — they operate on different inputs. File Drift-rule bugs against whichever project owns the rule surface that produced the diagnostic (look at the source / owner field in the Problems panel).
Quick Start
Requirements: Dart SDK >=3.9.0 <4.0.0 (same constraint as this package’s pubspec.yaml).
Option A — VS Code extension (recommended)
- Install Saropa Lints from the VS Code Marketplace
- Open the Saropa Lints sidebar (checklist icon in the activity bar)
- Run Saropa Lints: Set Up Project (or use the equivalent control in the Overview) to add the package and analysis config
The extension adds saropa_lints to your project, configures analysis options, and runs analysis. Use the Setup & triage view to change tier, disable rules, and manage platforms/packages. Run Saropa Lints: Getting Started from the command palette for a guided tour.
Option B — Tier preset (zero-config, no extension)
dart pub add --dev saropa_lints
Add one line to your analysis_options.yaml:
include: package:saropa_lints/tiers/recommended.yaml
Run dart analyze and issues appear in your IDE and terminal.
Available presets: essential.yaml · recommended.yaml · professional.yaml · comprehensive.yaml · pedantic.yaml
Option C — CLI init (full control, CI/scripting)
dart pub add --dev saropa_lints
dart run saropa_lints:init --tier recommended
# Optional: rule packs from pubspec + lockfile (see doc/guides/rule_packs.md)
dart run saropa_lints:init --list-packs
dart run saropa_lints:init --tier recommended --enable-pack riverpod --enable-pack drift  # IDs must match packs applicable to your pubspec
Note: The CLI init is headless-only as of v9 — no interactive prompts. For interactive setup, use the VS Code extension.
Rule configuration cheatsheet
Use this mental model:
- Tier = broad baseline (
essential → pedantic)
- Packs = domain/version bundles (library and SDK migration groups)
Current behavior:
- Pack-owned package/SDK migration rules are off unless their pack is enabled.
- Tier selection still controls non-pack-owned rules.
- Explicit
diagnostics: rule_name: false still disables a rule.
Minimal setup pattern:
plugins:
  saropa_lints:
    version: "x.y.z"
    rule_packs:
      enabled:
        - riverpod
        - flutter_sdk_3_32
Quick commands:
dart run saropa_lints:init --tier recommended
dart run saropa_lints:init --list-packs
dart run saropa_lints:init --tier recommended --enable-pack riverpod --enable-pack flutter_sdk_3_32
If users are unsure, start with a tier only and enable packs later.
This updates (or creates) two files:
analysis_options.yaml — the plugins: saropa_lints: diagnostics: section is regenerated with every rule set to true/false for your tier. All other sections are preserved.analysis_options_custom.yaml — your project settings (platforms, analysis output). Created on first run; never overwritten.
Optional runtime tier cap: to enforce a stricter cumulative band than the rules still listed as enabled in YAML (for example in CI), set the SAROPA_TIER environment variable to essential, recommended, professional, comprehensive, or pedantic, or set saropa_tier in analysis_options_custom.yaml or runtime_tier / saropa_tier under plugins.saropa_lints in analysis_options.yaml — when both env and file are set, the environment variable wins.
Run analysis
dart analyze
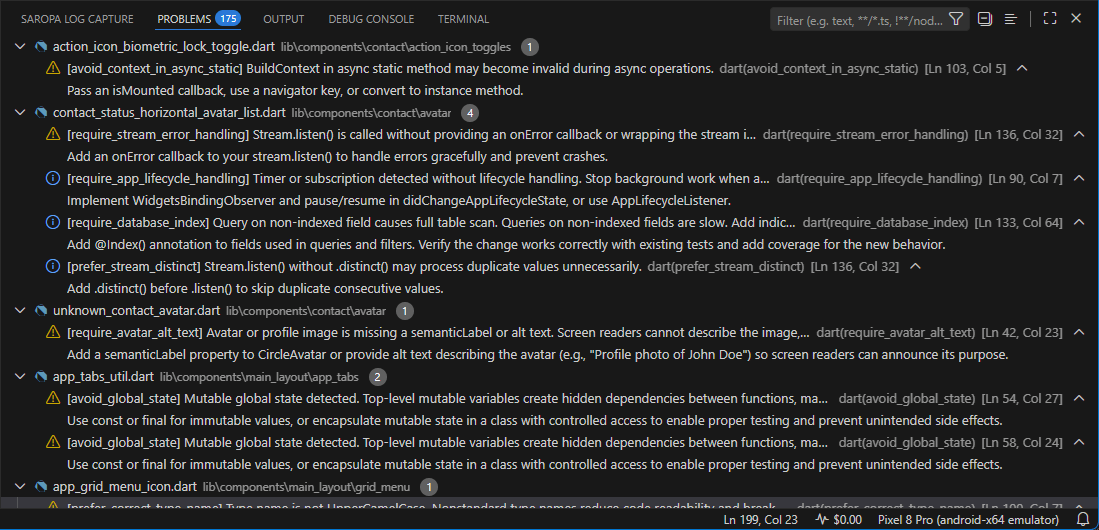
Issues appear in your IDE's Problems panel and in the terminal. Saropa Lints runs as a native Dart analyzer plugin.
Available tiers: essential · recommended · professional · comprehensive · pedantic — see The 5 Tiers for details
Stuck? See Troubleshooting · Upgrading? See Migration guides
How It Works
Dart package                    VS Code extension
   │                                  │
   ▼                                  ▼
analysis_options.yaml  ◄───  Set Up Project / Set Tier / Triage
   │                                  │
   ▼                                  ▼
dart analyze           ◄───  Run Analysis (from UI)
   │                                  │
   ▼                                  ▼
violations.json        ───►  Health Score, Issues, Security,
                             File Risk, Trends, Inline Annotations
The Dart package provides 2134 lint rules via the native analyzer plugin. The VS Code extension reads violations.json and provides the UI: Health Score, Issues tree, Security Posture, File Risk, Setup & triage, and related views. Optional Drift Advisor integration shows index suggestions and data-quality anomalies from a running Drift Advisor server in a dedicated sidebar view and in Problems. Both are published together and versioned in sync.
Rule metadata: Each rule can expose optional semantics—RuleType (bug, vulnerability, code smell, security hotspot), tags, MITRE CWE IDs, and RuleStatus (e.g. beta)—for compliance and future quality gates. Defaults are backward compatible; see CONTRIBUTING.md and bugs/discussion/RULE_METADATA_BULK_STATUS.md.
Why Saropa Lints?
Linting vs static analysis
dart analyze checks syntax and style. Static analysis checks behavior.
Your linter catches unused variables and formatting issues. It doesn't catch undisposed controllers, hardcoded credentials, or setState after dispose — because these require understanding what the code does, not just how it's written.
In mature ecosystems, tools like SonarQube, Coverity, and Checkmarx fill this gap. Flutter hasn't had an equivalent — until now.
What it catches
Code that compiles but fails at runtime:
// Memory leak — controller never disposed
final _controller = TextEditingController();

// Crash — setState after widget disposed
await api.fetchData();
setState(() => _data = data);  // boom

// State loss — new GlobalKey every build
Widget build(context) {
  final key = GlobalKey<FormState>();  // wrong
  return Form(key: key, ...);
}
Saropa Lints detects these patterns and hundreds more:
- Security — Hardcoded credentials, sensitive data in logs, unsafe deserialization
- Accessibility — Missing semantics, inadequate touch targets, screen reader issues
- Performance — Unnecessary rebuilds, memory leaks, expensive operations in build
- Lifecycle — setState after dispose, missing mounted checks, undisposed resources
Accuracy focused: Rules use proper AST type checking instead of string matching, reducing false positives on variable names like "upstream" or "spinning".
Stop Debugging Known Issues
Saropa Lints specifically targets the error messages developers search for when their app crashes. It statically analyzes and prevents:
- Memory Leaks:
TextEditingController, AnimationController, and StreamSubscription created but never disposed.
- Concurrency Bugs:
BuildContext usage across async gaps and unawaited futures in initState.
- Security Flaws: Hardcoded API keys, insecure HTTP (cleartext), and weak cryptography.
- UI Crashes:
setState() called after dispose(), layout overflow risks, and null assertions on backend data.
- State Errors:
Riverpod providers reading inside build or Bloc events added in constructors.
Essential for popular packages
If you use GetX, Riverpod, Provider, Bloc, Isar, Hive, or Firebase, these audits are critical. These libraries are powerful but have patterns that fail silently at runtime:
| Library |
Common issues caught |
Guide |
| GetX |
Undisposed controllers, memory leaks from workers, missing super calls |
Using with GetX |
| Riverpod |
Circular provider deps, ref.read() in build, missing ProviderScope |
Using with Riverpod |
| Provider |
Provider.of in build causing rebuilds, recreated providers losing state |
Using with Provider |
| Bloc |
Events in constructor, mutable state, unclosed Blocs, BlocListener in build |
Using with Bloc |
| Isar |
Enum fields causing data corruption on schema changes; caching Isar streams (runtime crash risk) |
Using with Isar |
| Hive |
Missing init, unclosed boxes, hardcoded encryption keys, type adapter issues |
Using with Hive |
| Firebase |
Unbounded queries, missing batch writes, invalid Analytics events, FCM token leaks |
Using with Firebase |
Standard linters don't understand these libraries. They see valid Dart code. Saropa Lints has 50+ rules specifically for library-specific anti-patterns that cause crashes, memory leaks, cost overruns, and data corruption in production. Recent update: require_camera_permission_check no longer triggers on non-camera controllers (e.g., IsarStreamController), eliminating a key false positive for Isar users. The new avoid_cached_isar_stream rule (with quick fix) prevents a common Isar runtime error.
Radical Transparency
We build in public. We don't just show you what works; we explicitly document what doesn't work yet.
- ROADMAP.md: Our active backlog. See exactly what rules are coming next and vote on priorities.
- Deferred rules (in ROADMAP.md#part-2-deferred-rules--technical-limitations): The "Hard Problems." Rules we can't implement yet due to technical limitations (cross-file analysis, heuristics). We invite the community to help crack these barriers.
Compliance: EAA & OWASP Security
The European Accessibility Act takes effect June 2025, requiring accessible apps in retail, banking, and travel. GitHub detected 39 million leaked secrets in repositories during 2024.
These aren't edge cases. They're compliance requirements and security basics that standard linters miss.
Why switch? Saropa Lints covers everything in standard tools plus strict behavioral analysis.
| Feature |
flutter_lints |
very_good_analysis |
Saropa Lints |
| Syntax Checks |
✅ |
✅ |
✅ |
| Strict/Opinionated Style |
❌ |
✅ |
✅ |
| Zero-Config Setup |
✅ |
✅ |
✅ (Tier Presets) |
| Controller Leak Detection |
❌ |
❌ |
✅ (Deep Analysis) |
| Runtime Crash Prevention |
❌ |
❌ |
✅ (Behavioral) |
| Security (OWASP Mapped) |
❌ |
❌ |
✅ (ISO/OWASP) |
| Library Specific (Riverpod/Bloc) |
❌ |
❌ |
✅ (50+ rules) |
| AI-Ready Diagnostics |
❌ |
❌ |
✅ |
| Dependency Scanning |
❌ |
❌ |
🚧 (Coming Soon) |
OWASP Compliance Mapping
Security rules are mapped to OWASP Mobile Top 10 (2024) and OWASP Top 10 (2021) standards. This enables:
- Compliance reporting for security audits
- Risk categorization aligned with industry standards
- Coverage analysis across OWASP categories
| OWASP Mobile |
Coverage |
OWASP Web |
Coverage |
| M1 Credential Usage |
5+ rules |
A01 Broken Access Control |
4+ rules |
| M2 Supply Chain |
2+ rules |
A02 Cryptographic Failures |
10+ rules |
| M3 Authentication |
5+ rules |
A03 Injection |
6+ rules |
| M4 Input Validation |
6+ rules |
A05 Misconfiguration |
4+ rules |
| M5 Communication |
2+ rules |
A07 Authentication |
8+ rules |
| M6 Privacy Controls |
5+ rules |
A09 Logging Failures |
2+ rules |
| M7 Binary Protections |
2+ rules |
|
|
| M8 Misconfiguration |
4+ rules |
|
|
| M9 Data Storage |
7+ rules |
|
|
| M10 Cryptography |
4+ rules |
|
|
Gaps: A06 (Outdated Components) requires dependency scanning tooling.
Rules expose their OWASP mapping programmatically:
// Query a rule's OWASP categories
final rule = AvoidHardcodedCredentialsRule();
print(rule.owasp); // Mobile: M1 | Web: A07
Unlike "black box" paid tools, Saropa Lints is 100% open source (MIT). You can inspect the logic behind every rule, verify the security checks yourself, and fork it if you disagree.
- No hidden logic: See exactly how we detect vulnerabilities.
- No vendor lock-in: It's standard Dart code.
- Community powered: Rules are often suggested, debated, and refined by the Flutter community, not just a single vendor.
Built for AI
AI coding assistants like Cursor, Windsurf, and Copilot move fast, but they often hallucinate code that compiles yet fails in production. They might forget to dispose a controller, use a deprecated API, or ignore security best practices.
Saropa Lints acts as the guardrails for your AI. By providing immediate, semantic feedback on behavior—not just syntax—it forces the AI to correct its own mistakes in real-time.
Optimized for AI Repair
The tool is also built to fix. Saropa Lints diagnostics are engineered to be "paste-ready," providing deep context and specific failure points. When you copy a problem report directly into your AI tool window, it acts as a perfect prompt—giving the AI exactly the info it needs to refactor the code and resolve the issue immediately, without you needing to explain the context.
Why three options? The extension (Option A) is the recommended interactive experience (Set Up Project and the sidebar). Tier presets (Option B) are great for quick, zero-config setup. The CLI init tool (Option C) gives you explicit true/false for every rule, ideal for CI/scripting, plus --list-packs / --enable-pack for rule packs.
The 5 Tiers
Pick the tier that matches your team's needs. Each tier builds on the previous one.
| Tier |
Purpose |
Target User |
Example Rules |
| Essential |
Prevents crashes, data loss, security breaches, and memory leaks. These are rules where a single violation can cause real harm - app crashes, user data exposed, resources never released. If your app violates these, something bad will happen. |
Every project, every team. Non-negotiable baseline. |
require_field_dispose (memory leak), avoid_hardcoded_credentials (security breach), check_mounted_after_async (crash), avoid_null_assertion (runtime exception), require_firebase_init_before_use (crash) |
| Recommended |
Catches common bugs, basic performance issues, and accessibility fundamentals. These are mistakes that cause real problems but may not immediately crash your app - poor UX, sluggish performance, inaccessible interfaces, silent failures. |
Most teams. The sensible default for production apps. |
require_semantics_label (accessibility), avoid_expensive_build (performance), require_json_decode_try_catch (error handling), avoid_shrinkwrap_in_scrollview (performance), require_image_error_builder (UX) |
| Professional |
Enforces architecture, testability, maintainability, and documentation standards. Code that works but is hard to test, hard to change, or hard to understand. Technical debt that slows teams down over time. |
Enterprise teams, long-lived codebases, teams with multiple developers. |
avoid_god_class (architecture), require_public_api_documentation (docs), prefer_result_pattern (error handling), require_test_cleanup (testing), avoid_hardcoded_strings_in_ui (i18n) |
| Comprehensive |
Stricter patterns, optimization hints, and thorough edge case coverage. Rules that catch subtle issues, enforce consistency, and push toward optimal patterns. Helpful but not critical. |
Quality-obsessed teams, libraries/packages, teams that want maximum coverage. |
prefer_element_rebuild (subtle perf), prefer_immutable_bloc_state (strict pattern), require_test_documentation (maintainability), prefer_fake_platform (test quality) |
| Pedantic |
Everything, including pedantic and highly opinionated rules. Rules that most teams would find excessive but are valuable for greenfield projects or teams that want zero compromise. |
New projects starting fresh, teams that want maximum strictness from day one. |
prefer_custom_single_child_layout (micro-optimization), prefer_feature_folder_structure (opinionated architecture), avoid_returning_widgets (pedantic) |
Stylistic Rules (Separate Track)
175+ stylistic rules for formatting, ordering, and naming conventions.
Enable stylistic rules individually in your config, or use the VS Code extension's Setup & triage view to enable/disable them with estimated score impact.
For CI/scripting, use --no-stylistic (default) or --stylistic-all to bulk-enable:
dart run saropa_lints:init --tier recommended --stylistic-all
Conflicting pairs (e.g., prefer_single_quotes vs prefer_double_quotes) must be enabled individually — you choose which style your team prefers.
Stylistic rules are orthogonal to correctness. Your code can be perfectly correct while violating every stylistic rule, or perfectly formatted while crashing on every screen. That's why they're separate.
Configuration template
See example/analysis_options_template.yaml for a complete reference with all 2118 rules organized by category, tier membership, and examples.
Using a tier
VS Code extension: Use Set Tier from the command palette or click the tier badge in the status bar.
Tier preset (zero-config):
# In analysis_options.yaml — just pick your tier:
include: package:saropa_lints/tiers/recommended.yaml
CLI init (full control, CI/scripting):
dart run saropa_lints:init --tier recommended
dart run saropa_lints:init --target /path/to/project
dart run saropa_lints:init --help
Available tiers: essential (1), recommended (2), professional (3), comprehensive (4), pedantic (5)
Customizing rules
After generating configuration, customize rules by editing analysis_options.yaml:
plugins:
  saropa_lints:
    diagnostics:
      # The init tool generates explicit true/false for every rule
      avoid_hardcoded_strings_in_ui: true # change to false to disable
      require_public_api_documentation: false # change to true to enable

      # Stylistic rules (enable the ones your team prefers)
      prefer_single_quotes: true
      prefer_trailing_comma_always: true
Rules use standard YAML map format (no - prefix needed).
To change tiers, either switch the include: preset or re-run the init tool:
dart run saropa_lints:init --tier professional
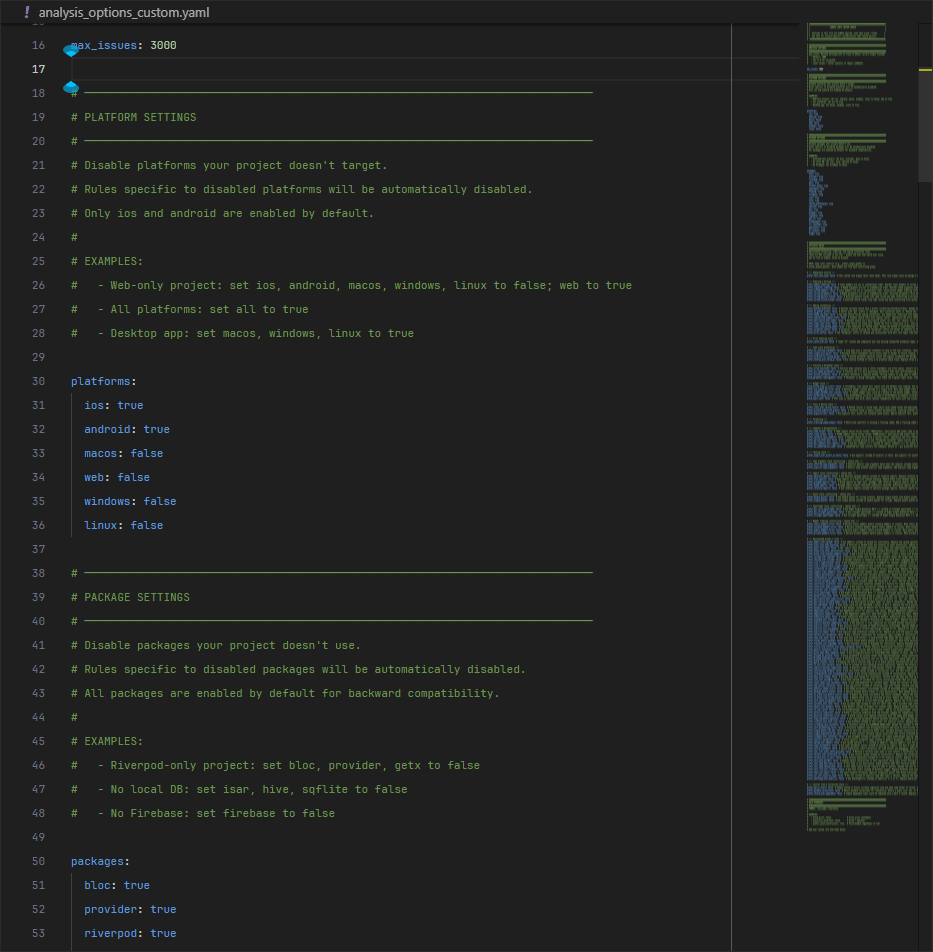
The analysis_options_custom.yaml file includes a platforms section that controls which platform-specific rules are active. Only iOS and Android are enabled by default. Enable the platforms your project targets:
# In analysis_options_custom.yaml
platforms:
  ios: true # enabled by default
  android: true # enabled by default
  macos: false # enable if targeting macOS
  web: false # enable if targeting web
  windows: false # enable if targeting Windows
  linux: false # enable if targeting Linux
Each platform has dedicated rules that catch platform-specific issues:
| Platform |
Rules |
Examples |
| iOS |
90+ |
Safe area, privacy manifest, App Tracking Transparency, Face ID, HealthKit, keychain |
| Android |
11+ |
Runtime permissions, notification channels, PendingIntent flags, cleartext traffic |
| macOS |
15+ |
Sandboxing, notarization, hardened runtime, window restoration, entitlements |
| Web |
10+ |
CORS handling, platform channels, deferred loading, URL strategy, web renderer |
| Windows |
Desktop shared |
Menu bar, window close confirmation, native file dialogs, focus indicators |
| Linux |
Desktop shared |
Same desktop rules as Windows |
Some rules are shared across platform groups:
- Apple rules (iOS + macOS): Apple Sign In, nonce validation
- Desktop rules (macOS + Windows + Linux): Menu bar, window management, keyboard/mouse interaction patterns
When a platform is set to false, its rules move to the disabled section. Shared rules (e.g., Apple Sign In for iOS + macOS) are only disabled when all their platforms are disabled.
User overrides always win — if you force-enable a rule in the overrides section, it stays enabled even if its platform is disabled.
The init tool logs which platforms are disabled and how many rules are affected:
Platforms disabled: web, windows, linux (23 rules affected)
Package configuration
The analysis_options_custom.yaml file includes a packages section that controls which library-specific rules are active. All packages are enabled by default. Disable packages you don't use to reduce noise:
# In analysis_options_custom.yaml
packages:
  # State Management
  bloc: true
  provider: true
  riverpod: true
  getx: true

  # UI & Utilities
  flutter_hooks: true

  # Data Classes
  equatable: true
  freezed: true

  # Storage & Database
  firebase: true
  isar: true
  hive: true
  shared_preferences: true
  sqflite: true

  # Networking
  dio: true
  graphql: true
  supabase: true

  # DI & Services
  get_it: true
  workmanager: true

  # Device & UI
  url_launcher: true
  geolocator: true
  qr_scanner: true

  # Gaming
  flame: true
Setting a package to false moves all its rules to the disabled section. If you don't use Riverpod, for example, set riverpod: false to remove 24+ Riverpod-specific rules from your analysis.
Rules shared between packages (e.g., database rules shared by Firebase, Isar, Hive, and sqflite) are only disabled when all packages that use them are disabled.
After changing platform or package settings, re-run init to apply:
dart run saropa_lints:init
Config key names and aliases
Rule config keys match the rule name shown in lint messages (the part in [brackets]):
lib/my_file.dart:42 - [prefer_arguments_ordering] Named arguments should be in alphabetical order.
                       ^^^^^^^^^^^^^^^^^^^^^^^^^ This is the config key
To disable this rule: prefer_arguments_ordering: false
Aliases: Some rules support shorter aliases for convenience. For example, prefer_arguments_ordering also accepts arguments_ordering:
plugins:
  saropa_lints:
    diagnostics:
      # Both of these work:
      prefer_arguments_ordering: false # canonical name
      arguments_ordering: false # alias
Aliases are provided for rules where the prefix (enforce_, require_) might be commonly omitted.
Enabling all rules
Use the pedantic tier preset or the init tool to enable all rules:
# Option A: Tier preset
include: package:saropa_lints/tiers/pedantic.yaml

# Option B: Init tool
# dart run saropa_lints:init --tier pedantic --stylistic-all
This is intentional. It forces teams to explicitly review and disable rules they disagree with, ensuring:
- No rule is accidentally overlooked
- Your config becomes a complete record of team style decisions
- Mutually exclusive rules (e.g.,
prefer_single_quotes vs prefer_double_quotes) require explicit choice
If you enable all rules, you will need to disable one rule from each conflicting pair.
Severity levels
Each rule has a fixed severity (ERROR, WARNING, or INFO) defined in the rule itself. Severity cannot be overridden per-project. If a rule's severity doesn't match your needs:
- Use
// ignore: rule_name to suppress individual occurrences
- Disable the rule entirely with
rule_name: false
- Open an issue if you think the default severity should change
Baseline for Brownfield Projects
The Problem
You want to adopt saropa_lints on an existing project. You run dart analyze and see:
lib/old_widget.dart:42 - avoid_print
lib/old_widget.dart:87 - no_empty_block
lib/legacy/api.dart:15 - avoid_dynamic
... 500 more violations
That's overwhelming. You can't fix 500 issues before your next sprint. But you also can't ignore linting entirely - new code should be clean.
The Solution: Baseline
The baseline feature records all existing violations and hides them, while still catching violations in new code.
- Old code: Violations hidden (baselined)
- New code: Violations reported normally
This lets you adopt linting today without fixing legacy code first.
Quick Start (One Command)
dart run saropa_lints:baseline
This command:
- Runs analysis to find all current violations
- Creates
saropa_baseline.json with those violations
- Updates your
analysis_options.yaml automatically
Result: Old violations are hidden, new code is still checked.
Combinable baseline types
| Type |
Config |
Description |
Best For |
| File-based |
baseline.file |
JSON listing specific violations |
"Fix nothing yet" |
| Date-based |
baseline.date |
Git blame - ignore old code |
"Fix gradually by age" |
Both types are combinable: any match suppresses the violation.
Full Configuration
Note: Baseline configuration via YAML is not yet supported. Use the
dart run saropa_lints:baseline CLI command shown above, which generates
the baseline file and updates your config automatically.
The baseline CLI supports these options:
| Option |
Description |
--file |
Output file (default: saropa_baseline.json) |
--date |
Ignore code unchanged since this date (uses git blame) |
--paths |
Ignore entire directories (glob patterns) |
--only-impacts |
Only baseline certain severities (e.g., low,medium) |
Path Pattern Examples
| Pattern |
Matches |
lib/legacy/ |
All files under lib/legacy/ |
*.g.dart |
All files ending in .g.dart |
lib/**/old_*.dart |
Files like lib/foo/old_widget.dart |
Priority Filtering
Use only_impacts to baseline only certain severity levels while still seeing errors:
baseline:
  file: "saropa_baseline.json"
  only_impacts: [info] # Still see errors and warnings
Severity model: errors must be fixed; warnings could fail or look bad; info is FYI. The 5-bucket impact taxonomy (critical / high / medium / low / opinionated) collapsed into the analyzer's three native severities on 2026-05-03 — see plans/COLLAPSE_LINT_IMPACT_TO_SEVERITY.md. Existing only_impacts: [low, medium, opinionated] configs keep working (the values map to the new buckets) but new code should use [info] / [warning] / [error].
Cleaning Up Over Time
As you fix violations, update the baseline to remove fixed items:
dart run saropa_lints:baseline --update
Output shows what was fixed:
Baseline Update Summary:
  Previous: 150 violations
  Current:  120 violations
  Fixed:    30 violations removed!
CLI Reference
dart run saropa_lints:baseline              # Generate new baseline
dart run saropa_lints:baseline --update     # Refresh, remove fixed violations
dart run saropa_lints:baseline --dry-run    # Preview without changes
dart run saropa_lints:baseline --skip-config # Don't update analysis_options.yaml
dart run saropa_lints:baseline -o custom.json # Custom output path
dart run saropa_lints:baseline ./my_project  # Run on specific directory
dart run saropa_lints:baseline --help        # See all options
Cross-file analysis CLI
Find unused files, circular imports, and related project-wide checks (CLI only; the extension also exposes cross-file commands).
Monorepos: --path is a single package root (one pubspec.yaml). If the repository has several Dart packages, run cross-file per package (from each package directory or with --path pointed at that package), or run separate CI jobs per package. One invocation does not span unrelated sibling packages.
dart run saropa_lints:cross_file unused-files   # Files not imported by any other file
dart run saropa_lints:cross_file circular-deps  # Circular import chains
dart run saropa_lints:cross_file import-stats   # Import graph statistics
dart run saropa_lints:cross_file feature-deps   # Cross-feature imports (lib/features/…)
dart run saropa_lints:cross_file unused-symbols # Top-level symbols unused outside defining file
dart run saropa_lints:cross_file dead-imports     # Likely dead relative imports (heuristic)
dart run saropa_lints:cross_file watch          # Re-run a command on lib/test changes
dart run saropa_lints:cross_file report         # HTML report (default: reports/)
dart run saropa_lints:cross_file graph          # DOT import graph for Graphviz
dart run saropa_lints:cross_file --help
# JSON output to file (e.g. for CI or tooling)
dart run saropa_lints:cross_file unused-files --output json > unused.json
# Baseline: suppress known issues, fail only on new violations
dart run saropa_lints:cross_file unused-files --baseline cross_file_baseline.json
dart run saropa_lints:cross_file unused-files --update-baseline
# Render DOT graph as SVG
dot -Tsvg reports/import_graph.dot -o reports/import_graph.svg
Options: --path <dir>, --output text|json, --output-dir <path> (for report/graph), --baseline <file>, --update-baseline, --exclude <glob>, plus command-specific flags (e.g. unused-symbols: --include-private, --exclude-public-api, --heuristic-unused-symbols). Exit codes: 0 = no issues, 1 = issues found, 2 = error. Example GitHub Actions workflow for CI. See ROADMAP cross-file table.
Project Vibrancy CLI
Score health of your own project functions (age, coverage, usage, complexity, docs) and emit CI-friendly JSON:
dart run bin/project_vibrancy.dart --path . --format json
dart run bin/project_vibrancy.dart --path . --format text
dart run bin/project_vibrancy.dart --path . --format json --since main
dart run bin/project_vibrancy.dart --path . --file lib/src/foo.dart
dart run bin/project_vibrancy.dart --path . --folder lib/src/rules
Gate options for CI:
dart run bin/project_vibrancy.dart \
  --path . \
  --format json \
  --min-grade C \
  --max-unused 20 \
  --max-uncovered 30 \
  --max-stub-tested 5 \
  --max-suspicious-coverage 10 \
  --max-test-drift 8
Exit code is non-zero when any configured gate is violated. A sample workflow is available at .github/workflows/project-vibrancy.yml.
JSON summary includes stubTestedCount, suspiciousCoverageCount, and testDriftCount (see plans/history/2026.04/2026.04.28/project_vibrancy_report.md for flag semantics; LCOV lacks per-test attribution, so flags use importer + trivial-assertion heuristics).
Quality gate CLI (new-code focused)
Use the structured violations.json summary to enforce pass/fail conditions in CI:
# 1) Run analysis so violations.json is produced
dart analyze

# 2) Copy and adjust the sample gate config
cp saropa_quality_gate.yaml.example saropa_quality_gate.yaml

# 3) Evaluate gate conditions
dart run saropa_lints:quality_gate \
  --report reports/.saropa_lints/violations.json \
  --config saropa_quality_gate.yaml
Supported operators: eq, ne, gt, ge, lt, le.
Common metrics:
new_errors (alias: new_critical_issues)new_warnings (alias: new_high_issues, new_medium_issues)new_info (alias: new_low_issues)new_vulnerabilitiesnew_security_hotspotsnew_code_smellsnew_bugsoverall_errors (alias: overall_critical_issues)overall_warnings (alias: overall_high_issues, overall_medium_issues)overall_info (alias: overall_low_issues)overall_vulnerabilities
The aliases map onto the new severity-keyed names so existing saropa_quality_gate.yaml configs keep working without edits. New thresholds should prefer the canonical names.
violations.json suppression schema (for CI/report tooling):
{
  "summary": {
    "totalViolations": 120,
    "suppressions": {
      "total": 14,
      "byKind": { "ignore": 8, "ignoreForFile": 4, "baseline": 2 },
      "byRule": { "avoid_print": 5, "require_https": 3 },
      "byFile": { "lib/app.dart": 7, "lib/api.dart": 4 }
    }
  }
}
summary.suppressions.total: total suppressed diagnostics.summary.suppressions.byKind: suppression mechanism breakdown.summary.suppressions.byRule: suppressed count by rule name.summary.suppressions.byFile: suppressed count by relative file path.
Exit codes:
0: pass (or warn-only breaches)1: fail breach(es)2: invalid input/config
GitHub Actions example:
- name: Analyze
  run: dart analyze

- name: Quality gate
  run: |
    cp saropa_quality_gate.yaml.example saropa_quality_gate.yaml
    dart run saropa_lints:quality_gate \
      --report reports/.saropa_lints/violations.json \
      --config saropa_quality_gate.yaml
Standalone Scanner
Run saropa_lints rules against any Dart project — even one that doesn't have saropa_lints as a dependency. Useful for evaluating a project before adopting the package, or for scanning the saropa_lints codebase itself.
The scanner reads the project's analysis_options.yaml (generated by init) to determine which rules to run, unless you pass --tier. Two steps:
# 1. Configure rules (once)
dart run saropa_lints init --target /path/to/project --tier recommended

# 2. Scan
dart run saropa_lints scan /path/to/project
CLI options: --tier <name> (essential | recommended | professional | comprehensive | pedantic) overrides the project config for that run. --files <path>... scans only the listed Dart files; --files-from-stdin reads one path per line from stdin. --format json writes machine-readable JSON to stdout (no report file). --resolve fully resolves each file (type/element resolution) instead of the default fast syntactic parse — required for rules that fire on constructor calls like File('x') and for type-based rules, which the syntactic pass cannot see; it is slower and the target project must have had pub get run. Results are otherwise written to reports/<date>/<timestamp>_scan_report.log with a compact summary printed to terminal.
Programmatic scan: Import package:saropa_lints/scan.dart to run scans from code (e.g. from another package or script) without invoking the CLI. The public API includes ScanRunner, ScanConfig, ScanDiagnostic, loadScanConfig, scanDiagnosticsToJson, and scanDiagnosticsToJsonString. Example:
import 'package:saropa_lints/scan.dart';

final runner = ScanRunner(
  targetPath: '/path/to/project',
  tier: 'recommended',           // optional: override config with a tier
  dartFiles: ['lib/main.dart'],   // optional: scan only these files
  messageSink: (msg) => log(msg), // optional: redirect or suppress output
);
final diagnostics = runner.run();
if (diagnostics != null) {
  final json = scanDiagnosticsToJsonString(diagnostics);
  // ...
}
runner.run() is the fast syntactic pass. For rules on constructor calls or that need resolved types, use the async await runner.runResolved() instead (slower; the target must have had pub get run).
JSON output (from --format json or scanDiagnosticsToJson) includes version, diagnostics (each with filePath, line, column, ruleName, severity, problemMessage, correctionMessage?), and summary (totalCount, byFile, byRule).
Rule Categories
| Category |
Description |
| Flutter Widgets |
Lifecycle, setState, keys, performance |
| Modern Dart 3.0+ |
Class modifiers, patterns, records, when guards |
| Modern Flutter |
TapRegion, OverlayPortal, SearchAnchor, CarouselView |
| State Management |
Provider, Riverpod, Bloc patterns |
| Performance |
Build optimization, memory, caching |
| Security |
Credentials, encryption, input validation — OWASP mapped |
| Accessibility |
Screen readers, touch targets, semantics |
| Testing |
Assertions, mocking, flaky test prevention |
| Architecture |
Clean architecture, DI, SOLID principles |
| Error Handling |
Exceptions, logging, recovery |
| Async |
Futures, Streams, cancellation |
| API & Network |
Timeouts, retries, caching |
| Internationalization |
Localization, RTL, plurals |
| Documentation |
Public API, examples, deprecation |
Stylistic Rules
175+ rules for team preferences — not included in any correctness tier. Enable individually in your config, via the VS Code extension's Setup & triage view, or use --stylistic-all to bulk-enable.
Examples: prefer_relative_imports, prefer_single_quotes, prefer_arrow_functions, prefer_trailing_comma_always, prefer_for_in, prefer_boolean_prefixes_for_params
See README_STYLISTIC.md for the full list with examples, pros/cons, and quick fixes.
Saropa Lints runs as a native Dart analyzer plugin — no separate process needed. The tier system helps manage analysis scope:
- Rules set to
false are not loaded
- Start with
essential or recommended
- Upgrade tiers as you fix warnings
# GOOD: Start with recommended tier
dart run saropa_lints:init --tier recommended

# CAUTION: Enabling everything on a legacy codebase may show thousands of warnings
dart run saropa_lints:init --tier pedantic
For faster iteration during development:
- Use
essential tier locally — catches critical bugs with fewer rules
- Use
professional or higher in CI — thorough checking where speed matters less
- Upgrade tiers gradually — fix warnings before enabling more rules
The tier you choose has a direct impact on analysis speed (approximate rule counts from getRulesForTier; stylistic rules are separate unless you pass --stylistic-all):
essential: ~350 rules → fastest (memory leaks, security, crashes)recommended: ~1000 rules → moderate (+ accessibility, performance)professional: ~1900 rules → slower (+ architecture, documentation)comprehensive: ~1870 rules → stricter patterns and edge casespedantic: ~1880 rules → slowest correctness tier (everything before stylistic)
Adoption Strategy
Static analysis doesn't create problems — it reveals ones that already exist. The tiered system lets you start at any level and progress at your own pace. Findings are for your workflow. You control what you address and when.
New Projects
Start with professional or comprehensive. Fix issues as you write code.
Existing Projects
- Enable
essential. Fix critical issues first.
- Move to
recommended. Fix warnings as you touch files.
- Enable higher tiers when the noise is manageable.
Suppressing Warnings
When a rule doesn't apply to specific code:
// ignore: avoid_hardcoded_strings_in_ui
const debugText = 'DEBUG MODE';

// For entire files:
// ignore_for_file: avoid_print_in_production
Always add a comment explaining why you're suppressing.
Automatic File Skipping
Rules automatically skip files that can't be manually fixed:
| File Pattern |
Skipped By Default |
*.g.dart, *.freezed.dart, *.gen.dart |
Yes (generated code) |
*_fixture.dart, fixture/**, fixtures/** |
Yes (test fixtures) |
*_test.dart, test/** |
Yes (override with testRelevance) |
example/** |
No (override with skipExampleFiles) |
Test files are skipped by default because most production-focused rules generate noise in test code. Override testRelevance to change behavior per rule:
TestRelevance.never — skip test files (default)TestRelevance.always — run on all files including testsTestRelevance.testOnly — run only on test files
Limitations
- Scope: Saropa Lints runs as a native analyzer plugin on the package where it's configured. For multi-package workspaces, add
saropa_lints to each package's analysis_options.yaml.
- File types: Only Dart source files (
.dart) are analyzed. Non-Dart assets (JSON, XML, YAML, scripts, etc.) are out of scope.
Running the Linter
Command line:
dart analyze
Saropa Lints runs as a native Dart analyzer plugin. Issues appear automatically in your IDE's Problems panel and in dart analyze output.
When analysis runs with reporting enabled, the plugin also writes a combined log under reports/<date>/ (filename contains _saropa_lint_report). That file includes FILE IMPORTANCE (fan-in × layer), FIX PRIORITY (violations sorted by impact × importance), and PROJECT STRUCTURE (import tree), built from import data collected during analysis.
Severity Report
Run lints with results grouped by severity (errors first):
dart run saropa_lints:severity_report
The command was renamed from impact_report to severity_report when the
five-bucket impact model collapsed into the analyzer's three severities.
dart run saropa_lints:impact_report still works as a backward-compatible alias.
Output shows errors first, with actionable guidance:
--- ERROR (2) ---
  lib/main.dart:45 - avoid_hardcoded_credentials
  lib/auth.dart:23 - require_dispose

--- WARNING (5) ---
  lib/widget.dart:89 - avoid_icon_buttons_without_tooltip
  ...

Severity Summary
================
ERRORS:   2 (must fix)
WARNINGS: 5 (could fail or look bad)
INFO:     12 (FYI)

Total: 19 issues
Severity levels:
error: MUST be fixed — broken, will crash, exploitable, or fails in production (memory leaks, hardcoded credentials, always-failing casts)warning: Could fail or is embarrassing — may break under the wrong conditions or fail audits (accessibility, performance anti-patterns, missing error handling)info: FYI — style, consistency, opinionated guidance (naming conventions, hardcoded strings, missing docs)
Exit code equals the number of errors (capped at 125), making it CI-friendly.
IDE Integration
Saropa Lints uses the native Dart analyzer plugin system. Issues appear directly in your IDE's Problems panel — no extra setup required.
If you don't see warnings:
- Run
dart pub get (or flutter pub get)
- Restart your IDE (VS Code:
Ctrl+Shift+P → "Developer: Reload Window")
- Check View → Output → Dart Analysis Server for errors
Supported Versions
The current major (12.x) is the actively maintained line — new rules, fixes, and quick fixes land here. Earlier majors are no longer updated except for security-impacting issues; if you need a backport of a security fix to a prior major, open an issue tagged backport-request with the rule code and the affected version. There is no fixed support window — older lines are evaluated case-by-case based on the severity of the report and the size of the diff. See also Troubleshooting and doc/troubleshooting.md for IDE-specific issues.
Troubleshooting
Can't use saropa_lints v7 in my Flutter project
⚠️ v7 was retracted. It required analyzer 10 (and meta ^1.18.0); the Flutter SDK pins meta to 1.17.0, so 7.x could not run in Flutter projects. Use saropa_lints 8.0.0, which keeps all 7.x rule fixes and stays on analyzer 9 for Flutter compatibility. See CHANGELOG and Upgrading to v7 (reference only) for context.
I'm new and completely lost
Start here:
Install: Add to your pubspec.yaml dev_dependencies:
dev_dependencies:
  saropa_lints: ^10.0.0
Configure: Add to your analysis_options.yaml:
include: package:saropa_lints/tiers/recommended.yaml
Get dependencies:
dart pub get
Reload VS Code:
- Press
Ctrl+Shift+P
- Type "reload"
- Click "Developer: Reload Window"
Check: Look at the PROBLEMS panel (View → Problems), or run dart analyze
Still not working? See the sections below.
IDE doesn't show lint warnings
Quick Fix (works 90% of the time):
- Press
Ctrl+Shift+P (or Cmd+Shift+P on Mac)
- Type "reload"
- Click "Developer: Reload Window"
- Wait for analysis to complete
If that doesn't work:
- Clear the cache: Delete the
.dart_tool folder and run dart pub get
- Reload VS Code again (steps above)
- Check View → Output → Dart Analysis Server for errors
- Verify configuration is correct (see "Configuration not working" below)
Alternative (command line):
Run dart analyze in your terminal to see all issues immediately.
Configuration not working (not enough rules loading)
Problem: You only get a few rules instead of the full set for your chosen tier.
Solution: Use the CLI tool to generate explicit configuration:
# Generate config for comprehensive tier
dart run saropa_lints:init --tier comprehensive

# Or for all rules (pedantic tier)
dart run saropa_lints:init --tier pedantic
This generates analysis_options.yaml with explicit rule_name: true for every enabled rule.
Verify it worked: Run dart analyze and check the output.
Too many warnings! What do I do?
This is normal when first installing. You'll see hundreds or thousands of warnings.
Option 1: Start smaller (recommended for existing projects)
# Start with essential tier (~310 critical rules)
dart run saropa_lints:init --tier essential
Option 2: Use baseline (for brownfield projects)
Generate a baseline to suppress existing issues and only catch new violations:
dart run saropa_lints:baseline
Option 3: Disable noisy rules
Edit your analysis_options.yaml and set specific rules to false:
plugins:
  saropa_lints:
    diagnostics:
      prefer_double_quotes: false # disabled
      prefer_trailing_comma_always: false
      no_magic_number: false
Option 4: Use quick fixes
Many rules have automatic fixes:
- Hover over the warning
- Click "Quick Fix" or press
Ctrl+.
- Select "Fix all in file" to fix all instances at once
- Or run
dart fix --apply from the command line
Don't stress about fixing everything immediately. Pick one category (like accessibility or memory leaks) and fix those first.
Out of Memory errors
If you see errors like:
../../runtime/vm/zone.cc: 96: error: Out of memory.
Solution 1: Clear the pub cache (most effective)
dart pub cache clean
dart pub get
Solution 2: Increase Dart heap size (PowerShell)
$env:DART_VM_OPTIONS="--old_gen_heap_size=4096"
dart analyze
Solution 3: Delete local build artifacts
# Windows
rmdir /s /q .dart_tool && dart pub get

# macOS/Linux
rm -rf .dart_tool && dart pub get
Native crashes (Windows)
If you see native crashes with error codes like ExceptionCode=-1073741819:
# Windows
rmdir /s /q .dart_tool && flutter pub get

# macOS/Linux
rm -rf .dart_tool && flutter pub get
Then run dart analyze again.
Frequently Asked Questions
Q: Does this replace flutter_lints?
A: You can run them side-by-side, but Saropa Lints covers everything in flutter_lints plus 2000+ additional behavioral and security checks. Most teams replace flutter_lints entirely. With v5, you no longer need custom_lint either — just saropa_lints in your dev_dependencies.
Q: Will this slow down my CI/CD pipeline?
A: Saropa Lints runs as a native analyzer plugin, integrated directly into dart analyze. The Tier System allows you to balance speed and strictness. The essential tier is designed to be fast for CI environments.
Q: Can I use this with existing legacy projects?
A: Yes! Use the Baseline feature (dart run saropa_lints:baseline) to suppress existing issues instantly. This lets you enforce quality on new code without having to fix 500+ legacy errors first.
Q: I'm upgrading from v4 — what changed?
A: v5 uses the native Dart analyzer plugin system instead of custom_lint. Remove custom_lint from your dependencies, replace custom_lint: rules: with plugins: saropa_lints: diagnostics: in your config (or just use a tier preset), and run dart analyze instead of dart run custom_lint. The init tool handles the config migration automatically.
Q: Can I add my own lint rules for my app (e.g. require CommonText instead of Text)?
A: Rule packs only enable rules already shipped in saropa_lints; there is no YAML-only “load arbitrary external rules” switch. The analyzer allows one plugin per context (dart-lang/sdk#50981), so use a composite plugin: one package that depends on saropa_lints and your rules, exposes the single plugin entrypoint, calls loadNativePluginConfig / registerSaropaLintRules from package:saropa_lints/saropa_lints.dart, then registers your rules. See Composite analyzer plugin. Alternatives: private fork of saropa_lints, non-analyzer enforcement (codemod, CI), or professional / upstream.
Contributing
We are building the industry standard together.
We don't have all the answers. We believe great tools are forged by many hands, and if you've shipped production Flutter apps, we want your opinions.
If you think a rule is:
- Wrong - tell us why, we'll fix it or remove it
- Too strict - maybe it belongs in a higher tier
- Too lenient - maybe it should be stricter or have options
- Missing - propose it, or better yet, implement it
Want to learn AST analysis? We mentor contributors. Pick a "Good First Issue" and we'll guide you through writing your first linter.
How to contribute
See CONTRIBUTING.md for detailed guidelines.
Adding a new rule:
- Create rule in appropriate
lib/src/rules/*.dart file
- Register in
lib/src/rules/all_rules.dart
- Add to the appropriate tier in
lib/src/tiers.dart
- Add tests in
test/
- Update CHANGELOG.md
Reporting issues:
- Include a minimal code sample that triggers (or should trigger) the rule
- Explain what you expected vs what happened
- If you disagree with a rule's premise, say so directly
Discussing rules
Not sure if something is a bug or a design decision? Open a discussion issue. We're happy to explain our reasoning and change our minds when presented with good arguments.
Professional Services
Optional paid services for teams that want hands-on help. See PROFESSIONAL_SERVICES.md for details.
| Service |
Description |
| New Projects |
Development scoped to your stage — MVP, Production, or Enterprise |
| Upgrade |
Move existing projects to higher tiers as they grow |
| Audit |
Assess codebases you inherited; remediation quoted separately |
| Custom Rules |
Rules specific to your architecture and compliance requirements |
Contact: saropa.com | services@saropa.com
Documentation
Package Integration Guides
We provide specialized lint rules for popular Flutter packages. These catch library-specific anti-patterns that standard linters miss.
For Package Authors
Want lint rules for your package? We'd love to collaborate with package maintainers to add rules that catch common gotchas and enforce best practices for your library.
Benefits:
- Help users avoid common mistakes with your package
- Reduce support burden from preventable issues
- Improve developer experience with your library
Contact us via CONTRIBUTING.md or open an issue to discuss adding rules for your package.
Badge
Show off your code quality
Prove that your code is secure, memory-safe, and accessible. Add the Saropa Lints style badge to your README to indicate you follow strict behavioral standards.

[](https://pub.dev/packages/saropa_lints)
License
MIT - see LICENSE. Use it however you like.
Built with care by the Flutter community. Questions? Ideas? We'd love to hear from you.
pub.dev | GitHub | Issues | Saropa
About This Project
"The bitterness of poor quality remains long after the sweetness of meeting the schedule has been forgotten." — Karl Wiegers
"Quality is not an act, it is a habit." — Aristotle
saropa_lints is a comprehensive static analysis package for Flutter and Dart applications. With 2134 lint rules organized into 5 progressive tiers (and more planned), it catches memory leaks, security vulnerabilities, accessibility violations, and runtime crashes that standard linters miss. Whether you're building a startup MVP or enterprise software, saropa_lints helps you ship more stable, secure, and accessible apps.
Keywords: Flutter linter, Dart static analysis, Flutter code quality, memory leak detection, security scanning, accessibility testing, WCAG compliance, European Accessibility Act, Flutter best practices, Dart analyzer plugin, code review automation, CI/CD linting, Flutter enterprise tools
Hashtags: #Flutter #Dart #StaticAnalysis #CodeQuality #FlutterDev #DartLang #Linting #DevTools #OpenSource #Accessibility #Security #BestPractices
Sources


