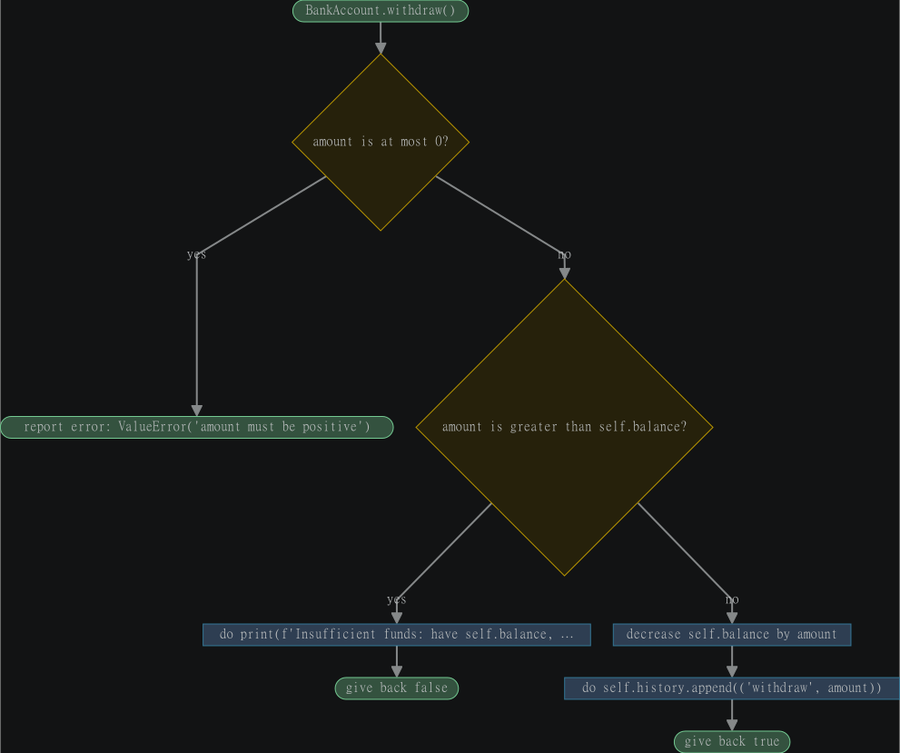
Code FlowchartSee your code as a flowchart, explained in plain English or Japanese. 11 languages including Python, JavaScript, TypeScript, Java, C, C++, C#, Go, Rust, PHP and Ruby. Installation Launch VS Code Quick Open ( Ctrl+P), paste the following command, and press enter.Copied to clipboard |

Code FlowchartSee what your code actually does. Open a file, click one button, and get a flowchart — with every step explained in plain English or Japanese. Built for people learning to program, and for anyone staring at a function wondering which branch runs when.
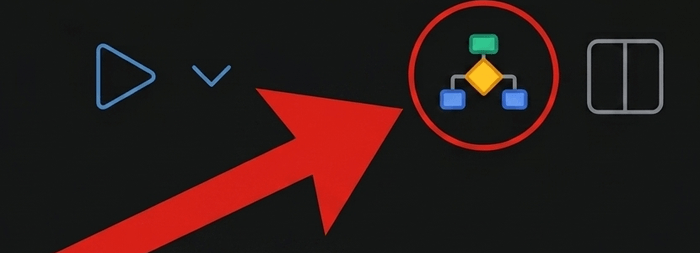
Getting startedOpen any supported file, then click the flowchart icon in the editor's title bar, top right:
The chart opens beside your code and follows along as you type. No icon? It only appears for the languages listed below — check the file's
language mode in the status bar. You can also run Show Flowchart from the
Command Palette ( What it doesOne click. A flowchart icon appears in the editor title bar for any supported file. Click it and the chart opens beside your code. Plain language, not syntax.
It tells you when code can't run. Statements after a Complexity, at a glance. Every chart shows its decision count and cyclomatic complexity — green under 6, amber to 10, red beyond. A quick answer to "is this function doing too much?" It handles real code. Nested loops, LanguagesPython · JavaScript · TypeScript · TSX · Java · C · C++ · C# · Go · Rust · PHP · Ruby Parsing is powered by tree-sitter, bundled with the extension. Nothing to install. Using it
The chart updates as you type. Move your cursor in the editor and the matching box highlights. Settings
Limits worth knowing
Building from sourceThen press F5 in VS Code to launch a window with the extension loaded. The grammar WASM files aren't committed — they're binaries reproducible from
npm, and FeedbackFound a chart that doesn't match your code? That's the bug worth reporting — open an issue with the snippet and what you expected. |