SQL Developer Graph Visualization Extension for VS Code
Overview
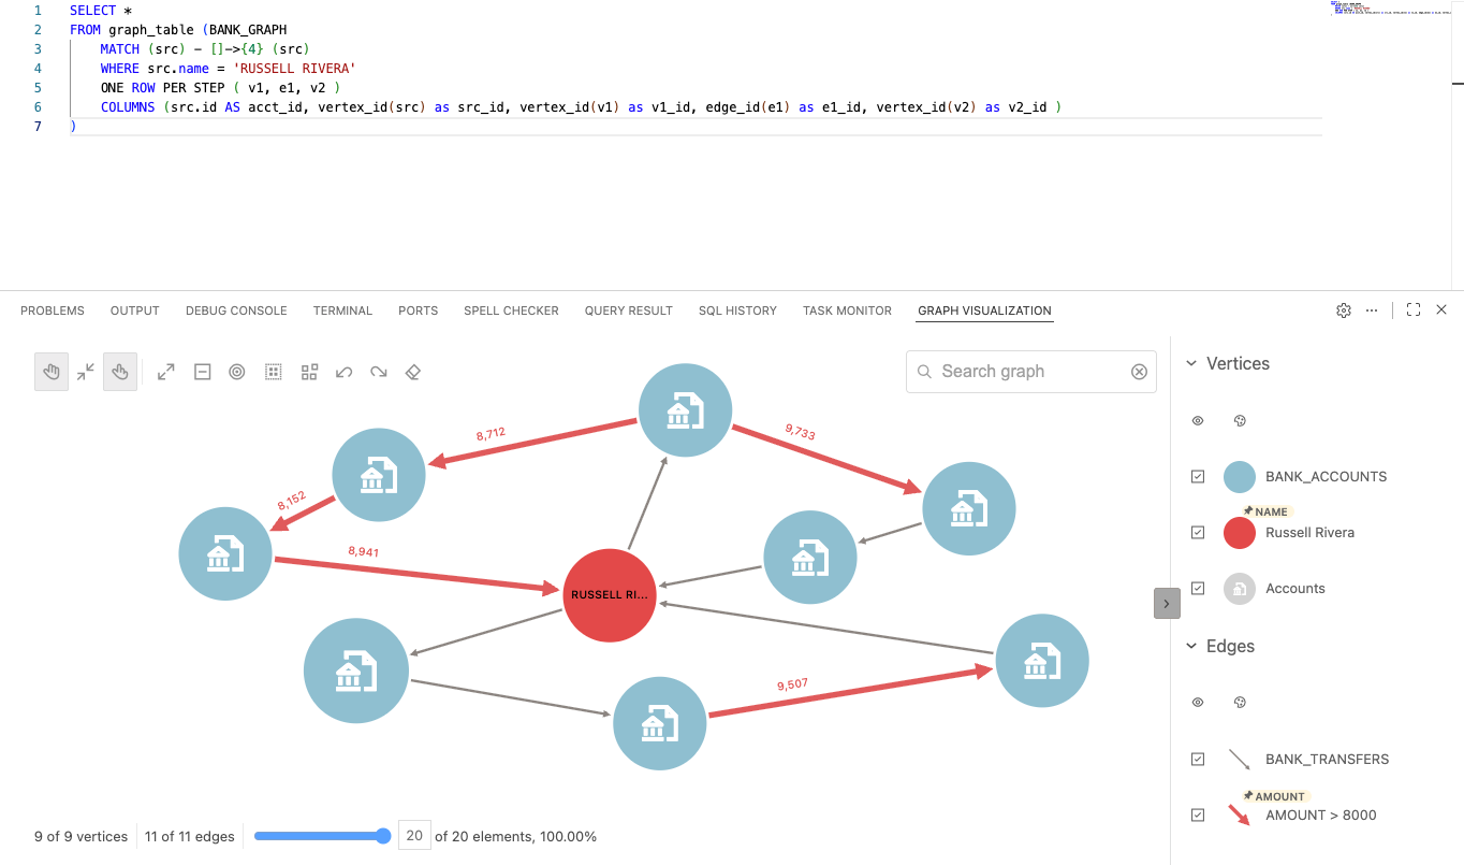
This extension enhances the Oracle SQL Developer extension with graph visualization capabilities for Oracle Database 23ai and above. Visualize and explore the result of GRAPH_TABLE queries as a graph.
Features
Seamless Integration: Works alongside the Oracle SQL Developer extension for VS Code
Interactive Graph Visualization: Visualize query results containing GRAPH_TABLE operator data
Rich Styling Options: Customize vertex and edge appearances with colors, icons, animations, and more
Graph Exploration: Navigate complex graph structures with intuitive controls
Prerequisites
Oracle SQL Developer Extension for VS Code, version 25.2.2 or higher (will be installed automatically if not present)
Oracle AI Database 26ai
Use with SQL property graphs. PGQL property graphs are not supported. To convert your PGQL property graphs to SQL property graphs in Oracle AI Database, please refer to the corresponding migration guides of Autonomous Database Serverless or user-managed databases.
Getting Started
Connect to your Oracle AI Database using the SQL Developer extension
Create a new SQL worksheet
Write a SQL query that includes the GRAPH_TABLE operator
Note: The query must project vertex/edge IDs for the extension to work correctly
Click the "Visualize SQL Graph" button in the editor toolbar or use the command palette (Ctrl/Cmd+Shift+P) and select "SQL Developer Graph Visualization (Worksheet): Visualize SQL Graph"
Basic Graph Query
SELECT *
FROM GRAPH_TABLE(
    my_graph
    MATCH (v)-[e]->(w)
    COLUMNS (
        vertex_id(v) AS vid,
        vertex_id(w) AS wid,
        edge_id(e)   AS eid
    )
)