DLT Analyzer Extension
Advanced DLT (Diagnostic Log and Trace) analyzer for VS Code, providing comprehensive log analysis capabilities with MCP (Model Context Protocol) integration.
Installation & Setup Guide
Follow these simple steps to get started with DLT Analyzer:
1. Install the Extension
- Open VS Code
- Navigate to the Extensions marketplace
- Search and install DLT Analyzer extension
2. Initialize MCP Components
- Press Ctrl+Shift+P (Windows/Linux) or Cmd+Shift+P (macOS) to open Command Palette
- Type and execute: Install MCP DLT Analyzer
- This will download and configure all necessary components
3. Wait for Setup Completion
- Allow the installation process to complete
- You'll see progress notifications during setup
- The process may take a few minutes depending on your system
Create the following directory structure and configuration file in your workspace:
Step 4.1: Create .vscode folder in your workspace root
Step 4.2: Create file ./.vscode/mcp.json with the following configuration:
{
	"servers": {
		"mcp-atlassian": {
			"command": "uvx",
			"args": [
				"--with",
				"pydantic<2.12.0",
				"mcp-atlassian"
			],
			"env": {
				"JIRA_URL": "http://jira.lge.com/issue",
				"JIRA_PERSONAL_TOKEN": "your_personal_token_here",
				"JIRA_USERNAME": "your_username_here",
				"CONFLUENCE_URL": "http://collab.lge.com/main",
				"CONFLUENCE_USERNAME": "your_username_here",
				"CONFLUENCE_PERSONAL_TOKEN": "your_personal_token_here"
			},
			"type": "stdio"
		},
		"dlt-analyzer": {
			"type": "stdio",
			"command": "C:\\Program Files\\LGEProject\\dlt_analyzer.exe",
			"env": {
				"lst_cids": "LSMF,UDS,PROG,IOLF",
				"lst_log_levels": "error,fatal,warning",
				"dataset": "LogAnalysis/dataset",
				"timezone": "7",
				"workspace_root": "."
			}
		}
	},
	"inputs": []
}
Features
- 🔍 Advanced DLT Log Analysis: Parse and analyze DLT files with intelligent filtering
- 🔗 MCP Integration: Seamless Model Context Protocol integration for enhanced AI assistance
- ⚡ Real-time Processing: Process logs efficiently with configurable parameters
- 🎯 Component Filtering: Filter by specific Component IDs (CIDs)
- 📊 Log Level Analysis: Focus on critical log levels (error, fatal, warning)
- 🌍 Timezone Support: Handle logs from different timezone contexts
Configuration Parameters
| Parameter |
Description |
Example Value |
lst_cids |
Component IDs to filter |
"LSMF,UDS,PROG,IOLF" |
lst_log_levels |
Log severity levels |
"error,fatal,warning" |
dataset |
Dataset directory path |
"LogAnalysis/dataset" |
timezone |
Timezone offset |
"7" |
workspace_root |
Workspace root directory |
"." |
System Requirements
- VS Code: Version 1.100.0 or higher
- Python: Version 3.7+ with pip
- Operating System: Windows, macOS, or Linux
- Memory: Minimum 4GB RAM recommended for large log files
Quick Start
- ✅ Install DLT Analyzer extension
- ✅ Run "Install MCP DLT Analyzer" command
- ✅ Create
.vscode/mcp.json configuration
- ✅ Place your DLT files in the
LogAnalysis/dataset directory
- 🚀 Start analyzing your logs!
How to use
We are provided 3 prompts for analysis ticket as below:
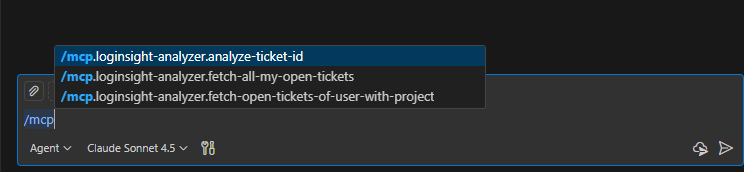
1. /mcp.dlt-analyzer.analyze-ticket-id:
- Input: Ticket-ID
- This prompt support user auto download all attachment from jira to /tickets/ticket-id, then analysis ticket and give summary for the user.
2. /mcp.dlt-analyzer.fetch-all-my-open-tickets:
- Input: None
- Support auto fetch all open ticket of current user and breakdown task to /task/...
3. /mcp.dlt-analyzer.fetch-open-tickets-of-user-with-project:
- Input: user and project
- Support read all ticket of user from that project and breakdown task to /task/...