Odoo Debugger
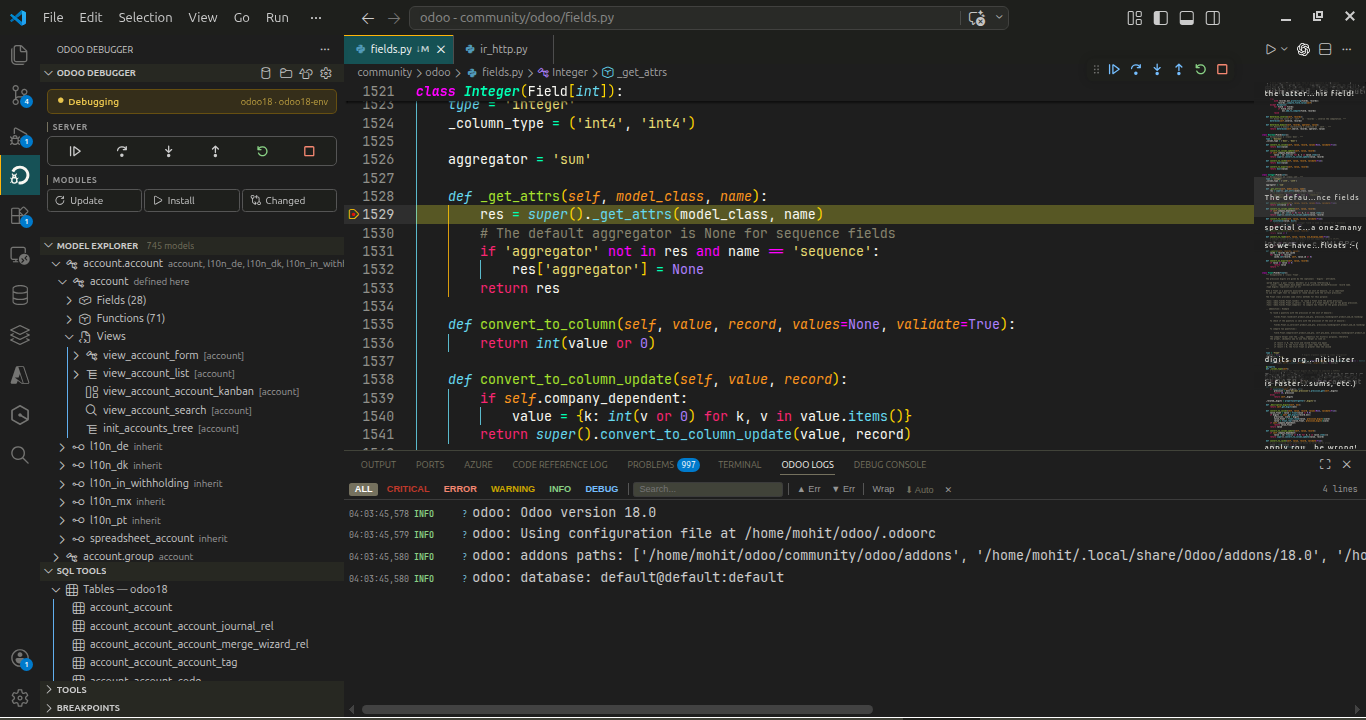
Your complete Odoo development environment inside VS Code. Run and debug the server, explore models with full inheritance chains, hover over any symbol for instant navigation, browse database records, watch live logs — all without leaving your editor.
Setup
1 — Install the extension
Install from the VS Code marketplace. ms-python.debugpy is automatically installed as a dependency.
2 — Select Python interpreter
Ctrl+Shift+P → Python: Select Interpreter → pick your Odoo virtualenv.
3 — Point to your Odoo conf file (recommended)
"odooDebugger.configFile": "/path/to/.odoorc"
The extension reads db_name, db_host, db_port, db_user, db_password, addons_path, and http_port directly from the conf file.
Click the folder icon in the panel title bar → Manage Addons Paths, or set directly:
"odooDebugger.addonsPaths": [
    "/path/to/odoo/community/addons",
    "/path/to/custom-addons"
]
5 — Run Odoo
Press Ctrl+Shift+R or click ▶ Run in the panel.
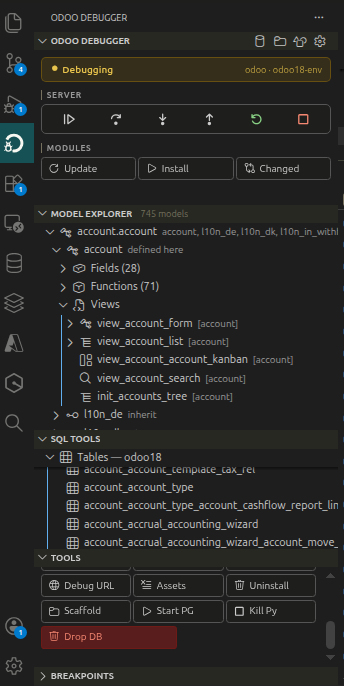
Panel Layout
| Section |
Purpose |
| Odoo Debugger |
Server controls, module actions, tools |
| Model Explorer |
Browse all models, fields, functions, views |
| SQL Tools |
Browse tables, run queries |
| Tools |
JS debug, utilities, scaffold |
| Breakpoints |
Manage all breakpoints |
| Odoo Logs |
Live log panel at the bottom |
Features
Server Management
- Run (
Ctrl+Shift+R) — Starts Odoo via debugpy in noDebug mode
- Debug (
Ctrl+Shift+D) — Full debugpy session with breakpoints active
- Stop (
Ctrl+Shift+S) — Stops the running server
- Restart — Stops and re-launches in the same mode
- Status bar — Shows server state + DB name + index count:
$(database) Odoo: mydb · 631M
- Click → focuses Odoo Debugger panel
- Hover → shows per-slice index counts (Models, Fields, Functions, Views, XML refs)
- Shows
$(sync~spin) while indexing
Module Management
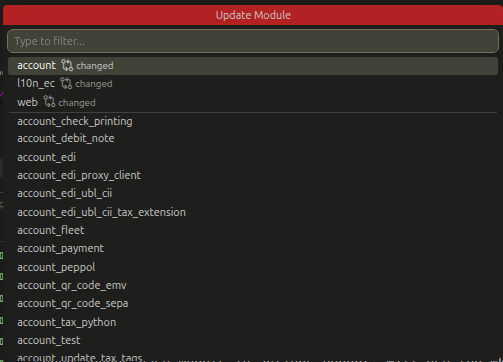
- Update (
Ctrl+Shift+U) — QuickPick with git-changed modules shown first
- Install (
Ctrl+Shift+I) — Same picker, runs --init
- Update Changed (
Ctrl+Shift+G) — Auto-detects modules with uncommitted git changes
- Uninstall — Opens Odoo shell with uninstall command
- Scaffold — Generates full module: manifest, model, views, security CSV, menu, action
Right-click — Update / Install This Module
Right-click any .py or .xml file in the editor or file explorer:
- Update This Module — auto-detects module from file path, runs update immediately (no picker)
- Install This Module — same, runs
--init
Build output appears in the Odoo Logs panel automatically.
Background Indexing
On startup, background workers index your addons in 5 independent slices:
| Slice |
Content |
models |
Model names, types, inheritance |
fields |
Field definitions with comodel, related, compute, selection options |
functions |
Method signatures, decorators, depends/onchange/constrains |
views |
XML view inheritance tree |
fieldXml |
Field usages in XML views |
Progress: Status bar shows $(sync~spin) while indexing. Click the spinner → notification panel opens showing live counts as each thread completes:
Odoo Debugger: Indexing 631 models · 4821 fields · 1203 functions · 892 views
Incremental updates: saving a .py or .xml file re-parses only that file and merges into the existing index — no full restart. Status bar count updates immediately.
Manual reindex: click the Refresh button in the Model Explorer toolbar.
Model Explorer
Tree view of all models with full deep inheritance support:
- Fields —
Fields (N) collapsible group
- Description:
Many2one → res.partner / Char · computed / Char · required
- Hover tooltip: comodel link, related chain, compute method, flags, selection options
- Functions —
Functions (N) collapsible group
- Description:
(params) -> returnType — full signature inline
- Hover tooltip: decorator + full
def signature + depends/onchange/constrains fields
- Views —
Views (N) lazy-loaded with full inheritance tree
- Theme-aware icon colors — icons follow your active theme's symbol colors (Monokai, Dracula, etc.)
- Models:
symbolIcon.classForeground · Fields: symbolIcon.fieldForeground · Methods: symbolIcon.methodForeground
Toolbar (always visible): Search $(search), Clear Filter, Refresh $(refresh), Configure Sources $(folder)
Overflow ... menu: Filter by Type, Sort Models, Group by Module, Toggle Auto-Reveal, Move to Panel
Auto-reveal: cursor movement in .py or .xml auto-highlights the matching model/field/method in the tree. Toggle with the $(pin) button in the overflow menu.
Right-click model: Go to XML View, Open in Browser, Browse Records, Copy Model Name
Right-click field: Find in XML Views, Browse Field Values
Right-click function: Find Function Usages
Quick Find
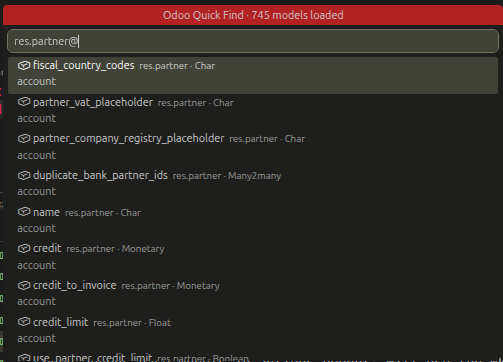
Ctrl+Alt+N — Live search with compound syntax:
| Input |
Result |
res.partner |
Models matching name |
@name |
Models with field starting with name |
#action |
Functions starting with action |
:sale |
Models from module sale |
res.partner@name |
Fields in res.partner only |
res.partner#action |
Functions in res.partner only |
Hover Navigation
Hover over any Odoo symbol for instant navigation. All locations are clickable links — current file shows *(here)* marker.
Model hover (Python + XML)
Hover _name, _inherit, class MyModel(models.Model), model="res.partner", or any 'res.partner' string:
### ⬡ `res.partner`
⬡ 45 own  ⬡ 312 effective  ⬡ 28 methods

📁 `base`  ✦ defined  base/models/res_partner.py:45 *(here)*
📁 `sale`  ↳ inherit  sale/models/res_partner.py:12

---
Inherits: `mail.thread` → `mail.activity.mixin` → `mail.thread.mixin`
Field hover
Hover any field = fields.Type( line:
### ⬡ `partner_id`  `fields.Many2one`
⬡ `sale.order`

---
🔗 Comodel: `res.partner`  (clickable link)
ℹ required

---
Used in 3 views:
⬡ `form` `sale_order_form` sale/views/order_views.xml:45
⬡ `list` `sale_order_tree` sale/views/order_views.xml:12
[Show all 3 views]
Function hover
Hover any def method_name( line:
### ⬡ `action_confirm`
`@api.multi`
⬡ `sale.order`

---
👁 Depends: `state`, `partner_id`

Defined in:
📁 `sale`  sale/models/order.py:120

Overridden in:
📁 `sale_stock`  sale_stock/models/order.py:45

Called from (12):
→ sale/wizard/confirm.py:34
→ sale/models/order.py:89
[Show all 12 callers]
Clicking Show all N opens a QuickPick with the full list.
XML view hover
Hover id="view_id", ref="module.view_id", or inherit_id ref="...":
### ⬡ View: `sale_order_form` `[form]`

---
⬡ `sale`  sale/views/order_views.xml:10
  └─ ⬡ `sale_stock`  sale_stock/views/order_views.xml:5
  └─ ⬡ `account`  account/views/order_views.xml:7
Log Panel
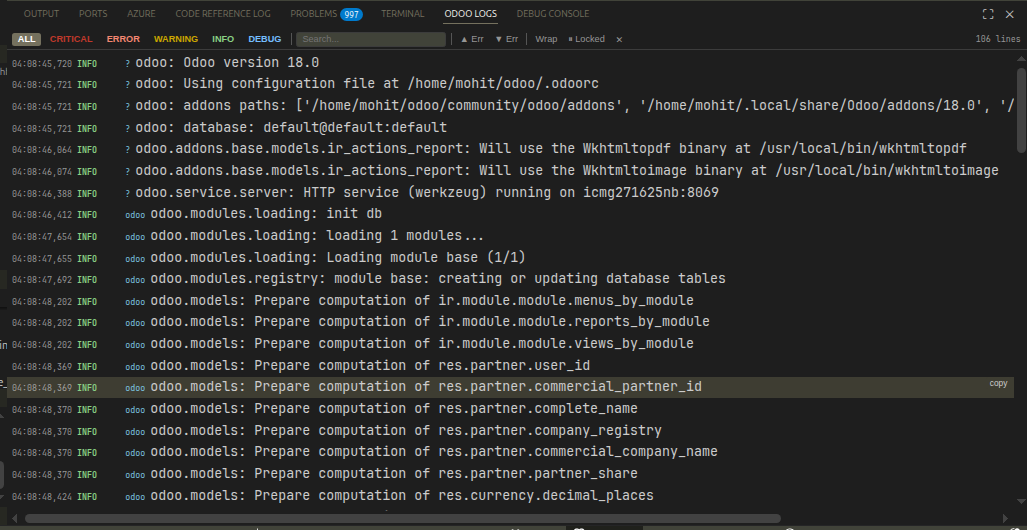
Live log panel at the bottom (next to Terminal):
- Filter buttons — ALL / CRITICAL / ERROR / WARNING / INFO / DEBUG with counts
- Search — Live search with highlight
- ▲ Err / ▼ Err — Jump to previous/next error
- Traceback grouping — Collapsed by default, click
▶ to expand
- Navigate to file —
File "/path/file.py", line 42 are clickable links
- Auto-scroll with lock when scrolling up
- Build output — Update/Install/Upgrade operations also write to the log panel
- Disable —
odooDebugger.logPanel.enabled: false for zero overhead
Data Browser
Interactive table in an editor tab:
- Browse model records or field values from DB
- Sortable columns,
%term% search, custom SQL bar
- Open in Odoo (form view), copy cell on double-click
- Tables — All public tables, filterable. Browse, show columns, copy SELECT
- History — Last 20 queries, click to re-run
- Run SQL (
Ctrl+Shift+Q) — Result in data browser
Navigation
- Toggle Py ↔ XML (
Ctrl+Shift+T) — Jump between model .py and _views.xml
- Go to Model (
Ctrl+Shift+M) — Find _name = 'model.name' from word under cursor
- Go to XML ID (
Ctrl+Shift+X) — Find id="xml_id" from word under cursor
- Go to Function Def (
Ctrl+Shift+.) — Find original definition
- Go to All Definitions — All definitions in a QuickPick
JS Debugging
- Launch Chrome Debug — Opens Chrome with remote debugging +
?debug=assets
- Attach JS Debugger — Attaches VS Code to Chrome with auto-generated
pathMapping
- Switch Database — Lists all PostgreSQL DBs
- Copy Database —
createdb -T source newname
- Drop Database — With confirmation
- Clear Asset Bundles — Deletes
/web/assets/* attachments
Keyboard Shortcuts
| Shortcut |
Action |
Ctrl+Shift+R |
Run Odoo |
Ctrl+Shift+D |
Debug Odoo |
Ctrl+Shift+S |
Stop Odoo |
Ctrl+Shift+U |
Update Module |
Ctrl+Shift+I |
Install Module |
Ctrl+Shift+G |
Update Changed Modules |
Ctrl+Shift+B |
Open Odoo in Browser |
Ctrl+Shift+O |
Open Odoo Shell |
Ctrl+Shift+Q |
Run SQL |
Ctrl+Shift+M |
Go to Model |
Ctrl+Shift+X |
Go to XML ID |
Ctrl+Shift+T |
Toggle Py ↔ XML |
Ctrl+Shift+. |
Go to Function Definition |
Ctrl+Alt+N |
Quick Find |
Ctrl+Alt+E |
Focus Panel |
Settings Reference
| Setting | Default | Description |
|---|---|---|
| odooDebugger.configFile | .odoorc | Odoo conf file path |
| odooDebugger.database | | DB name (auto-read from conf) | | `odooDebugger.addonsPaths` | `[]` | Addons directories | | `odooDebugger.odooBinPath` | | Path to odoo-bin (auto-detected) |
| odooDebugger.venvPath | | Python interpreter (auto-detected) | | `odooDebugger.port` | `8069` | Odoo HTTP port | | `odooDebugger.extraArgs` | `[]` | Extra odoo-bin args | | `odooDebugger.debugOptions` | `{justMyCode:false}` | debugpy launch options | | `odooDebugger.dbHost` | | PostgreSQL host |
| odooDebugger.dbPort | | PostgreSQL port | | `odooDebugger.dbUser` | | PostgreSQL user |
| odooDebugger.dbPassword | | PostgreSQL password | | `odooDebugger.logPanel.enabled` | `true` | Enable log panel | | `odooDebugger.logPanel.logFile` | `/tmp/odoo-vscode.log` | Log file path | | `odooDebugger.modelExplorer.sources` | `[]` | Addons dirs to scan (empty = use addonsPaths) | | `odooDebugger.modelExplorer.groupByModule` | `true` | Group by module | | `odooDebugger.modelExplorer.sortOrder` | `alpha` | `alpha` or `recent` | | `odooDebugger.modelExplorer.typeFilter` | `model` | Default type filter on startup | | `odooDebugger.modelExplorer.showViews` | `true` | Show Views folder | | `odooDebugger.modelExplorer.autoReveal` | `true` | Auto-reveal on cursor move | | `odooDebugger.upgradeScript` | | Custom upgrade script |
| odooDebugger.chromePath | `` | Chrome binary path |
| odooDebugger.chromeDebugPort | 9222 | Chrome debug port |
Requirements
- VS Code
1.85.0 or later
ms-python.debugpy extension (auto-installed)- Python with Odoo dependencies installed
- PostgreSQL with
psql on PATH
- Odoo source with
odoo-bin
License
MIT © Mohit Ghodasara