AI Monitor for VSCode
See every AI process running on your machine, how many tokens they burned, and how much of
your account limit is left - in a panel next to your code.
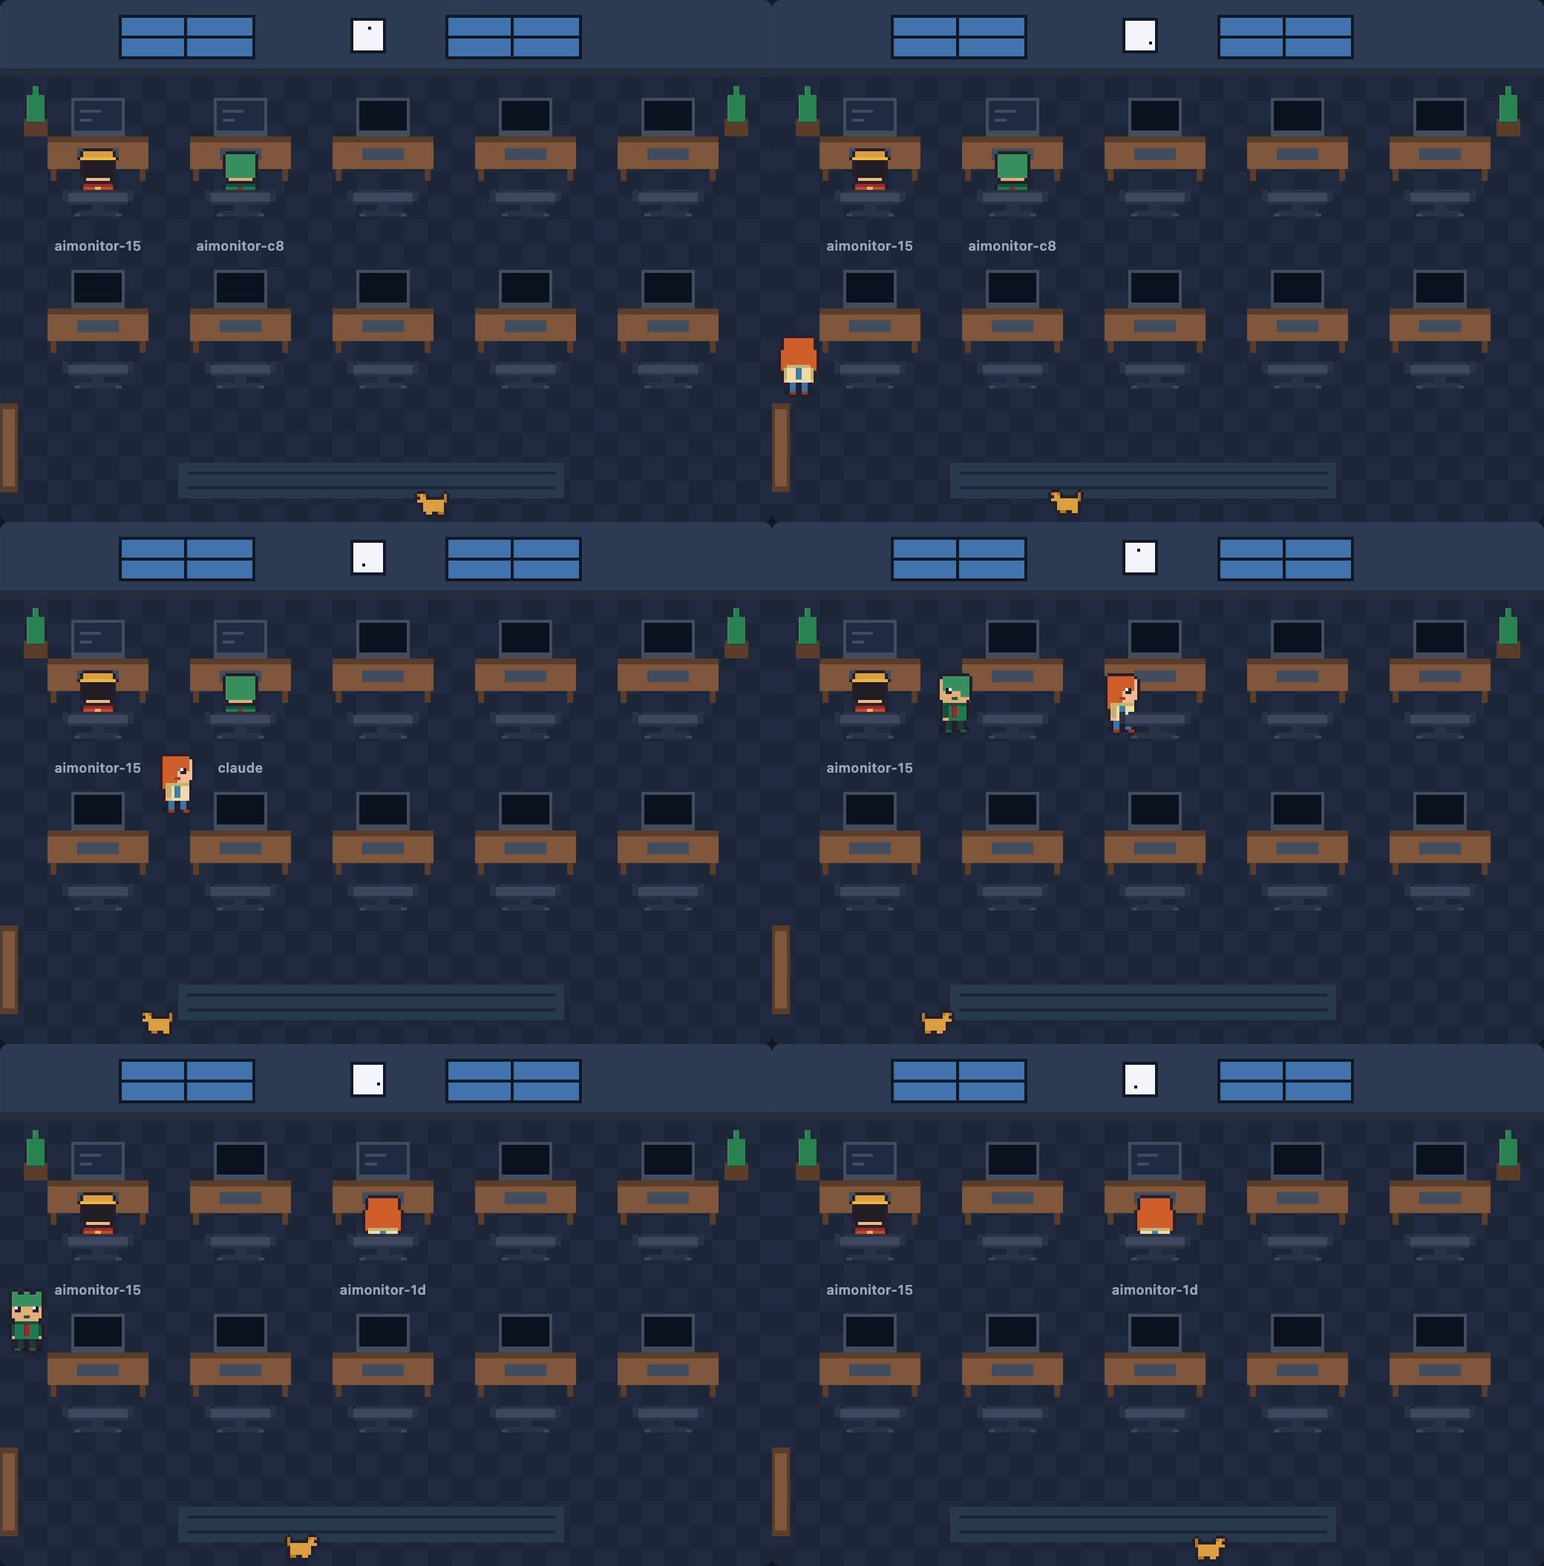
The Office view: every agent running on your machine is a character at a desk. Its screen
shows what kind of work it is doing right now - blue for editing files, green for reading,
amber for running commands. Click a computer to open that session in full.
Everything runs on 127.0.0.1. No data leaves your machine, no account, no API key, no
telemetry.
What it shows
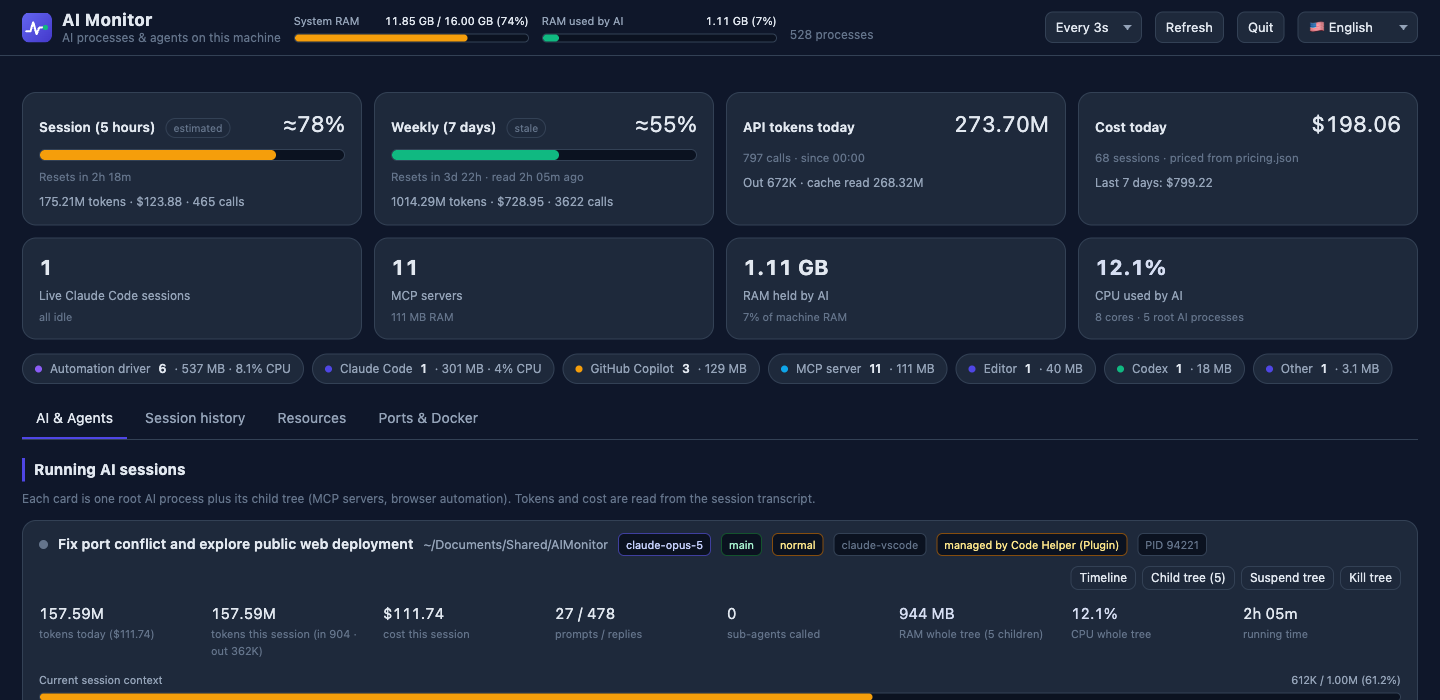
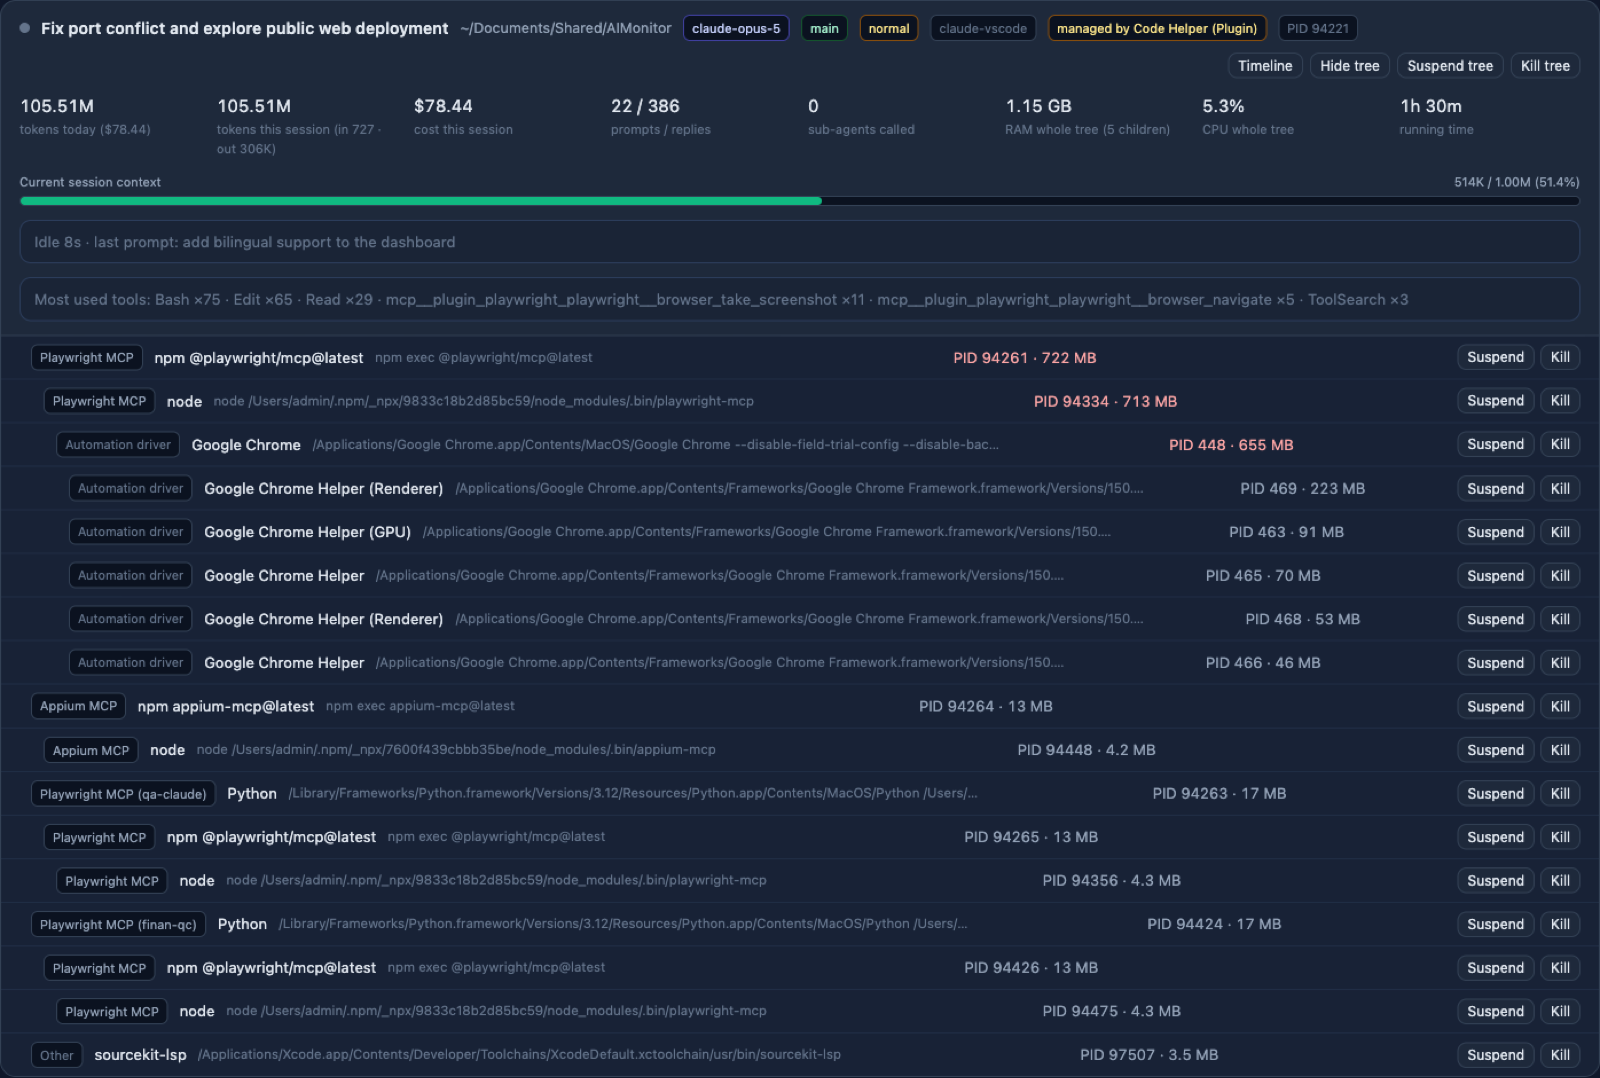
- Every AI process, grouped into its real tree. One Claude Code session is rarely one
process: sub-agents, MCP servers, hooks and language servers all hang off it. AI Monitor
groups them by parent so you can see which session owns what, with CPU and RAM rolled up
per tree.
- Tokens and cost. Input, output, cache read and cache write, counted per hour from your
local Claude Code transcripts - today, the last 5 hours, the last 7 days. Cost comes from a
price table you can edit, and the totals have been cross-checked against
npx ccusage.
- Session and Weekly limits. The 5-hour and 7-day numbers Claude Code itself reports,
plus what you have spent since that number was last refreshed - so the panel does not sit
at 15% while the CLI already says 18%.
- Open ports. Which local ports your dev processes and Docker containers are holding.
- Kill or suspend a process straight from the panel, with AI Monitor and its own parent
processes protected from being killed by accident.
- The Office view. The same information as a small pixel office - one desk per agent, the
screen colour telling you what kind of work it is doing, sub-agents standing next to whoever
called them. Seven character sets to pick from, or drop in a picture of your own and it will
cut the characters out for you, entirely on your machine.
Two ways in
- Status bar. AI Monitor sits at the bottom of the window with your Session and Weekly
limits, amber past 70% and red past 90%. Click it to open the dashboard. It never starts
anything on its own - it shows numbers when a server is already running and stays a plain
label otherwise, so opening VSCode costs nothing.
- Activity bar icon. Opens the same dashboard in the side panel, in a compact layout built
for a narrow column. The editor tab gets the full-width layout instead. Both share one
server.
Settings
Extensions => AI Monitor, or search @ext:mituultra.aimonitor in Settings.
| Setting |
What it does |
aimon.pythonPath |
Pin a specific interpreter. Empty = auto-detect. Run AI Monitor: Select Python Interpreter to pick from a list of everything found, with versions |
aimon.serverPort |
Fix the port instead of letting the OS choose |
aimon.reuseRunningInstance |
Share a server with the standalone app and other VSCode windows |
aimon.openIn |
Whether the status bar opens the editor tab or the side panel |
aimon.statusBar.* |
Show or hide it, which numbers it shows, which side it sits on |
aimon.refreshSeconds |
How often the dashboard refreshes |
aimon.theme |
Follow the VSCode theme, or pin light or dark |
aimon.claudeDataDir, aimon.pricingFile |
Point at a different Claude data folder or price table |
Setup
Install the extension and open the panel. That is the whole setup.
The extension finds Python on its own. It scans the py launcher, everything on PATH, and
the standard install folders, then runs each one to check the version - so it works even when
Python is installed but was never added to PATH, which is the usual case on Windows.
Only if the machine genuinely has no Python 3.9+ does the panel say so, with a Download
Python button and a Try again button next to it. Install, click Try again, done. Nothing
to configure, no settings to fill in.
The dashboard has no dependencies of its own - the server is pure Python standard library.
Measured on an Apple M2 (8 cores, 16 GB) running 500+ processes - not estimated. Full method
and numbers: docs/hieu-nang.md.
| What you are doing |
CPU (of the whole machine) |
RAM |
| Installed but never opened |
0% - no process running |
0 |
| Status bar only |
0.01% |
30 MB |
| Panel open but collapsed / behind another view |
0% - polling stops |
30 MB |
| Dashboard open |
0.37% |
30 MB + ~40 MB page |
| Dashboard + Office view |
0.70% |
30 MB + ~47 MB page |
- Nothing starts until you open the panel. The status bar item never launches the server;
it only displays numbers if one is already running.
- Collapse the panel and it goes fully idle - both the data polling and the animation
stop, verified by counting actual requests.
- The extension host stays responsive. The status bar fetches 2.4 KB every 6 seconds, not
a full snapshot.
- Windows costs more than macOS/Linux because listing processes there has to spawn
PowerShell. Estimated 10-35% of one core while the dashboard is open, not yet measured on
real hardware.
Privacy
Everything is local. The extension starts a server bound to 127.0.0.1, and the dashboard
only ever talks to that server - no external requests, no CDN, no fonts, no analytics, no
telemetry, no ads. It reads your local Claude Code transcripts and process list, and sends
them nowhere.
How it works
The first time you open the panel, the extension starts a small local HTTP server bundled
inside it (python -m aimon.server) on a port the OS picks, and embeds the dashboard. Close
the panel and the server shuts down again.
If AI Monitor is already running - the standalone macOS app, the Windows build, or another
VSCode window - the extension reuses that server instead of starting a second one.
Works over Remote-SSH and Codespaces: the dashboard URL goes through VSCode's own port
forwarding.
Also available as
A standalone macOS app (signed and notarized) and a Windows .exe that needs no
Python at all - see the repository.
Language
The dashboard is bilingual, English and Vietnamese. Switch with the dropdown in the header;
the choice is remembered.
Feedback
Bugs and feature requests: GitHub issues.
MIT licensed.

