Real-time variable monitoring WITHOUT halting the CPU — the missing Keil Live Watch experience for VS Code.
Unlike the built-in Debug Watch that requires pausing your program, ARM LiveWatch continuously reads MCU memory while your firmware keeps running — just like Keil's Live Watch.
Why This Extension?
Cortex-Debug Watch
ARM LiveWatch
CPU must be halted?
Yes
No
Real-time updates?
No (manual refresh)
Yes (auto polling)
Struct expansion?
Limited
Full tree with nested structs
Edit values at runtime?
No
Yes (double-click)
Enum name display?
No
Yes
Pointer chain follow?
No
Yes (ptr->field)
Supported Chips
Any ARM Cortex-M chip supported by OpenOCD:
Vendor
Series
ST
STM32F0/F1/F2/F3/F4/F7/H7/G0/G4/L0/L1/L4/U5/C0
GigaDevice
GD32F1/F3/F4/E5
NXP
LPC1xxx, LPC4xxx, i.MX RT
TI
TM4C, CC26xx, CC32xx
Nordic
nRF51/nRF52/nRF53
Microchip
SAM D/E/L/C, SAM3/4, ATSAM
WCH
CH32V (requires RISC-V GDB)
Espressif
ESP32-C3 (RISC-V, requires matching GDB)
If your chip works with OpenOCD + arm-none-eabi-gdb, it works with ARM LiveWatch.
Features
Live variable watch — continuously reads SRAM without halting the CPU
Struct/class expansion — auto-parses nested structs, unions, and arrays into a tree view
Enum name display — maps raw enum values to their symbolic names
Pointer chain tracking — supports ptr->field expressions with automatic dereference
Runtime value editing — double-click any leaf value to write directly to MCU memory
Multiple display formats — right-click to switch between Auto / Hex / Decimal / Float / Binary
Auto ELF detection — finds your ELF from launch.json (cortex-debug) or build/ directory
Auto reconnect — reconnects to OpenOCD automatically after disconnection
Change highlighting — yellow flash animation when values change
Quick Start
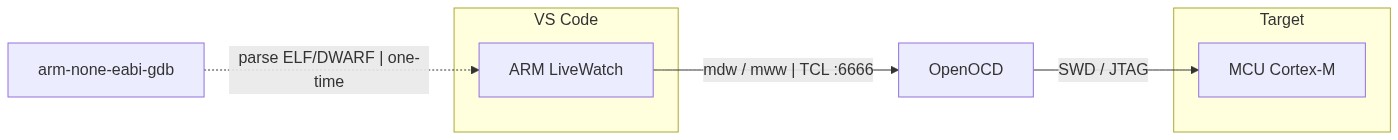
Prerequisites
arm-none-eabi-gdb — for parsing DWARF debug info from your ELF
OpenOCD — running and connected to your board (default TCL port: 6666)
Usage
Install the extension
Start OpenOCD with your board connected
Open the ARM LiveWatch tab in the VS Code bottom panel
Type a variable name and press Enter — done!
The ELF file is auto-detected from your launch.json cortex-debug config or build/ directory.
Examples
speed_pid              → watch a global struct, expand to see all fields
motor.output           → watch a specific struct member
ins_topic.data_->euler → follow a pointer chain