Debug Adapter for MPLAB®
Welcome! We are working hard to improve your experience and appreciate your patience and support. Features and functionality will remain in active development. Your feedback is invaluable to us. Please report any bugs or suggestions for enhancements.
✨ Features
The Debug Adapter for MPLAB is responsible for:
- Installing the debugger component from the MPLAB® X IDE
- Creating debug configurations based on the MPLAB project opened
- Managing tool support files
- Adding tasks to program/erase a device and start a GDB server
Some of the debug features supported are:
- Debug launch
- Line and function breakpoints
- Pause and Continue
- Step in/out/over
- Inspecting variables in scope
- Inspecting CPU registers
- Callstack
- Variable watches
🏃♀️ Getting started
There are a couple of ways to start a debugging session.
Launch a single file
If you have a file open, and it is part of one or more MPLAB project configurations,
just go to the Run menu and select Start Debugging (F5). In the debugger selection,
select the MPLAB Debugger option. If the file is part of multiple project configurations,
select which configuration you want to launch into. Select the debug tool you want
to use, and then the debug session will launch.
Using an automatic debug configuration
If you want to launch a single MPLAB project configuration, go to the Run and Debug window,
and select Show all automatic debug configurations. In the dropdown, select the
MPLAB Debugger... option. Select the configuration and the workspace that you want to
launch. Select the tool to use, and the debug session will start.

Creating a launch.json file
The most flexible and configurable way to start a debug session is to create a launch.json
file that describes one or more of your launch configurations.
Go to the Run and Debug tab, and select create a launch.json file. Select the
workspace to use, then select the MPLAB Debugger. This will generate one launch configuration
for each project configuration. The tool is not selected, but leaving the placeholder will mean
that you are asked when you launch.
Select the launch configuration you want and the session will launch.
The launch.json file is meant to be customized. For instance, you can change the tool to
use, what interface to connect over, and a lot of other settings. The example below takes the two
launch configurations that were created, changes one to use a development kit, and the other to
use the MPLAB Simulator. Then both are launched.
To customize the interpretation of numerical formats in the watch
window, right click a variable and select Watch: Set Numeric Format.
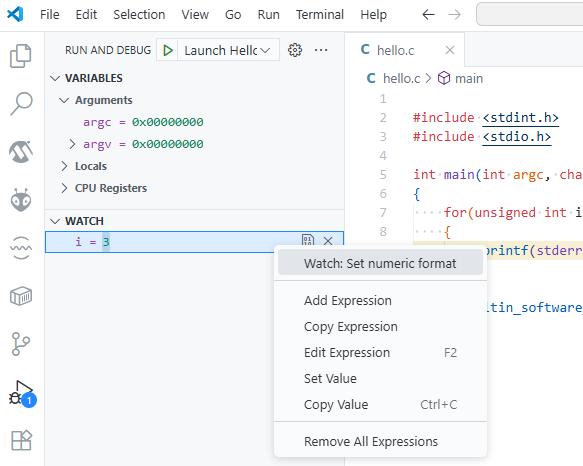
This opens a new view that allows you to set and configure the format of the variable.
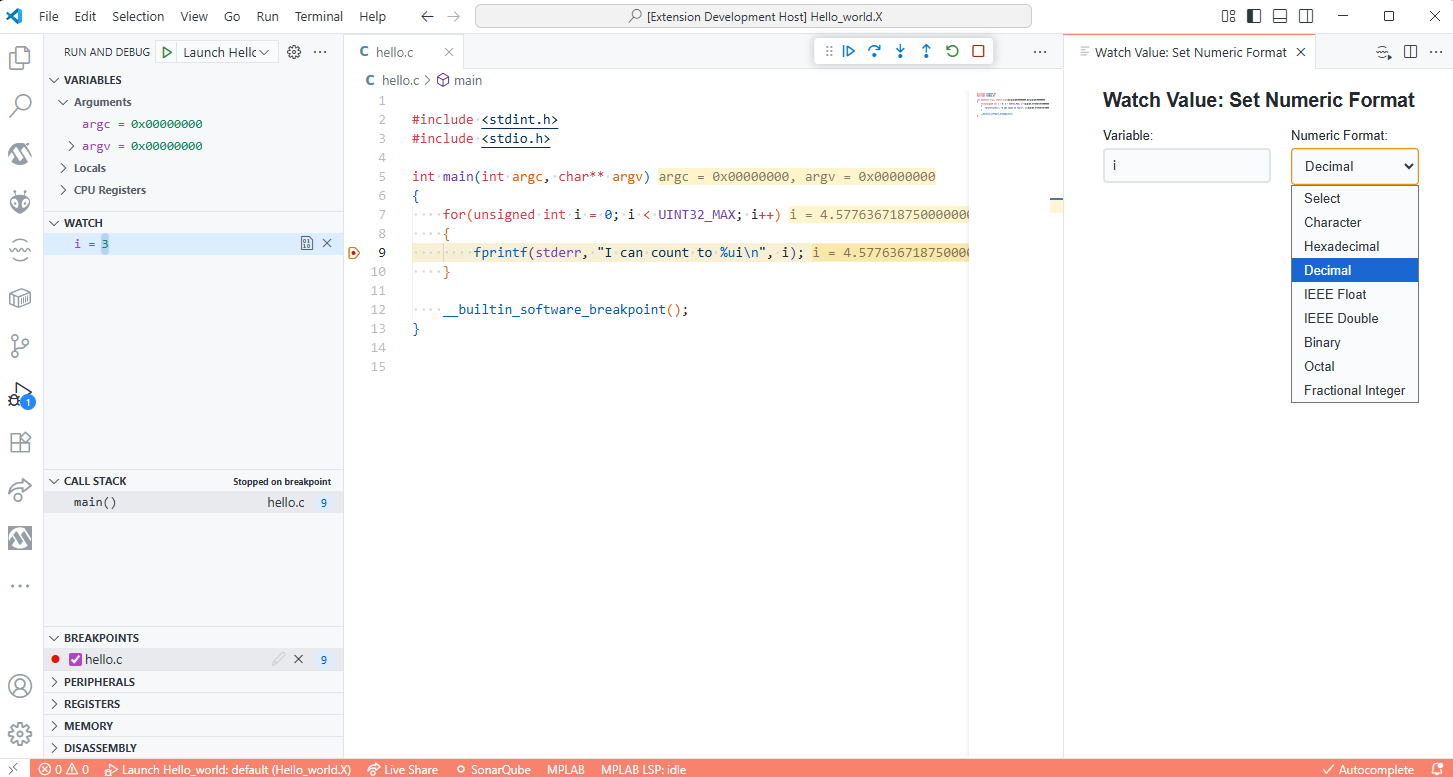
NOTE: The format is only applied after a debug action, such as run or step, is executed.
Logpoints
A logpoint is a type of breakpoint that doesn't pause execution in the debugger; instead, it records a message to the debug console. For more info see VS Code Logpoint documentation
The debug adapter is capable of normal logpoints using the normal curly brace ({) and }) evaluation of symbols in scope. Additionally, the following
tokens are supported in the log message:
| Token |
Description |
Example Output |
$ADDRESS |
Current instruction |
0x1234 |
$FUNCTION |
Current function name |
NVIC_Initialize |
$FILEPOS |
Current source file location |
main.c:120 |
Memory view
To access raw memory, a viewer extension is required. We recommend using Memory Inspector from Eclipse CDT Cloud.
Memory references
To access non-linear memory, a concept of memory references
is used.
For devices with linear memory, this is just the base address of the memory to view. For devices with non-linear memory, such as AVRs,
either use a linearized address or a scoped address. To find the addressing applicable for a specific device, open the Debug Console and run
memory -references
The above command will list the base ranges for the device currently being debugged.
To list available commands, run
help -?
Accessing USB devices under Linux and WSL
The debug agent used for the mplab-core-da debugger uses udev to configure attached USB
devices to get the correct permissions for accessing them.
libusb-1 is required for the actual USB communication.
UDEV
If your environment does not have udev installed, make sure that it is. It should be running as a service, so can be checked
for instance by querying systemd or whatever service manager that is being used.
$ systemctl status udev
● systemd-udevd.service - Rule-based Manager for Device Events and Files
     Loaded: loaded (/usr/lib/systemd/system/systemd-udevd.service; static)
    Drop-In: /usr/lib/systemd/system/systemd-udevd.service.d
             └─syscall-architecture.conf
     Active: active (running) since Fri 2024-07-19 06:41:41 MST; 1h 4min ago
 Invocation: 6d60678ee58747daa0b4ecdf9dbf97a5
TriggeredBy: ● systemd-udevd-control.socket
             ● systemd-udevd-kernel.socket
       Docs: man:systemd-udevd.service(8)
             man:udev(7)
   Main PID: 688 (systemd-udevd)
     Status: "Processing with 40 children at max"
      Tasks: 1
     Memory: 4.4M
     CGroup: /system.slice/systemd-udevd.service
             └─udev
               └─688 /usr/lib/systemd/systemd-udevd
If udev is not available, check with your package manager how to install it.
libusb
Ensure that your runtime has the libusb version 1 library installed and available. If it is not installed, for
instance if you run in a continainerized environment, make sure that it is installed through your package manager.
Forwarding USB devices to WSL2
Forwarding USB devices are described in
Connect USB devices.
Once the device has been forwarded, it should appear under lsusb:
$ lsusb
Bus 001 Device 002: ID 03eb:2141 Atmel Corp. ICE debugger
Bus 001 Device 003: ID 04d8:9015 Microchip Technology, Inc. ICD 4 In-Circuit Debugger
Ensure correct access permission
Once the device appears under lsusb, ensure that udev configured the
device correctly by looking at what Bus and Device index the attached
USB device has, and check the permissions on that node under /dev/bus/usb/.
$ lsusb
Bus 001 Device 003: ID 04d8:9015 Microchip Technology, Inc. ICD 4 In-Circuit Debugger
$ ls -la /dev/bus/usb/001/003
crw-rw-rw- 1 root root 189, 2 Jul 19 06:52 /dev/bus/usb/001/003
Note the rw-rw-rw part indicating read-write access.
Running the List connected tools command now should list the connected tools in the
Output pane.
06:52:43.558: [info]: Tools connected:
ICD 4     BUR212372451 Microchip Technology Incorporated
Atmel-ICE J41800034538 Atmel Corp.
Supported tasks
Debug Adapter
The Debug Adapter for MPLAB supports VS Code tasks for erasing and programming a device.
Tasks can either specify the setup directly or refer to an MPLAB project and configuration containing the necessary settings.
Example of program task using an MPLAB project (which contains a configuration with a tool and device):
{
 "type": "MPLAB-DebugAdapter",
 "label": "My custom program task",
 "action": "program",
 "project": "My_Project",
 "configuration": "default"
}
Example of erase task without any project:
{
 "type": "MPLAB-DebugAdapter",
 "label": "My custom erase task",
 "action": "erase",
 "device": "PIC32CM1216MC00032",
 "tool": "PKOB nano",
 "serial": "MCHP12345678910"
}
GDB Server
This extension also supports starting a gdb server via a task. As with the Debug Adapter tasks, this can be done directly or with a reference to an MPLAB project and configuration.
For a fully automated experience reference this task as preLaunchTask in the launch configuration of any gdb client.
Example of a gdb server task configuration:
{
 "type": "MPLAB-GdbServer",
 "label": "My custom gdb server task",
 "action": "start",
 "port": 1234,
 "project": "My_Project",
 "configuration": "default"
}
Scripting
This extension also provides tasks to load python scripts and execute functions that can directly interact with a device. Have a look at the documentation for more information. As for the previous tasks, you can define "device" and "tool" directly or link to an existing MPLAB project.
Example of loading a script:
{
 "type": "MPLAB-Scripting",
 "label": "Run setup script",
 "action": "loadFile",
 "file": "./scripts/my-script.py",
 "project": "My_Project",
 "configuration": "default"
}
Example of executing a function:
{
 "type": "MPLAB-Scripting",
 "label": "Configure device",
 "action": "executeFunction",
 "functionName": "my_func",
 "functionArgs": ["my_param_1", "my_param_2"],
 "project": "My_Project",
 "configuration": "default"
}
Programming an image to run without a debugger
If the MPLAB extensions do not provide a separate "production build," it is because one is not required. The generated .elf and .hex files are suitable for production use. You can test and program these files directly to your device using the command MPLAB: Program Device
DEBUG config bit
The DEBUG config bit is never included in the .elf or .hex produced by a build (even in MPLAB X). The value of the DEBUG config bit is uniquely managed by the MPLAB hardware debugger. The command MPLAB: Program Device will make sure the DEBUG config bit is set so that the device runs as intended in a production environment.
Template files
Template files enable automatic generation of launch.json and tasks.json entries with MPLAB-project-aware macro expansion. A number of pre-defined entries supporting third-party extensions are available. They can be accessed by running the command MPLAB: Add launch entry.
Alternatively, you can create those files manually in your project root:
<ProjectName>.launch.jsonc → generates .vscode/launch.json<ProjectName>.tasks.jsonc → generates .vscode/tasks.json
Example launch.jsonc
{
 "version": "0.2.0",
 "configurations": [
  {
   // %mplab:config=default
   // %mplab:id=my-debug.%{Configuration}.%{ProjectName}
   "name": "Debug %{ProjectName}:%{Configuration}",
   "type": "mplab-core-da",
   "request": "launch",
   "program": "%{TargetPath}",
   "device": "%{Device}",
   "tool": "%{Tool}"
  }
 ]
}
Macro Examples
| Macro |
Description |
%{ProjectName} |
Project base name |
%{Configuration} |
Configuration name (e.g., "default") |
%{Device} |
Target device |
%{Tool} |
Debug tool |
%{TargetPath} |
Absolute path to output file |
Directives
// %mplab:id=<unique-id> — Required. Identifies the entry for updates/merges// %mplab:config=<name> — Identifies the configuration within your MPLAB project
Requirements
🐞 Feedback and issue reporting
Go to mplabfeedback.microchip.com to report issues and suggest enhancements.
The MPLAB® Extensions for Visual Studio Code are distributed under a non-exclusive software license agreement provided by Microchip Technology Inc.
To review the complete terms and conditions governing the use of this software, please consult the "license" file included with this package.
Copyright © 2025 Microchip
