VSCode Agent Monitor
Monitor AI agent interactions in VSCode and scan for security vulnerabilities.
Features
- 🔍 Real-time Monitoring: Captures document changes and AI agent interactions
- 🔒 Security Scanning: Automatically detects API keys, passwords, and secrets
- 📊 Visual Dashboard: WebView dashboard showing telemetry and security findings
- 🔎 Event Browser: Browse, filter, and inspect individual LSP interaction events
- 💾 SQLite Storage: Persistent storage with BLAKE3 content deduplication
- 🎨 Dark Theme: Native VSCode theme integration
Installation
Requirements
Install Extension
- Download
vscode-agent-monitor-0.1.0.vsix
- VSCode → Extensions → "..." menu → Install from VSIX
- Reload VSCode
Quick Start
- Open a project folder in VSCode
- Extension activates automatically and creates
agent_telemetry.db
- Start coding - the extension captures significant changes (>10 chars)
- View dashboard:
Cmd+Shift+P → Agent Monitor: Show Dashboard
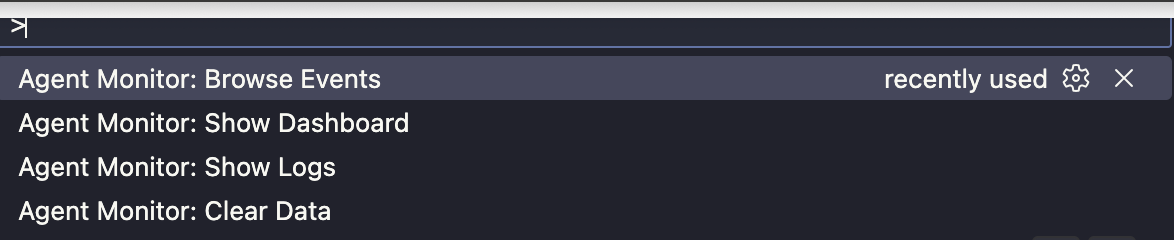
Commands
Agent Monitor: Show Dashboard - View telemetry and security findingsAgent Monitor: Browse Events - Browse and inspect captured LSP events with filtering and context viewAgent Monitor: Show Logs - See extension activity and debugging infoAgent Monitor: Clear Data - Delete telemetry database
What Gets Monitored
- Document changes (captures substantial edits, including AI completions)
- File saves
- Context around changes (for security analysis)
Security Detection
All captured data is automatically scanned for:
- 🔴 High Severity: API keys (sk-*), passwords
- 🟠 Medium Severity: High-entropy strings (potential secrets)
- 🟡 Low Severity: Suspicious patterns
Usage
Monitoring
The extension automatically monitors your workspace when active. Check logs to see activity:
Cmd+Shift+P → "Agent Monitor: Show Logs"
You'll see:
- Database initialization
- Document changes captured
- Capture count
Dashboard
View captured data and security findings:
Cmd+Shift+P → "Agent Monitor: Show Dashboard"
The dashboard shows:
- Total events captured
- Unique files (BLAKE3 deduplication)
- Security findings by severity
- Detailed findings table
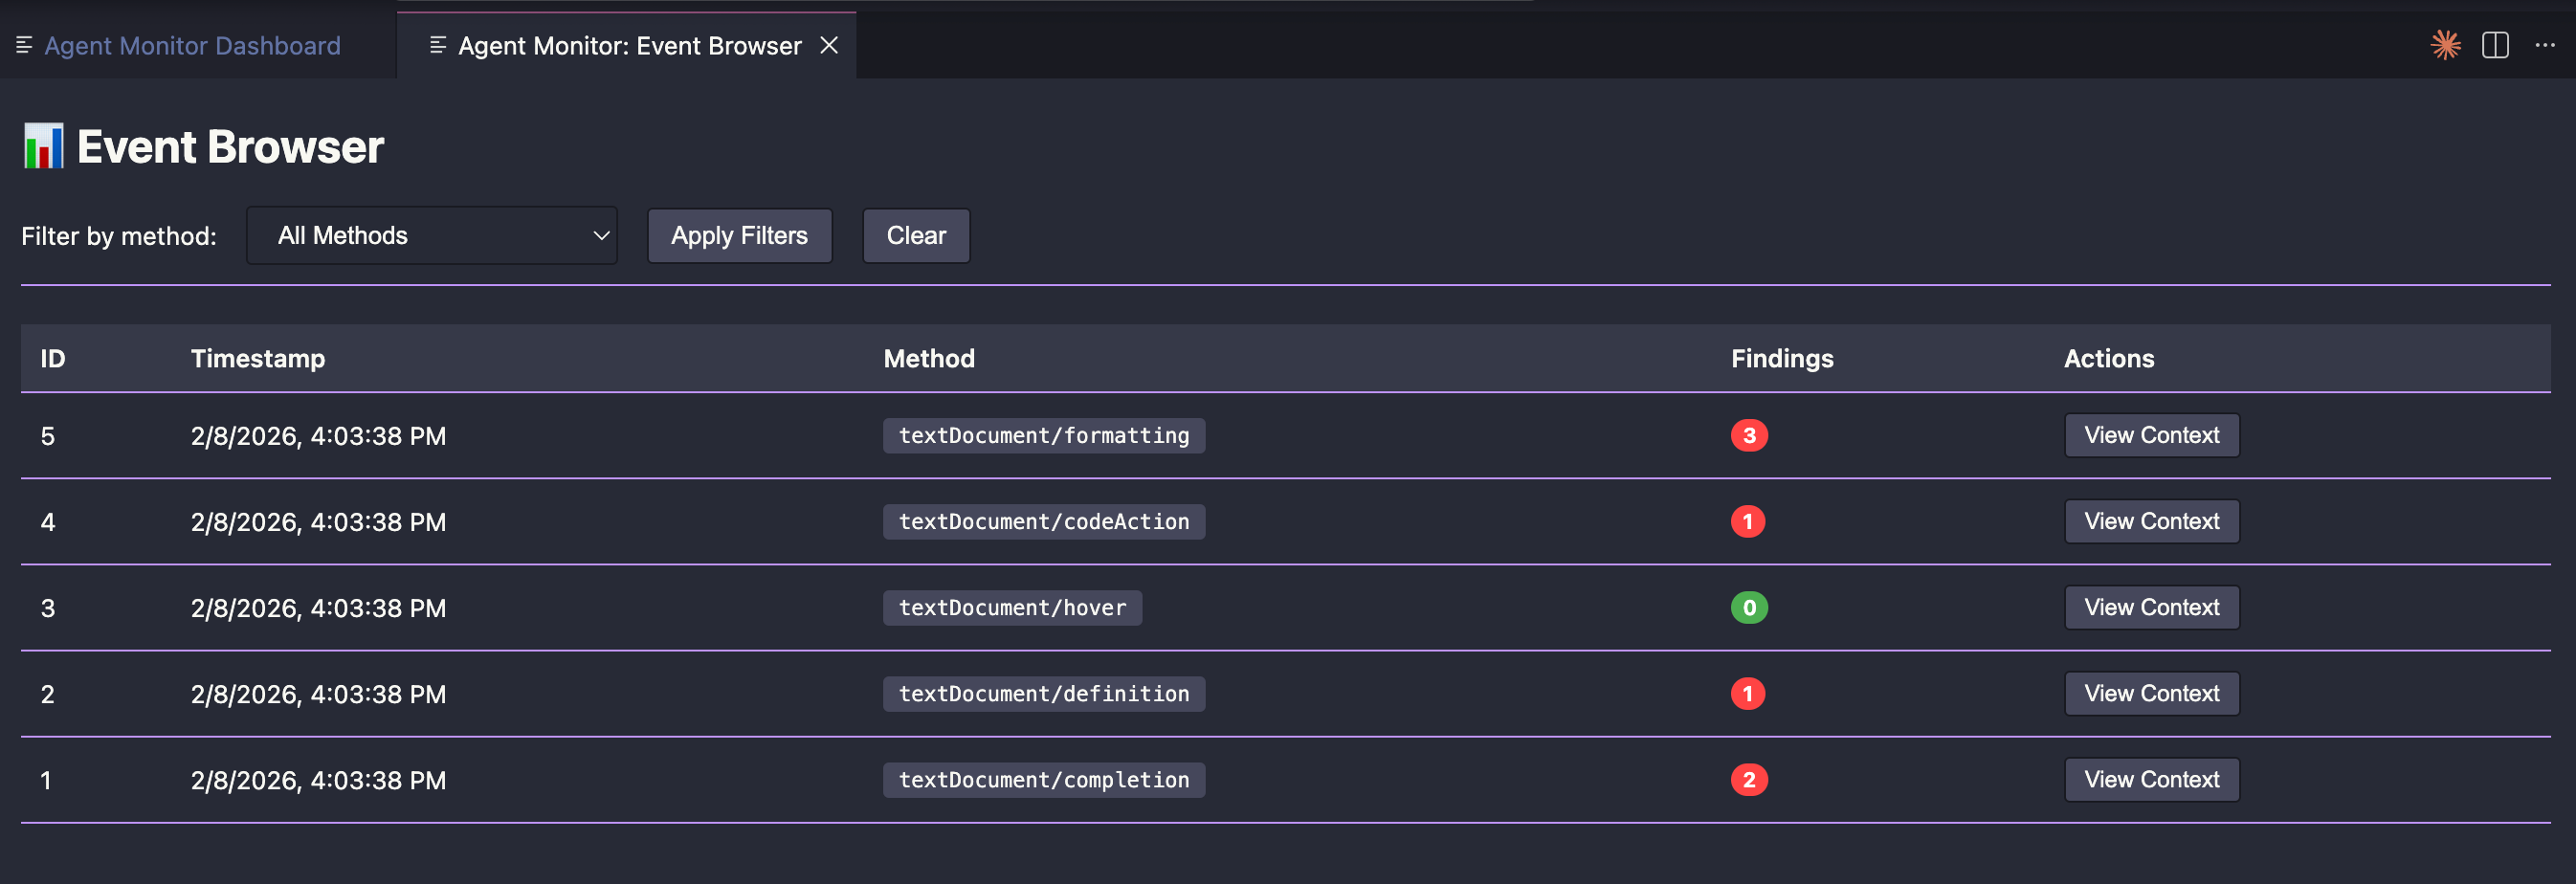
Event Browser
Browse and inspect individual captured events:
Cmd+Shift+P → "Agent Monitor: Browse Events"
The event browser shows:
- Captured LSP events with method, timestamp, and security finding count
- Filter events by method
- Inspect full request/response context and security findings per event
Manual Database Initialization
If automatic initialization fails, create the database manually:
cd /path/to/vscode-agent-monitor
cargo run --example init_db "/path/to/your/project/agent_telemetry.db"
Then reload VSCode.
Development
Architecture
- Rust Core: Security scanner, telemetry collector, storage manager
- TypeScript Extension: VSCode integration, UI
- SQLite: Persistent storage
- WebView: Dashboard visualization
See ARCHITECTURE.md for technical details.
Build Extension
npm install
npm run compile
vsce package
Run Tests
cargo test
Privacy & Security
- All data stored locally in your workspace (
agent_telemetry.db)
- No external servers
- You control when to clear data
- Add
agent_telemetry.db to .gitignore
License
MIT
Project Structure
vscode-agent-monitor/
├── src/                    # Rust core modules
│   ├── security_scanner.rs
│   ├── telemetry_collector.rs
│   ├── storage_manager.rs
│   └── visualization_panel.rs
├── src-ts/                # TypeScript extension
│   ├── extension.ts
│   └── lspCapture.ts
├── examples/              # Rust CLI examples
├── tests/                # Rust tests
└── out/                  # Compiled TypeScript