CodeClimate Visualiser
Visualise CodeClimate JSON and NDJSON reports directly inside VS Code — charts, filterable issue table, inline editor decorations, snapshot history and trends.


Overview
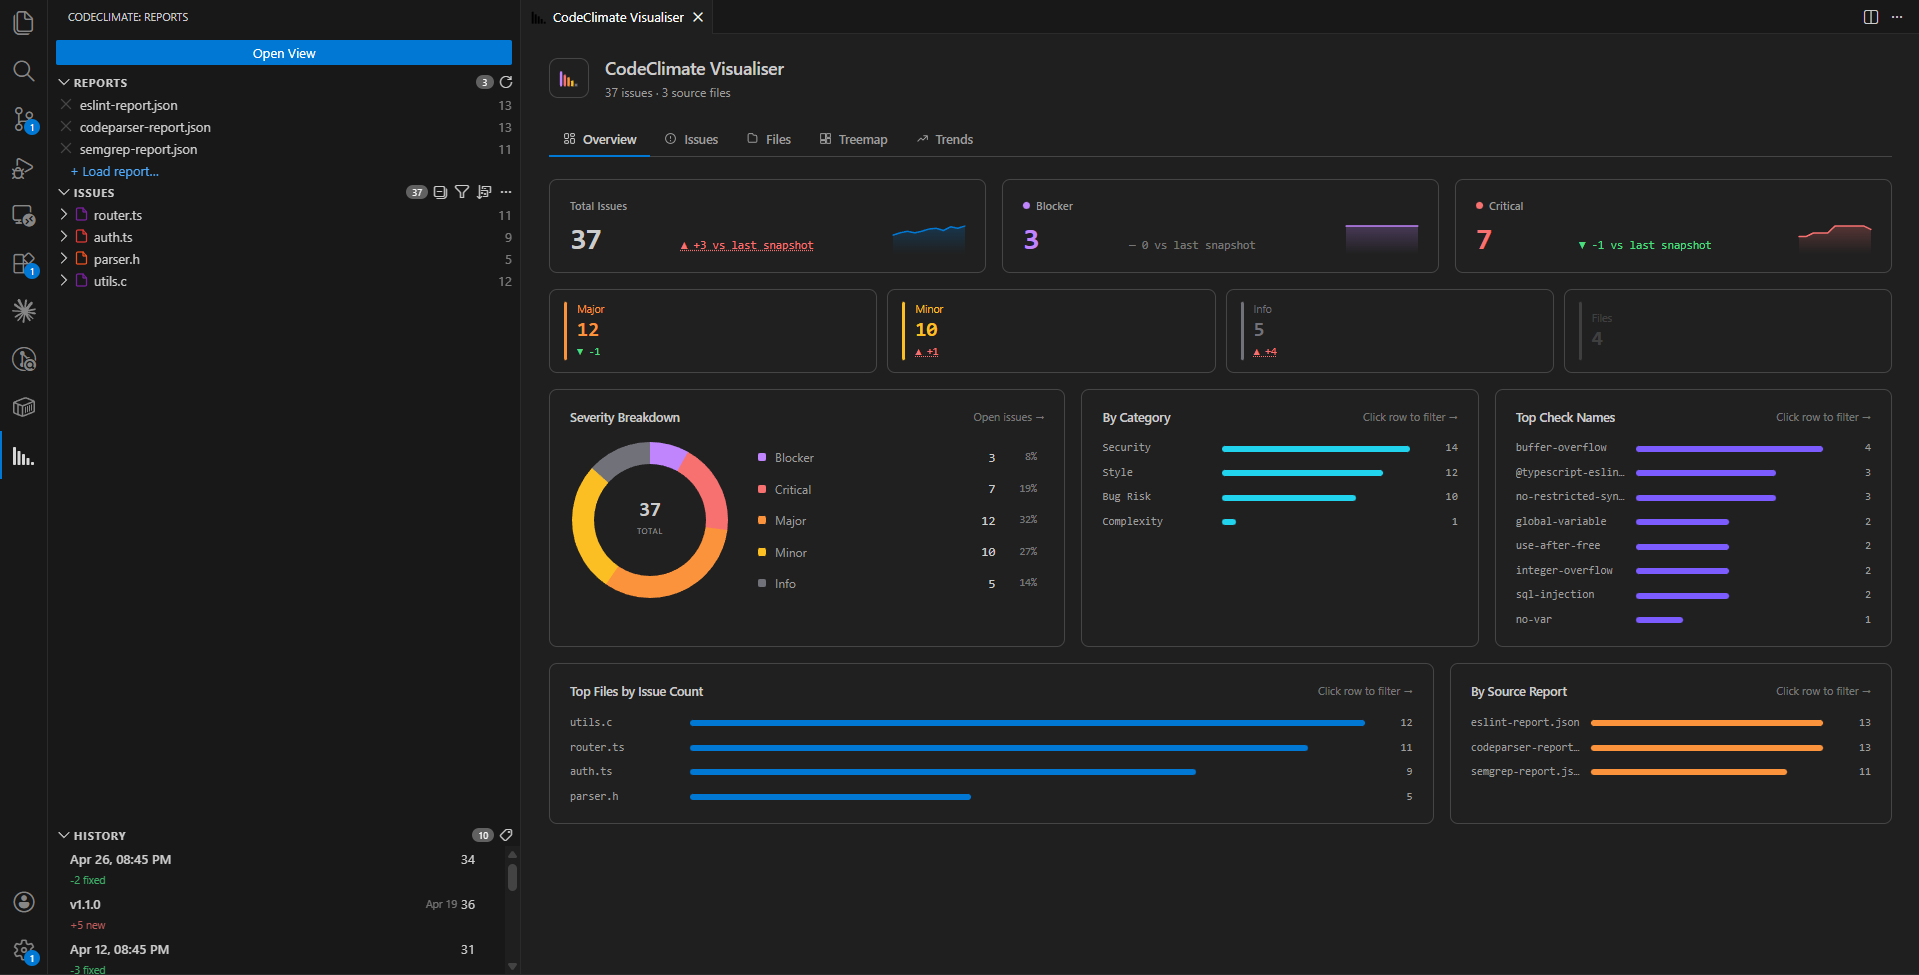
The Overview tab shows at a glance:
- KPI cards for each severity (Blocker → Info) with delta vs last snapshot
- Severity Breakdown donut chart
- By Category, Top Check Names, Top Files, By Source bar charts — every row is clickable and opens the Issues view pre-filtered
Issues Table
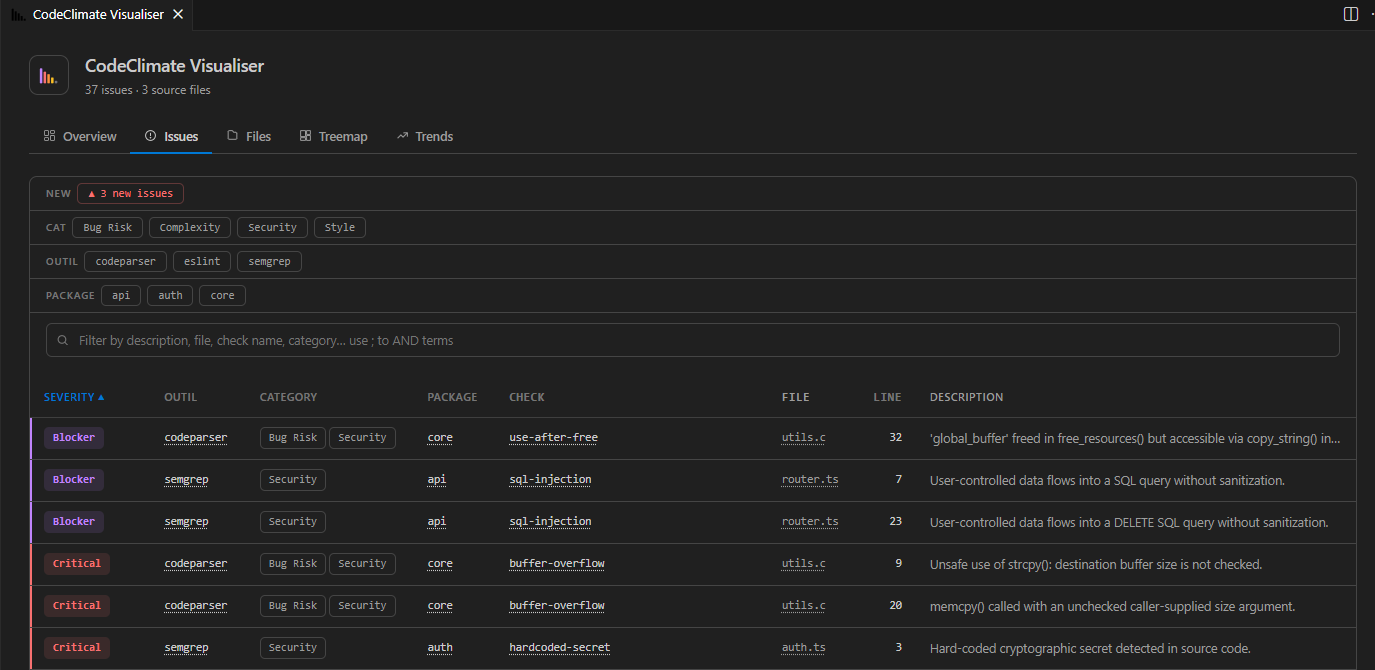
The Issues tab provides a fully filterable table:
- Quick-filter chips by severity, category, tool and any custom column
- New issues chip (
▲ N new issues) highlights issues not present in the last snapshot
- Free-text search with
;-separated AND terms
- Click any row to jump to the exact file and line in the editor
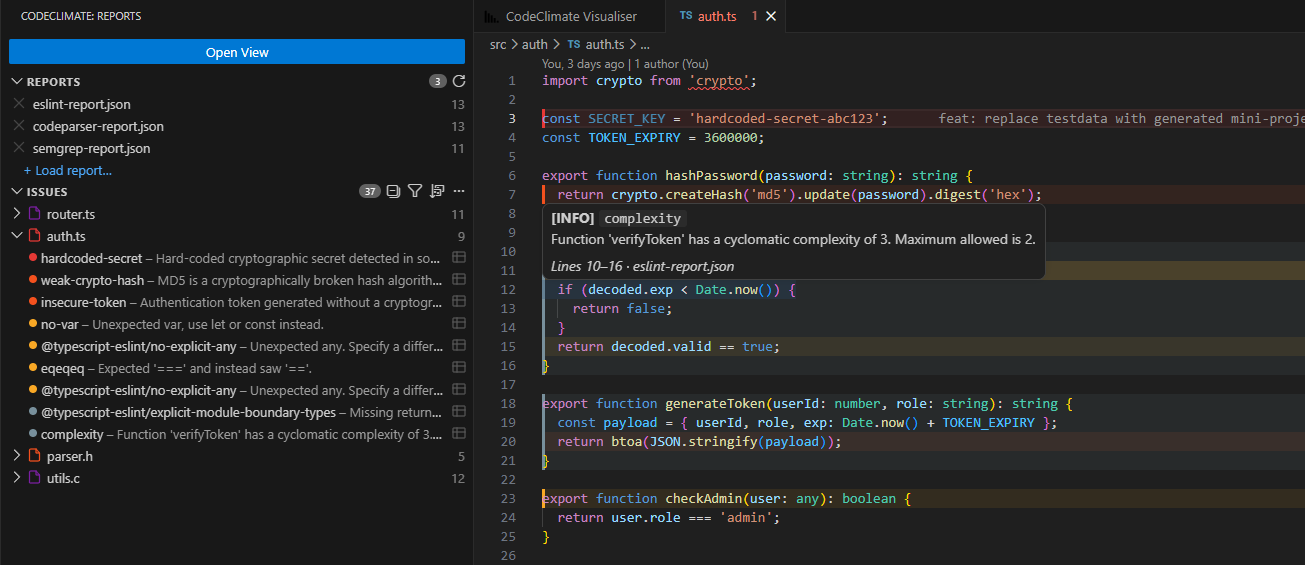
- Sidebar panel lists issues grouped by file, with severity dots and one-click navigation
- Inline decorations colour the gutter and show a hover tooltip with the issue description and source report
- Filter, sort, collapse and reload directly from the sidebar header
History & Trends
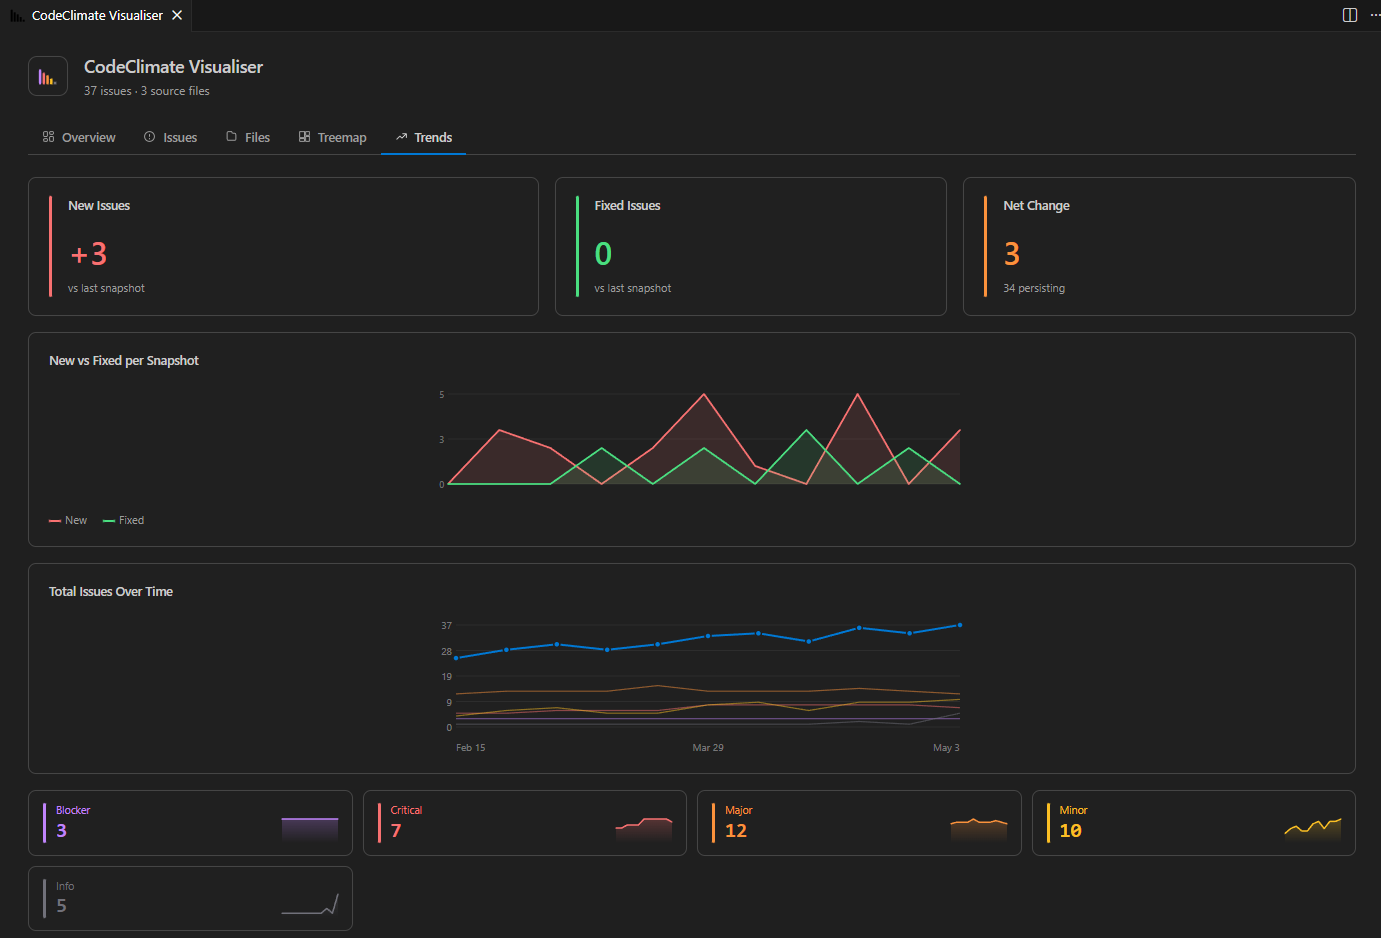
Save a snapshot at any point (tag icon in the History section). The Trends tab then shows:
- New vs Fixed area chart across snapshots
- Total Issues Over Time multi-line chart
- Per-severity sparkline cards — click to filter the Issues view
Getting Started
1 — Install
Search CodeClimate Visualiser in the VS Code Extension Marketplace, or install a .vsix from Releases:
code --install-extension codeclimate-visualiser-<version>.vsix
2 — Open the view
Open the Command Palette (Ctrl+Shift+P / Cmd+Shift+P) and run CodeClimate: Open View, or click the bar-chart icon in the Activity Bar.
3 — Load a report
| Method |
How |
| Auto-load |
Create .vscode/codeclimate-visualiser.json with reportPatterns (see below) |
| Browse |
Run CodeClimate: Open Report(s) or click + Load report… in the sidebar |
| Context menu |
Right-click any .json file → Load as CodeClimate Report |
Project Configuration
Create .vscode/codeclimate-visualiser.json at the workspace root:
{
  "reportPatterns": [
    "reports/*.json",
    "reports/semgrep-report.ndjson"
  ]
}
Reports reload automatically when the view opens or when CodeClimate: Reload Config is run (refresh icon in the Reports section header).
The extension accepts any file that CodeClimate or a compatible tool produces.
JSON array (--format json):
[
  {
    "type": "issue",
    "check_name": "rubocop/Style/StringLiterals",
    "description": "Prefer single-quoted strings.",
    "categories": ["Style"],
    "location": { "path": "app/models/user.rb", "lines": { "begin": 12 } },
    "severity": "minor",
    "fingerprint": "abc123"
  }
]
NDJSON (one object per line):
{"type":"issue","check_name":"rubocop/Metrics/MethodLength",...}
Supported severities: blocker · critical · major · minor · info
Commands
| Command |
Description |
CodeClimate: Open View |
Open the visualisation panel |
CodeClimate: Open Report(s) |
Browse for one or more report files |
CodeClimate: Reload Config |
Reload reports from the project config |
CodeClimate: Clear All |
Unload all reports |
CodeClimate: Save Snapshot |
Save current issue counts as a history snapshot |
Settings
| Setting |
Default |
Description |
codeclimateVisualiser.reportPatterns |
[] |
Glob patterns or absolute paths (workspace fallback) |
codeclimateVisualiser.showChartLegends |
false |
Show legends on charts |
codeclimateVisualiser.showSeverityFilter |
true |
Show severity quick-filter bar |
codeclimateVisualiser.showCategoryFilter |
true |
Show category quick-filter chips |
codeclimateVisualiser.showCheckNameFilter |
true |
Show check-name quick-filter chips |
License
MIT — Copyright 2025 Félix TREFOU