NMAP2Flowchart for VS Code
Syntax highlighting and a live flowchart preview for NMAP2Flowchart diagrams – network maps you write as code.
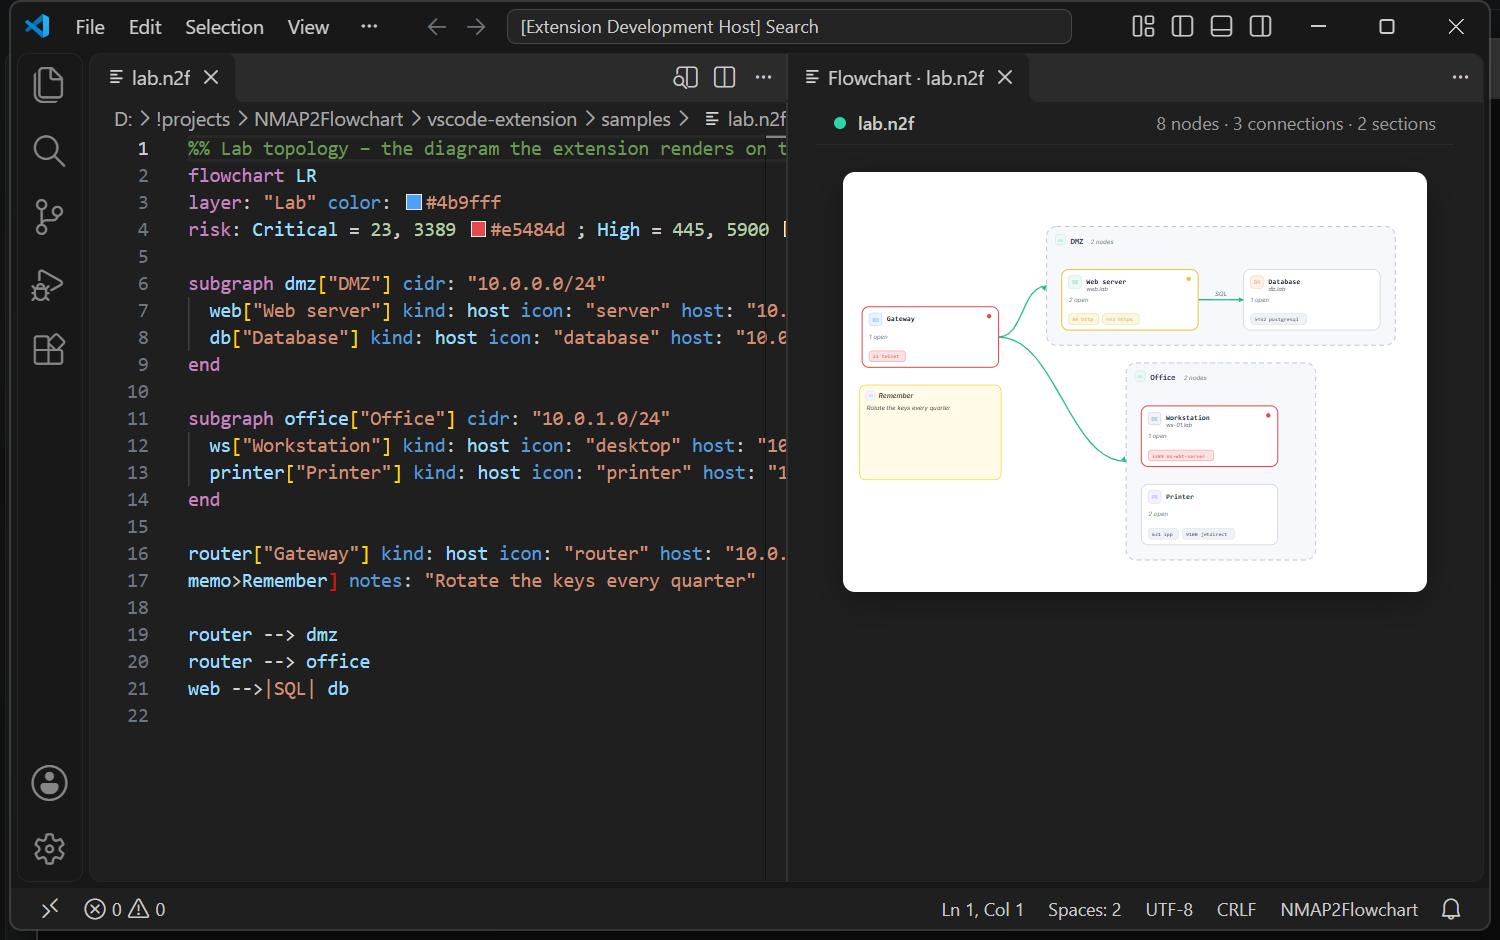
Open a .n2f file and the diagram is drawn beside it with the preview button in the editor title bar
(or NMAP2Flowchart: Open Flowchart Preview). It redraws as you type.
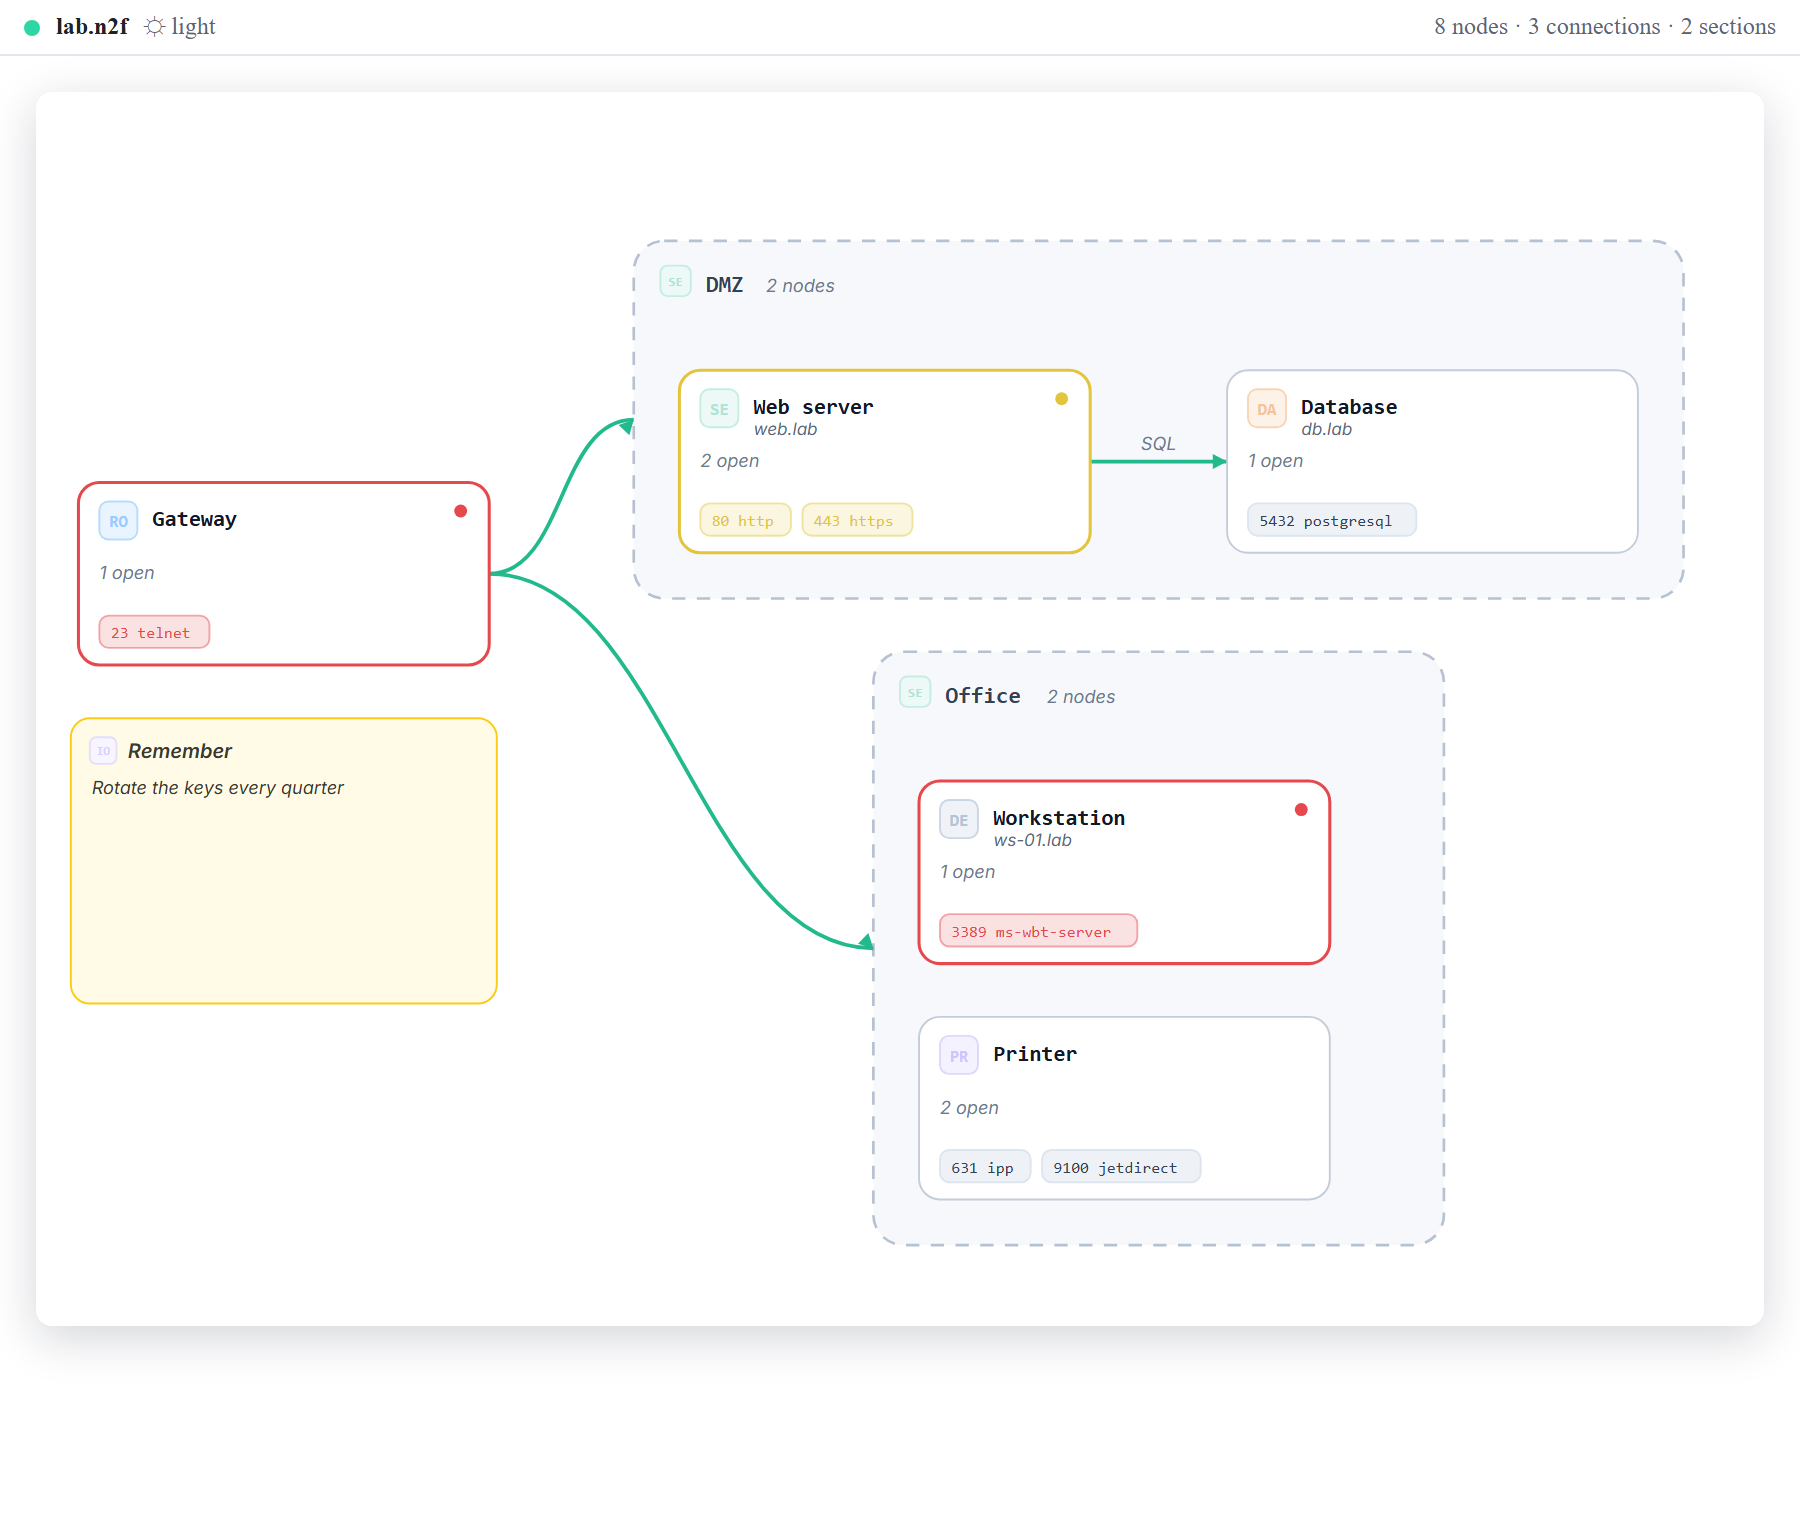
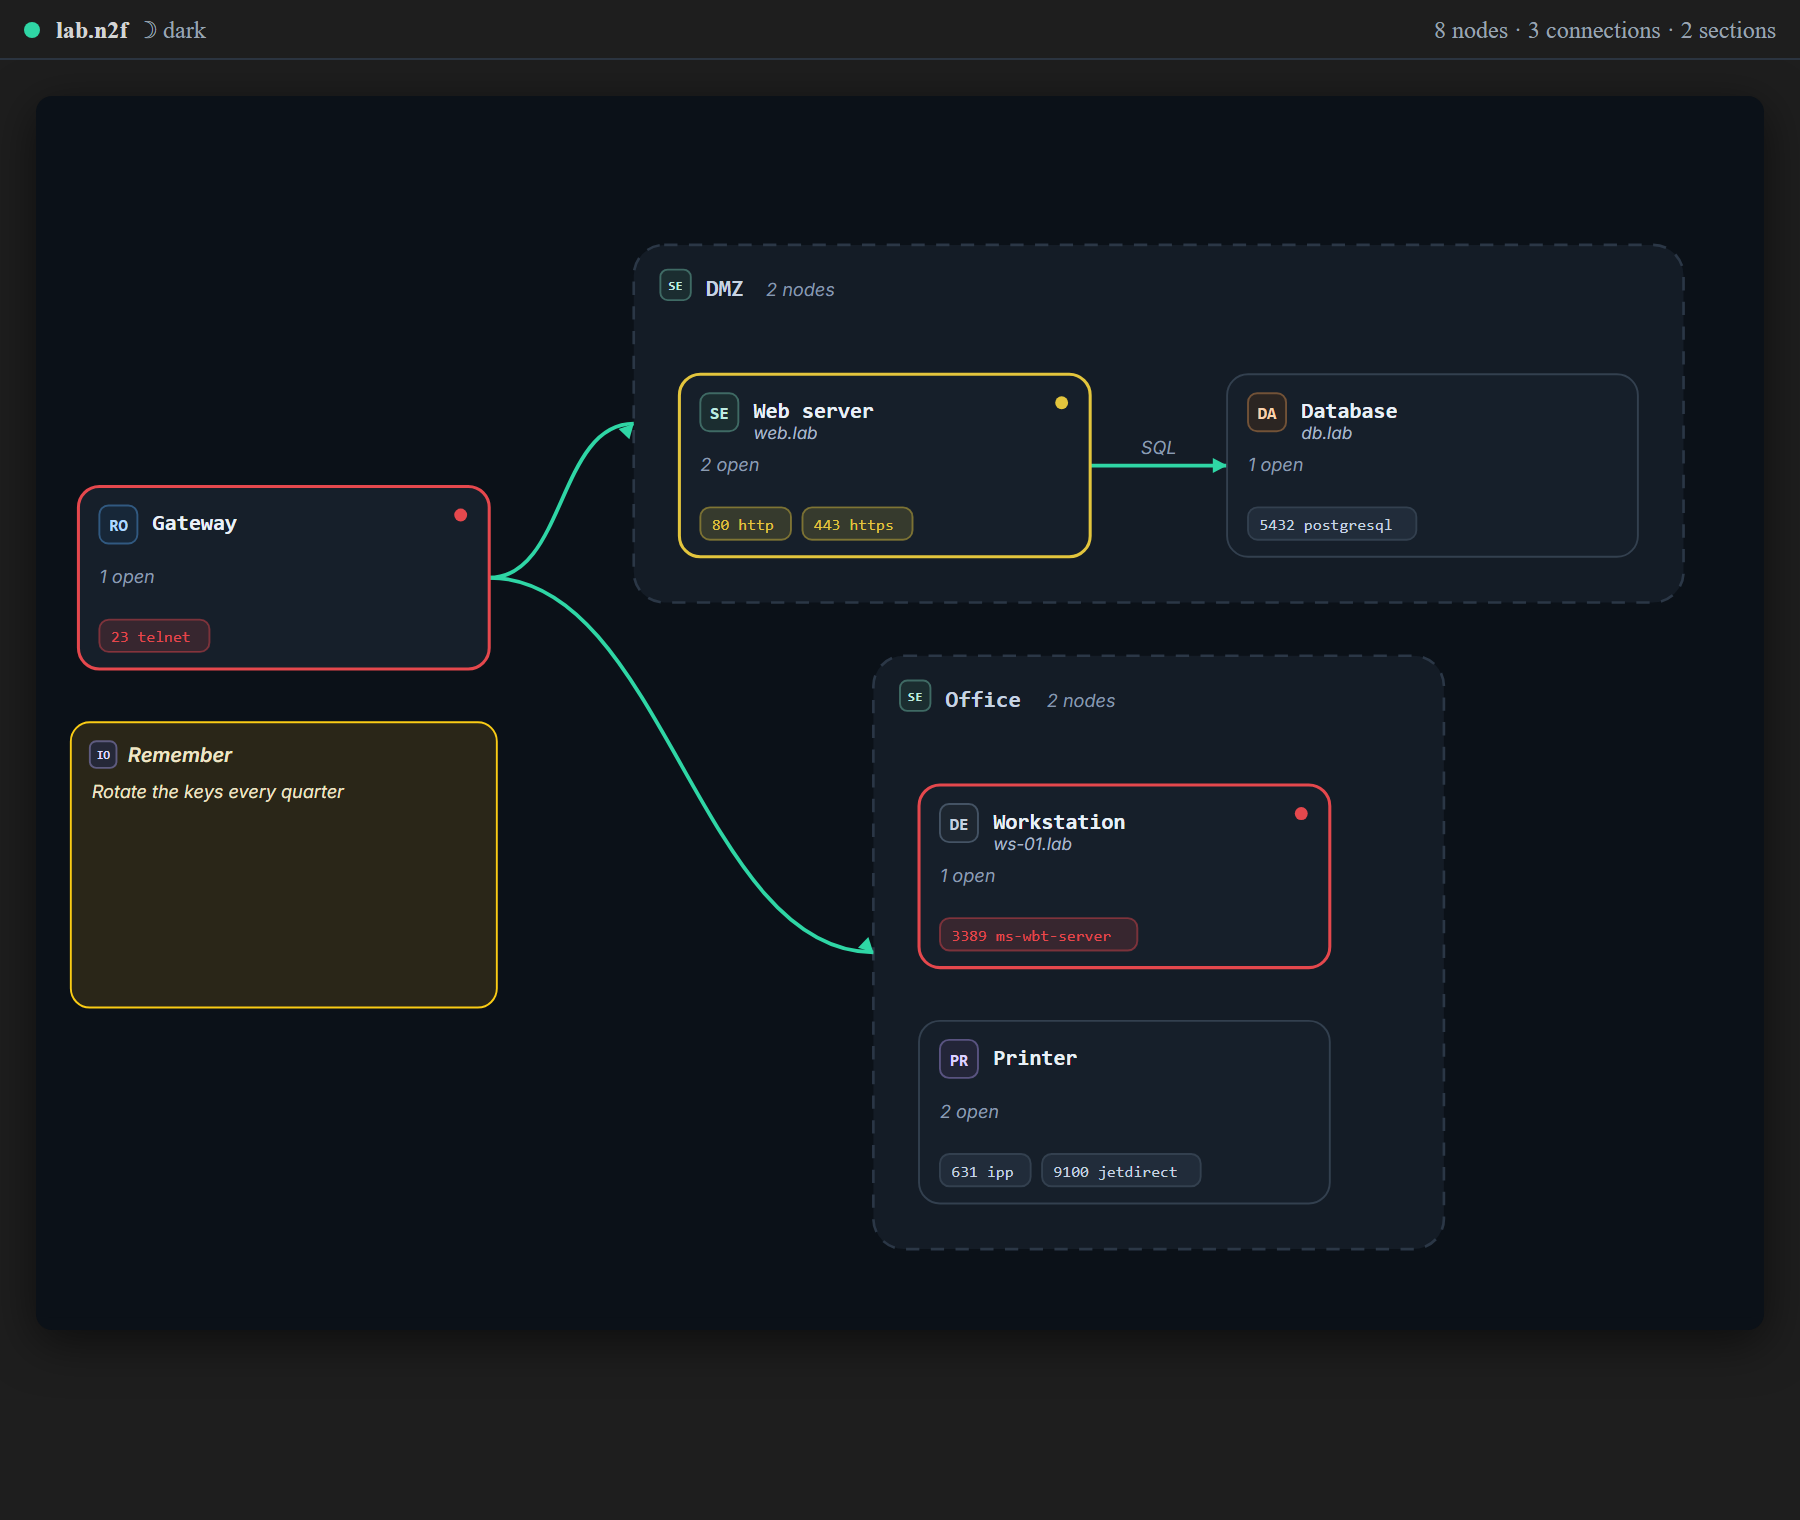
The picture follows your editor's colour theme, and the ☀/☾ title-bar button flips it:
| Light |
Dark |
 |
 |
What it does
- Import nmap scans – the ☁ button on a diagram's title bar (and on an open scan), or
NMAP2Flowchart: Import Nmap Scan (XML)… in the command palette, or right-click any
.xml in the
Explorer. nmap -oX output becomes editable diagram code and the picture opens beside it;
samples/scan.xml is a small scan to try it on.
- Syntax highlighting – directives, attribute names, strings, numbers, connection arrows, edge
labels and colours.
- Live preview – 250 ms after you stop typing, following whichever diagram is active.
- Light or dark –
auto follows the editor, or force either palette.
- Errors with a line number, and the last diagram that parsed stays on screen (dimmed) while you
fix a typo.
- Multi-line cards – an indented
key: value line continues the statement above it.
- Snippets –
header, host, section, note, edge, route, risk.
- Export SVG – the same picture in the light palette, ready for a wiki, a ticket or a print.
From a scan to a diagram
Run nmap -sS -sV -O -oX scan.xml 10.0.0.0/24, then NMAP2Flowchart: Import Nmap Scan (XML)… and
pick the file. samples/scan.xml arrives as:
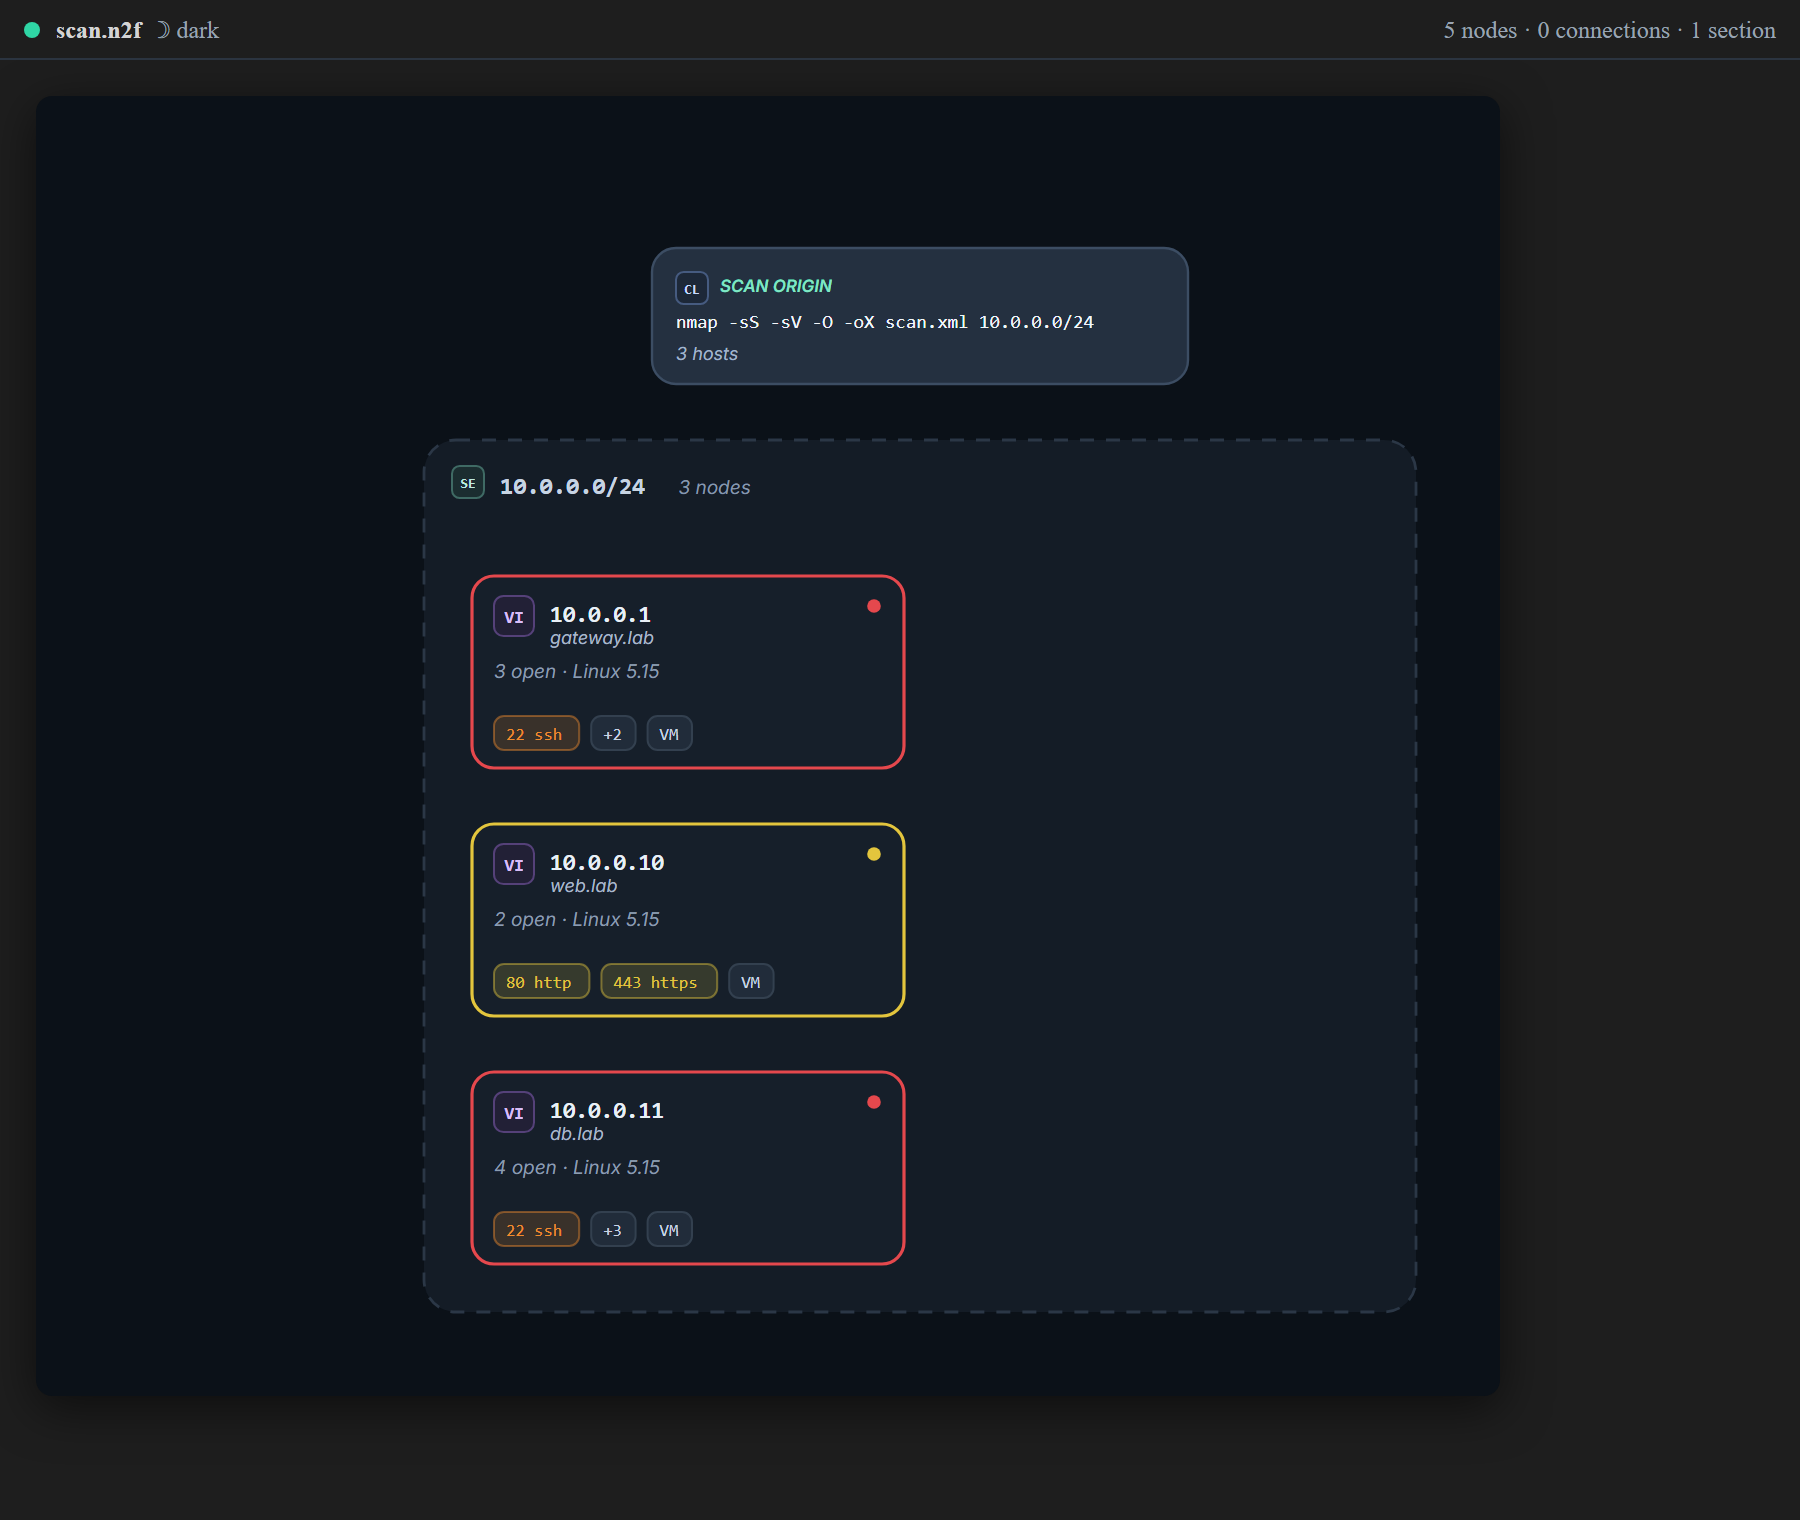
Addresses, hostnames, MAC vendors, OS guesses and port states all come across, and the built-in risk
levels colour the ports exactly as they do in the web app. The text is the diagram, so rename a card,
move it to another section or add a connection and the picture follows.
%% a comment
flowchart LR
layer: "Lab" color: #4b9fff
risk: Critical = 23, 3389 #e5484d ; High = 445 #f08c2e

subgraph dmz["DMZ"] cidr: "10.0.0.0/24"
  web["Web server"] kind: host host: "10.0.0.10" ports: "80/http, 443/https"
  db["Database"] kind: host host: "10.0.0.11" ports: "5432/postgresql"
end
web -->|SQL| db
A card with a lot of detail reads better spread over indented lines:
web["Web servers"] kind: host
  icon: "server"
  host: "10.0.0.10" hostname: "web.lab"
  ports: "80/http, 443/https"
# or %% starts a comment. Open samples/lab.n2f for a complete example, or
import samples/scan.xml to get one generated from a scan.
Commands and settings
|
|
| NMAP2Flowchart: Open Flowchart Preview |
the editor-title button; opens beside the editor |
| NMAP2Flowchart: Import Nmap Scan (XML)… |
the ☁ title-bar button; nmap -oX output in, an editable .n2f document out |
| NMAP2Flowchart: Toggle Dark Preview |
the ☀/☾ title-bar button; flips the palette and remembers it |
| NMAP2Flowchart: Export Diagram as SVG… |
save the picture as an SVG file (always the light palette) |
n2f.preview.autoOpen |
open the preview whenever a diagram becomes the active editor (default off) |
n2f.preview.theme |
auto (follow the editor), light or dark; the toggle writes this |
Install
Search NMAP2Flowchart in the Extensions view, or:
code --install-extension jonesckevin.nmap2flowchart
Install with file
Download from https://github.com/Jonesckevin/NMAP2Flowchart
code --install-extension nmap2flowchart.vsix
or use Extensions → ⋯ → Install from VSIX… in VS Code.
Development
cd vscode-extension
npm ci
npm run sync      # copy the parser, layout, renderer and scan reader from ../App/src
npm run verify    # sync:check + typecheck + bundle + tests
npm run package   # nmap2flowchart-<version>.vsix
Press F5 in this folder to run it in an Extension Development Host. src/core/app is
generated – edit App/src and run npm run sync; sync:check fails when the copy has drifted.
The extension compiles the same parser, layout and SVG writer as the
NMAP2Flowchart web app, so the preview always matches
what the app exports.
Licence: MIT.