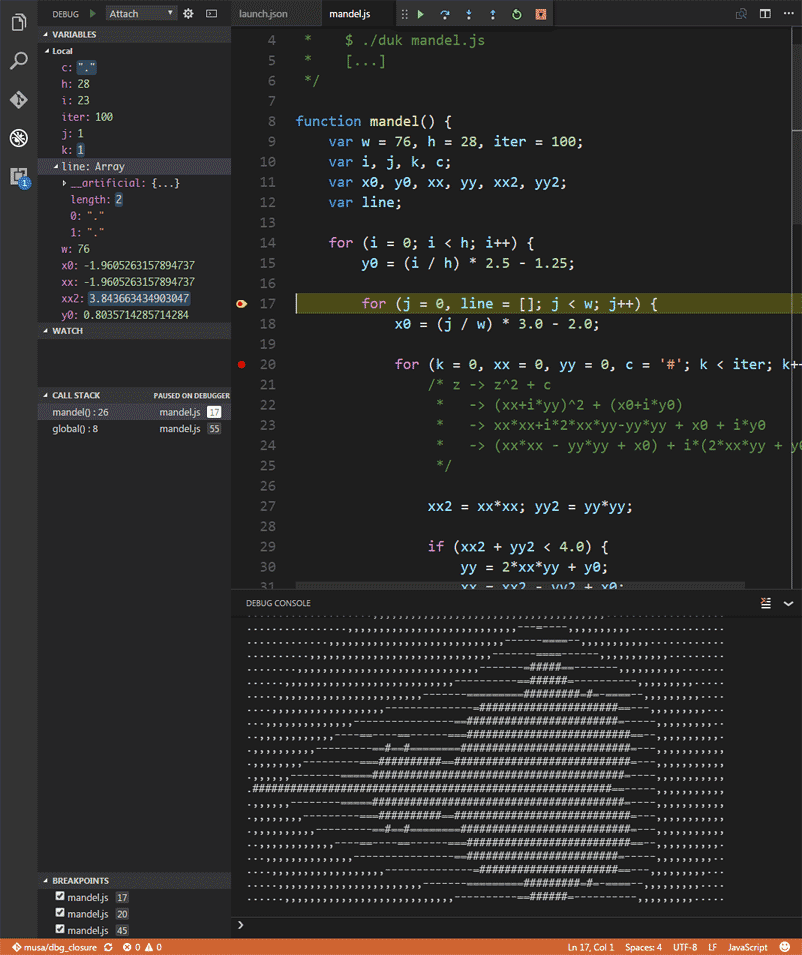
VSCode Debugger for DuktapeA Duktape debug client for Visual Studio Code. Supported Duktape Versions:
See (#references) below for more information.
Features
StatusIt works. I'd like to refactor the code and polish it more as I find the time. UsageCreate a new launch.json configuration file and configure the address and port to your debug server's listening address and port. ExampleDebug OptionsIf you'd like to see the network traffic exchanged between the client and server, set the following option in your launch.json configuration: Debug Host (Server) InstructionsFor the debugger client to work with your Duktape host application, you must enable the following preprocessor macros: For more information about the aforementioned options, see this entry on the Duktape wiki. You must also have a transport layer written in your Duktape host application to enable debugging via duk_debugger_attach() or duk_debugger_attach_custom(). You may use Duktape's reference implementation. For an example of an application with debugger support, please see Duktape's command line app. ContributingTo run and debug this extension locally, clone this repository load the folder in VSCode and then run the References
The adapter uses the debugger protocol for Duktape version 1.5+ of, Including v2.*+. See: debugger.rst. AcknoledgementsSpecial thanks to Sami Vaarala for developing Duktape, and for freely sharing it with the community. A "thank you" also to the VSCode team for facilitating their open-source IDE and the ability to easily make extensions for it. And finally, to those who has contributed to this project via bug reports or pull requests, thank you. This code contains portions borrowed or adapted from the vscode nodeJS debugger and Sami Vaarala's web-based nodeJS reference implementation of a Duktape debug client. License(c) Harold Brenes 2016-2017 Ἐμοὶ γὰρ, τὸ ζῆν Χριστὸς, καὶ τὸ ἀποθανεῖν, κέρδος. |


