HCL Z Abend Investigator
The HCL Z Abend Investigator extension for Microsoft Visual Studio Code works in conjunction
with the Zowe Explorer extension. HCL Z Abend Investigator helps developers
analyze and fix application and system failures.
When applications abnormally end (ABEND) it is crucial to understand the root-cause.
HCL Z Abend Investigator can discover ABENDs faster, more confidently, and in less time
by automatically harvesting real-time information of the ABEND and its environment at the time of failure.
General requirements
- Assumes knowledge of HCL Z Abend Investigator product installation and features
- The Z Abend Investigator VS Code extension connectivity to the host is similar to using
the Z Common Components (ZCC) server
- Assumes knowledge of how to install and configure the Z Common Components server
- ZCC must use the AT-TLS feature when configuring TLS support
VS Code extension requirements
- VS Code
1.101.0+
- Zowe Explorer
3.2.0+
- Assumes that the user has knowledge of the Zowe Explorer extension before using the Z Abend Investigator extension
Optional VS Code extensions
- IBM Z® Open Editor
- Provides color coded sources when viewing side files in fault reports
- Provides color coded job spool data sets
Host requirements
Supported charsets
The extension supports resources in both English (IBM1047) and Japanese (IBM939).
Use the Z Abend Investigator > Language setting to configure the global resource language.
Features
The current version of the Z Abend Investigator extension does not support the full
functionality of the ISPF Z Abend Investigator client, or of the Eclipse Z Abend Investigator client.
Itemized below are the features supported and not supported in broad terms.
History files
- Open history files in a separate view
- Customize visible columns in the history files view
- Filter visible fault reports using individual column filters
- Add history files to the Z Abend Investigator tree view:
- From the Zowe Data Sets tree view
- From the Z Abend Investigator tree view
- From the Command Palette
- Remove history files from the Z Abend Investigator tree view
Fault reports
- Reanalyze and show fault reports in a separate view:
- From the history file view's context menu, or by clicking on a fault entry reference
- From a job context menu in the Zowe Jobs tree view
- From a job JESMSGLG editor as hyperlinks, and from the context menu
- From the Command Palette
- Navigate to sections of the report:
- Event Detail hyperlinks to jump to a specific event
- Source code hyperlinks to open a source file at a specific line
Z Common Components connections
- Associate a Z Common Components connection with a Zowe Profile
- Remove the association between a Z Common Components connection and a Zowe profile
Unsupported features
- Trust manager for certificates used when connecting to the Z Common Components server
History files
- Add default and recent history files
- Copy/Rename/Remove fault entries from the history file
- Choose column ordering
- View fault entry properties
Fault reports
- Side files:
- IDITrace logs
- JCL for the job causing the ABEND
- Minidump
- Hyperlinks:
- Lookup view links for viewing ABEND explanations
- Memory links jumping to minidump
- CICS links
Views
- Add view
- Create view
- Show and navigate views
Fault analytics
- Manage and display charts
Getting started
Configuring the Z Common Components connection
Before you begin, all the above requirements must be fulfilled.
- Open VS Code
- If necessary, create at least one Zowe profile: team configuration profile or v1 profile (deprecated)
- Switch to the Zowe Explorer tool window
- Right-click on the profile that matches the z/OS subsystem your Z Common Components server is running on
- From the Z Common Components menu item, choose Configure connection
- Enter the connection information for the Z Common Components server
You are now ready to use the Z Abend Investigator VS Code extension.
NOTE: if you access a Z Abend Investigator feature before configuring the ZCC connection,
you will be prompted to specify the required information the first time only.
The Z Abend Investigator tree
When the Zowe Explorer tool window is selected in VS Code, the tool window has three tree views by default:
Data Sets, Unix System Services, and Jobs.
The Z Abend Investigator extension adds a Z Abend Investigator tree view as well to manage the history files that have been added.
When a Z Common Components connection is associated with a profile, that connection will be displayed in the
Z Abend Investigator tree view.

Tree structure
Connection nodes
There will be one root node representing each host and port of a Z Common Components connection.
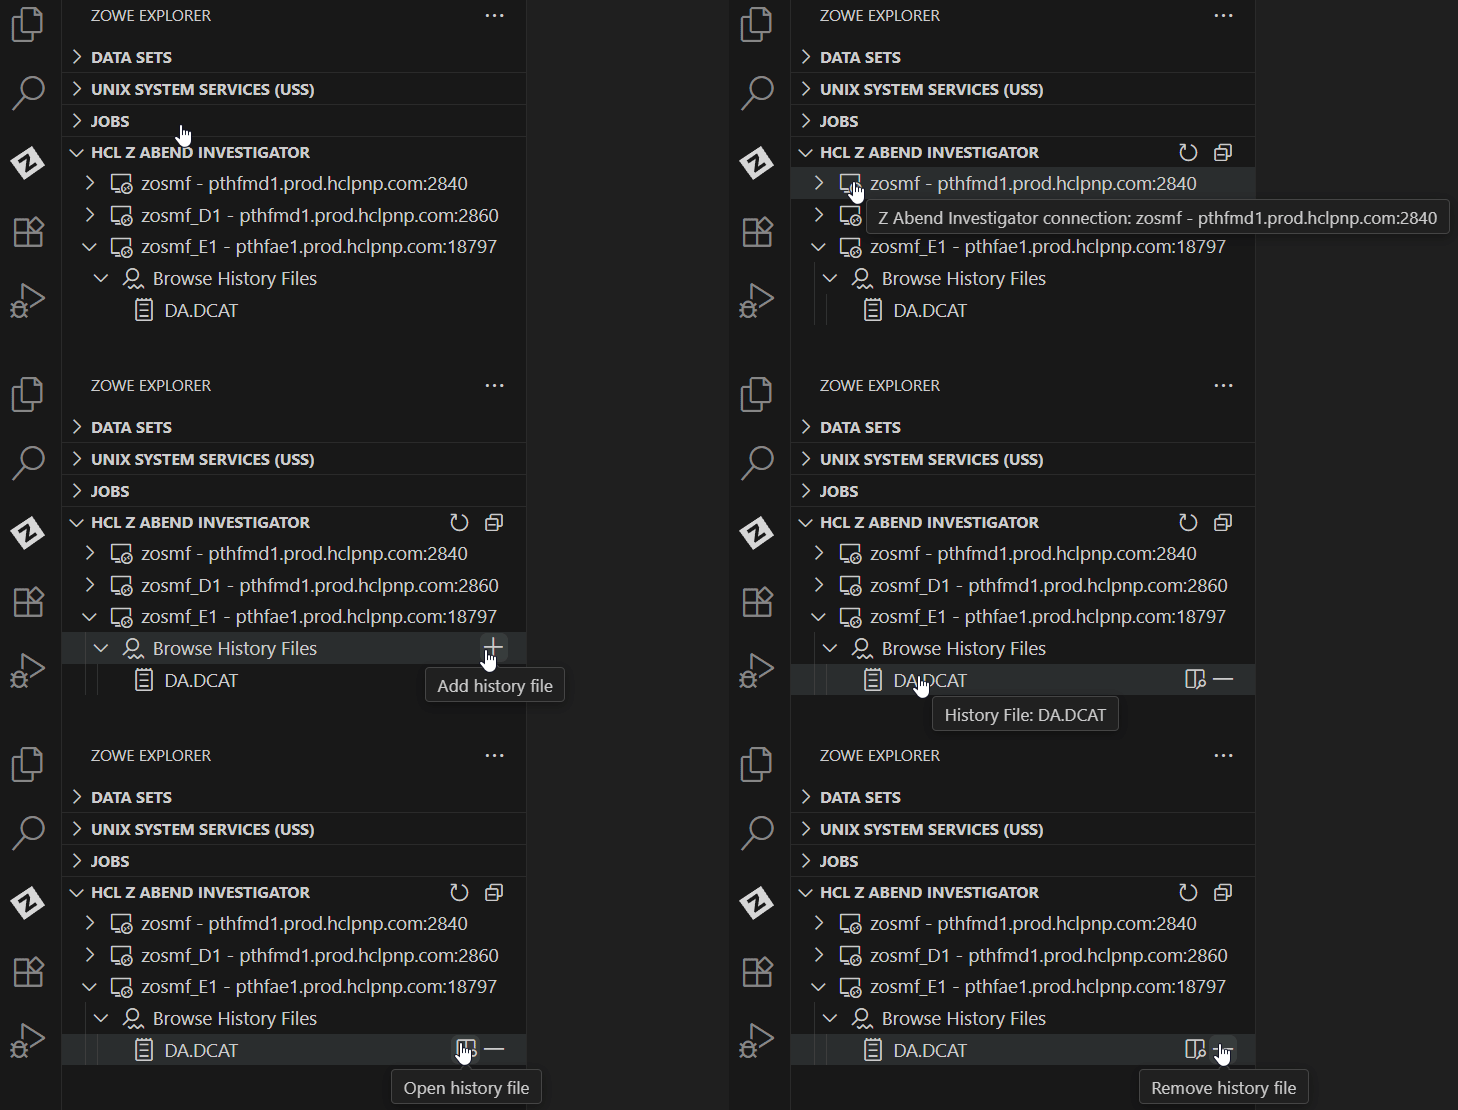
Browse History Files nodes
These are the parent nodes of any history file that have been added for the connection.
- The Add history file inline button (or context menu item) prompts for a data set name
for a new history file to open and add to the tree
History file nodes
These are nodes representing a history file that has already been added.
- The Open History File inline button (or context menu item) opens the history file or reveals it if already open
- The Remove History File inline button (or context menu item) removes the history file from the Z Abend Investigator tree
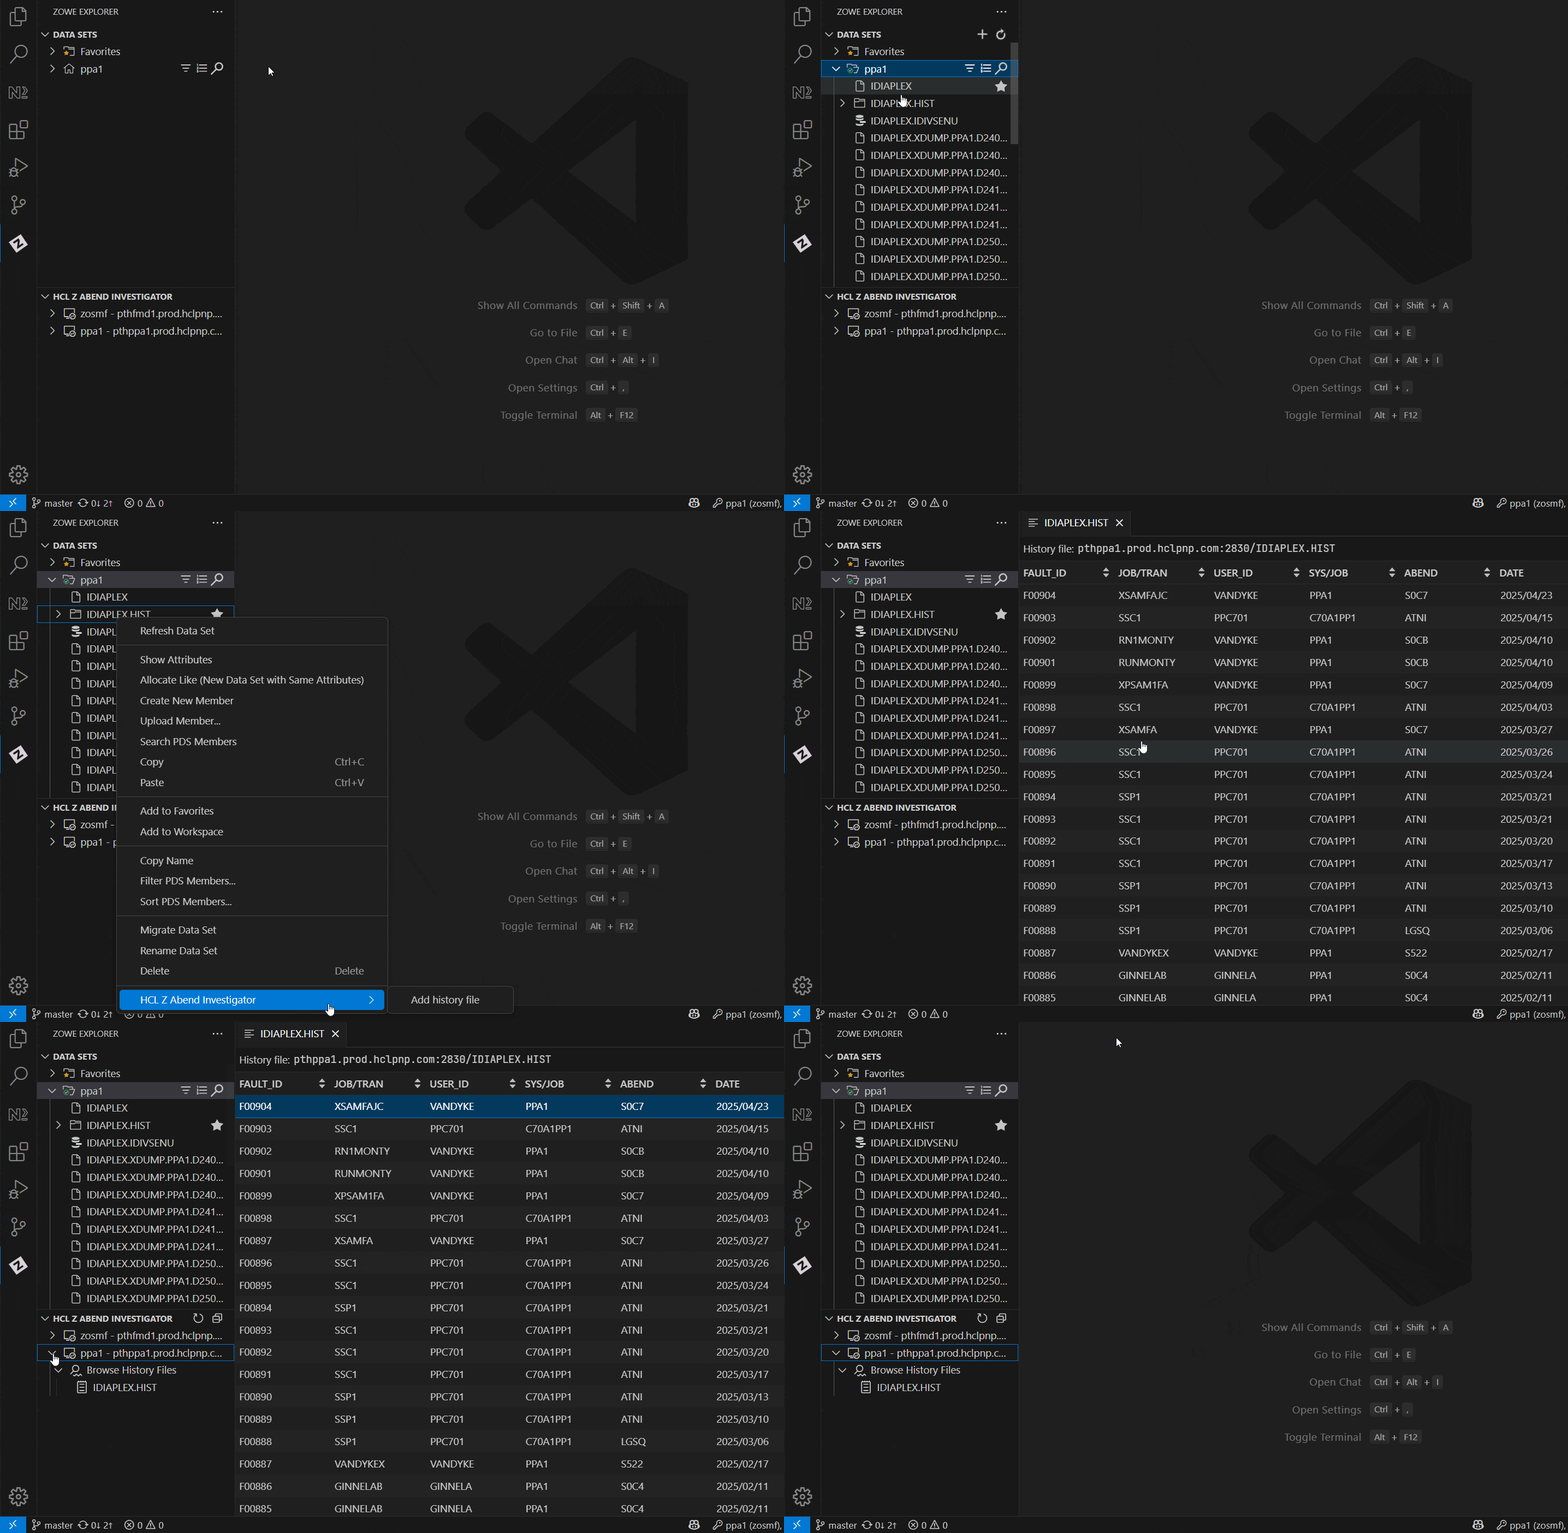
Adding history files from the Zowe Explorer Data Sets tree
History Files can also be added from the Zowe Explorer Data Sets tree:
- From a profile in the Zowe Explorer Data Sets tree, select its Search Data Sets inline button or context menu item
- Select an existing filter or create a new filter that will show the history file that you want to open and add to the
Z Abend Investigator tree
- From the context menu, select Z Abend Investigator > Add history file
- If a Z Common Components connection has not been specified for this profile, the required information
will be prompted for and a new connection will be created in the Z Abend Investigator tree
- The history file will be added to the Z Abend Investigator tree if it does not already exist in the tree, and will be
opened in a new tab

Viewing fault reports from a history file
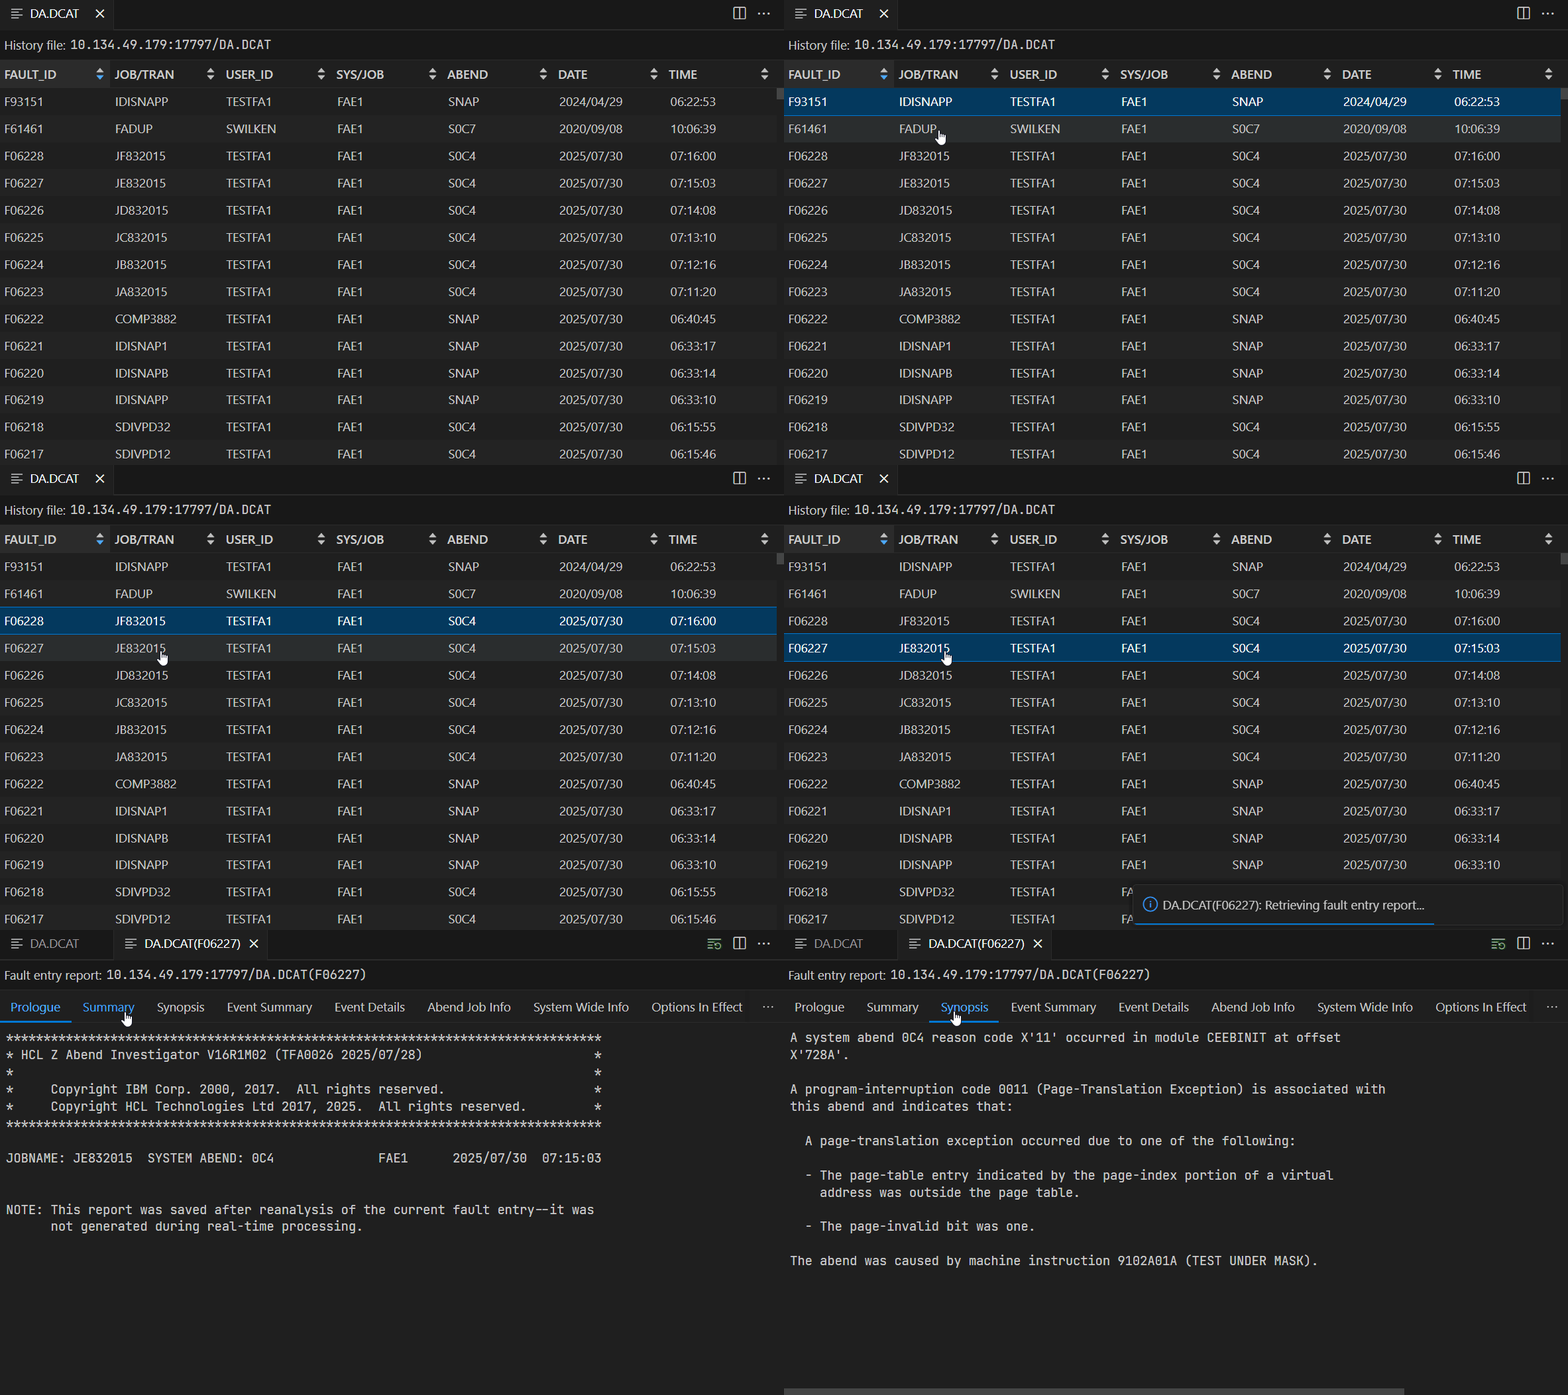
Once a history file has been added to the Z Abend Investigator tree, it can be displayed by clicking on it in the tree.
Once the history file is displayed, you can open a fault report by double-clicking on a fault entry row.
An additional path to achieve the same result is to open the context menu over a fault entry row, and select Reanalyze.

Viewing fault reports from the Zowe Explorer Jobs tree
When jobs that have generated one or more ABEND are viewed from the Zowe Explorer Jobs tree,
you will be able to view the fault report in multiple ways.
From the Jobs tree node
Right-click on the job that completed with an ABEND
Select Z Abend Investigator > Open Fault Report
NOTE: if there is more than one ABEND in the job, you will be prompted
to select which fault report you want to open
From a job JESMSGLG output data set (hyperlinks)
- Expand the tree node for the job that completed with an ABEND
- Click on the JES2:JESMSGLG output data set to open it
- Hyperlinks will be displayed for each ABEND that occurred.
Ctrl-clicking a hyperlink will open the fault report associated with the ABEND
- Expand the tree node for the job that completed with an ABEND
- Click on the JES2:JESMSGLG output data set to open it
- Open the editor context menu, and select Open Fault Report
Z Abend Investigator commands
The Z Abend Investigator extension adds new commands to the VS Code Command Palette.
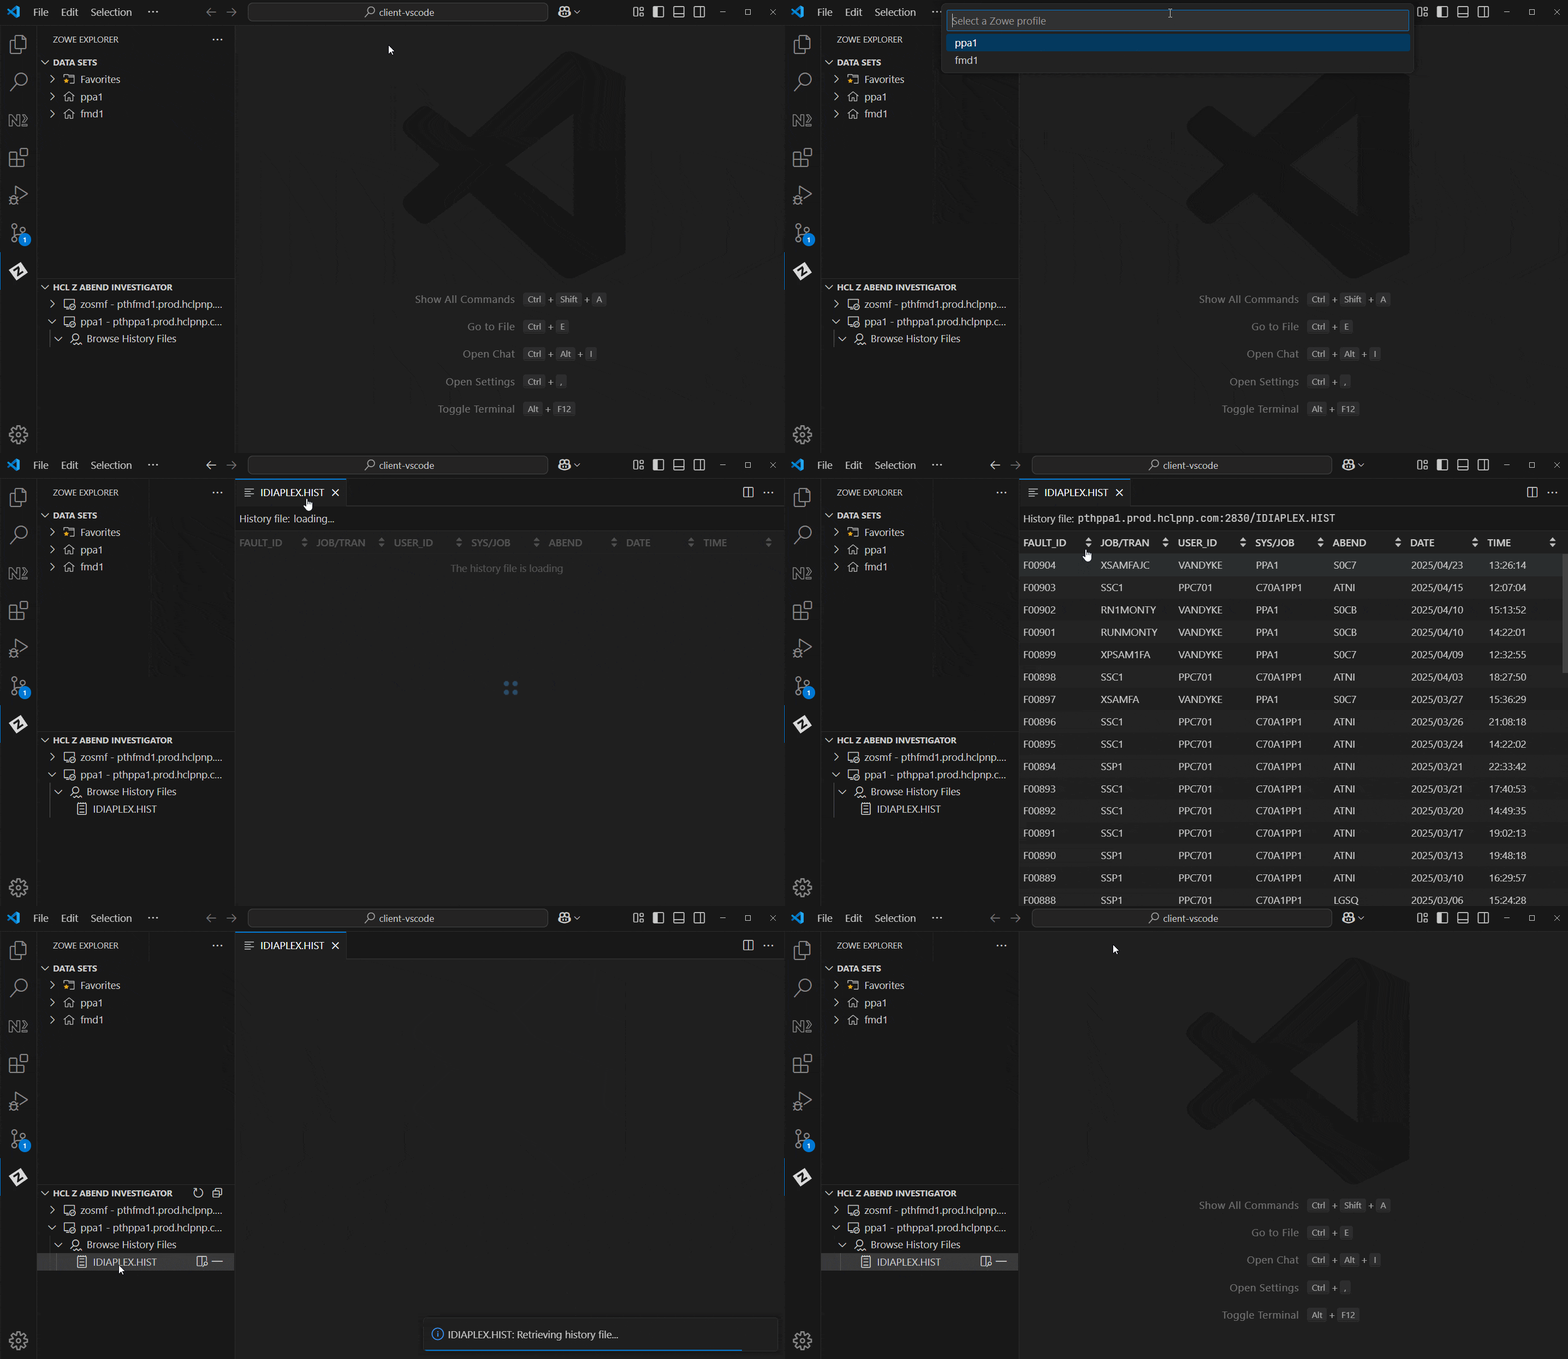
Add history file
Adds a history file to the Z Abend Investigator tree in the Zowe Explorer tool window.
You will be prompted for:
- A Zowe profile, if there is more than one defined, with an associated Z Common Components connection
- A data set name for the history file you want to open and add to the Z Abend Investigator tree

Open fault report
Performs reanalysis on a fault report and opens that report.
You will be prompted for:
- A Zowe profile, if there is more than one defined, with an associated Z Common Components connection
- The data set name for the history file containing the fault entry you want to reanalyze and open
- The fault entry ID for the report you want to reanalyze and open

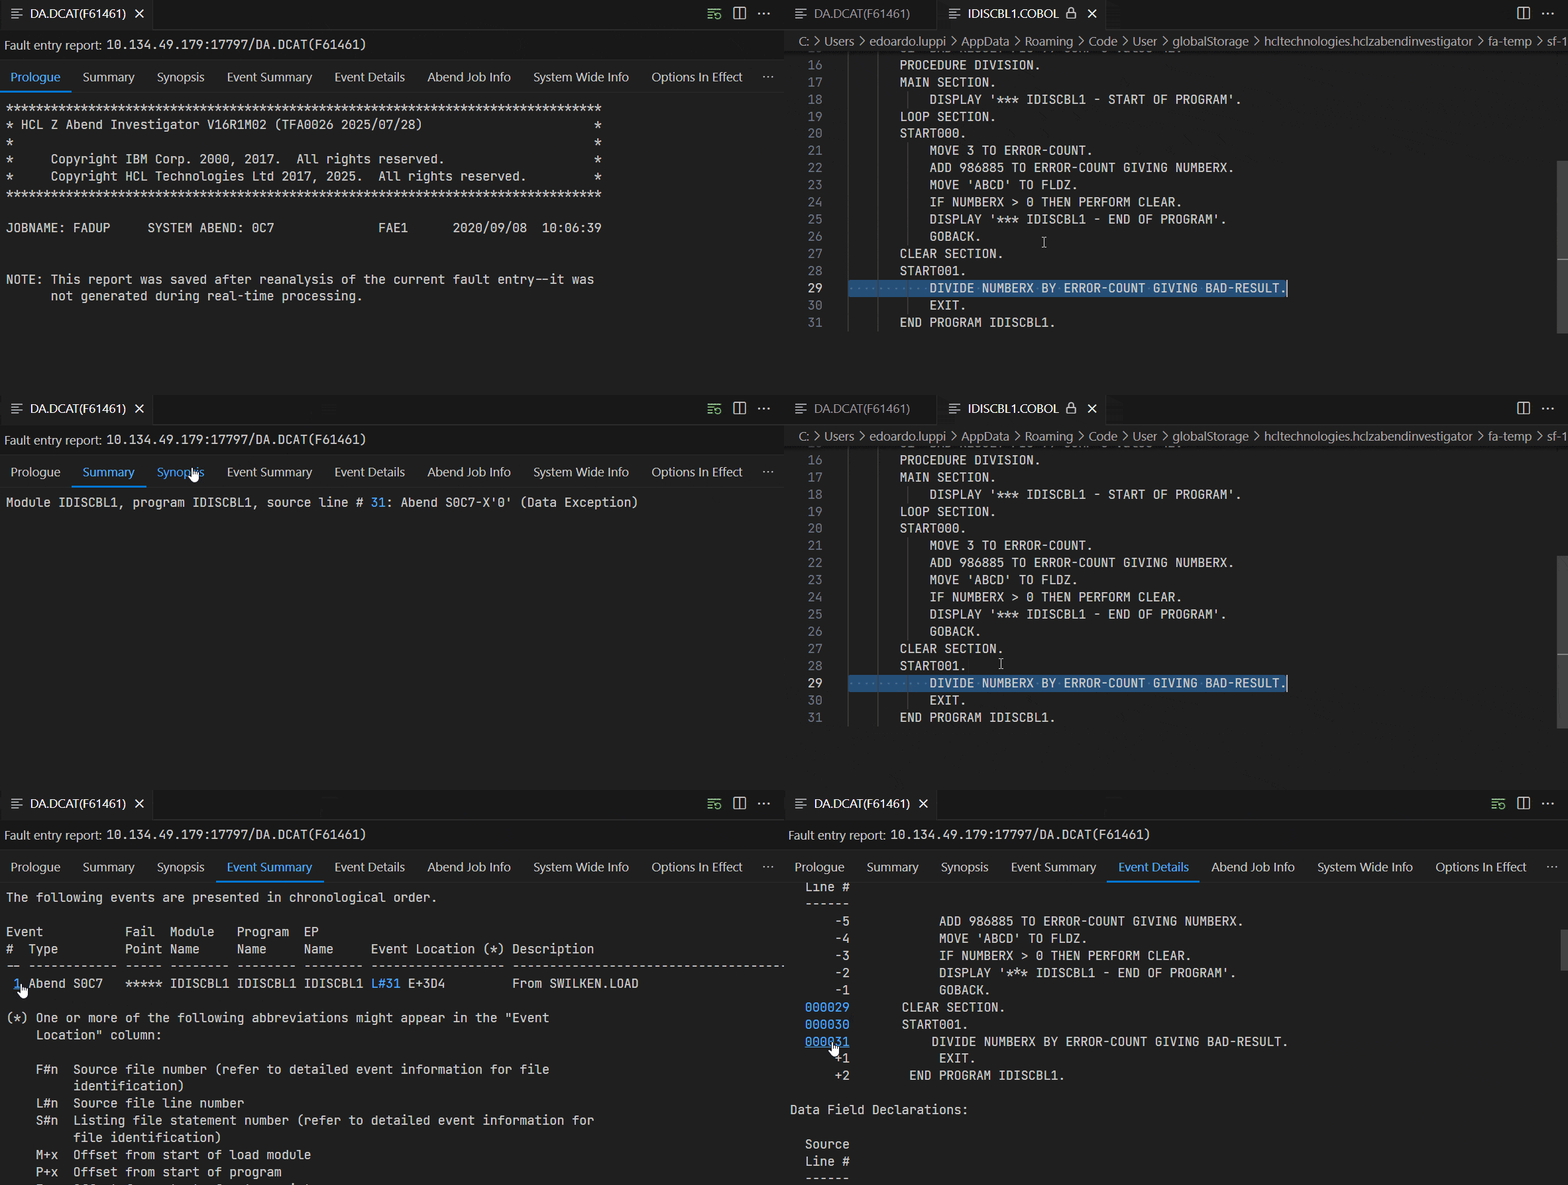
Overview of the Fault Report view
The Fault Report view is a collection of tabs that enable the user to view different sections of the report.
Some sections have hyperlinks that will open source files at a specific line number.
The Event Details section displays event hyperlinks to jump to the definition of the event in another section.
The layout is similar to the Fault Reports view in the Z Abend Investigator Eclipse client.

Getting Help
To ask questions or report issues related to the installation, configuration,
or use of this extension, please contact HCL Support.
Zowe Explorer Issues
Because this extension depends on Zowe Explorer, some issues may originate from
core Zowe Explorer functionality. Examples include:
- Data Set and USS file browsing
- Job management and submission
- Base Zowe Explorer commands and views
Issues specific to Zowe Explorer should be reported to its issue tracker.
Determining the source of an issue and choosing the appropriate reporting channel is
generally straightforward: error notifications include the extension name, and log
entries displayed in the Output view are categorized by extension.


