C Call Hierarchy & ReferencesC/C++ call hierarchy (toggle callers / callees) and read/write find-references — works with clangd (recommended) or Microsoft C/C++. Installation Launch VS Code Quick Open ( Ctrl+P), paste the following command, and press enter.Copied to clipboard |
C Call Hierarchy & ReferencesSee who calls what and who reads vs writes a symbol in C/C++ — powered by your C/C++ language server — clangd (recommended) or Microsoft C/C++.
clangd already knows your code. C Call Hierarchy & References re-presents what it knows the way you actually want it: callers and callees at once, references split into reads vs writes, and third-party noise filtered out — without leaving the sidebar.
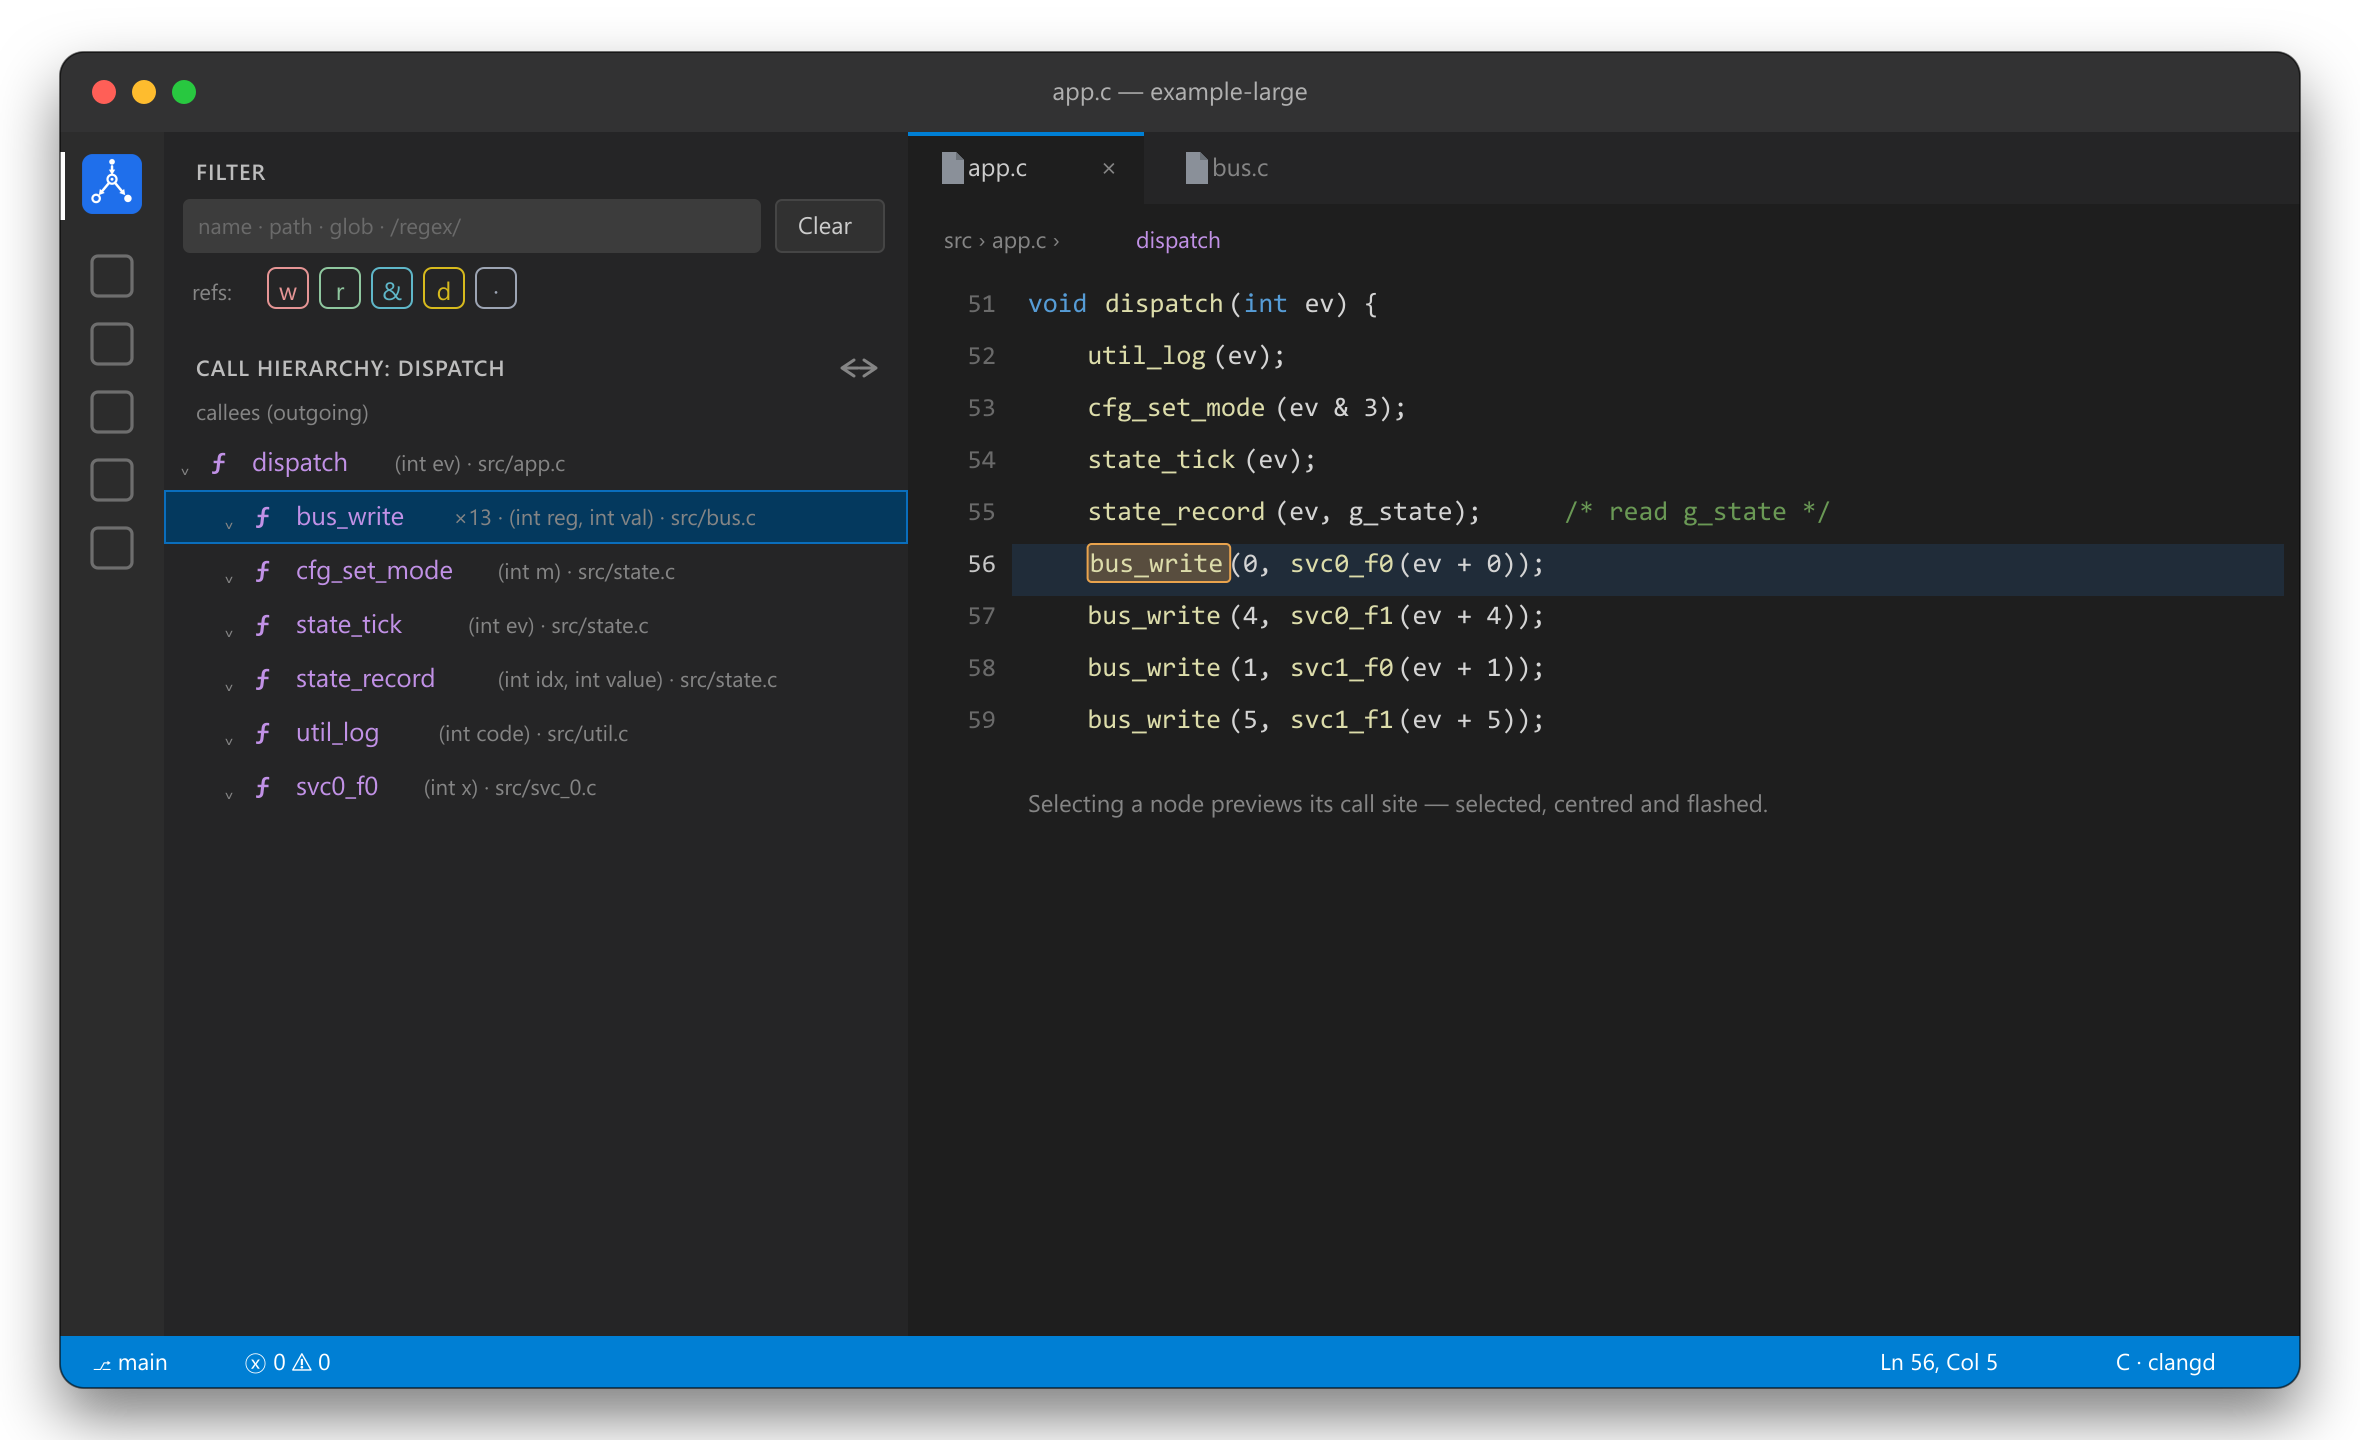
✨ FeaturesCall hierarchy — incoming or outgoingPut the cursor on a function and run Show call hierarchy. The tree shows callers (incoming) or callees (outgoing) — flip between them with the toggle in the view title. Nodes show the function's parameter types, a ×N badge when clangd merges several call sites into one, and are cycle-safe and depth-capped. Selecting a node previews the call site — selected, centered and briefly flashed — while focus stays in the tree, so you can keep arrowing up and down the hierarchy. On a ×N node (several merged call sites) you can step through the sites two ways without leaving the tree: press Enter repeatedly to preview each in turn (wrapping around), or re-click the inline Open in editor action to open each for real. Either way the walk is per-node — arrow to another function and Enter/Open acts on that node, never the previous one. The inline Open in editor action also moves focus to the editor. Find references — read vs write
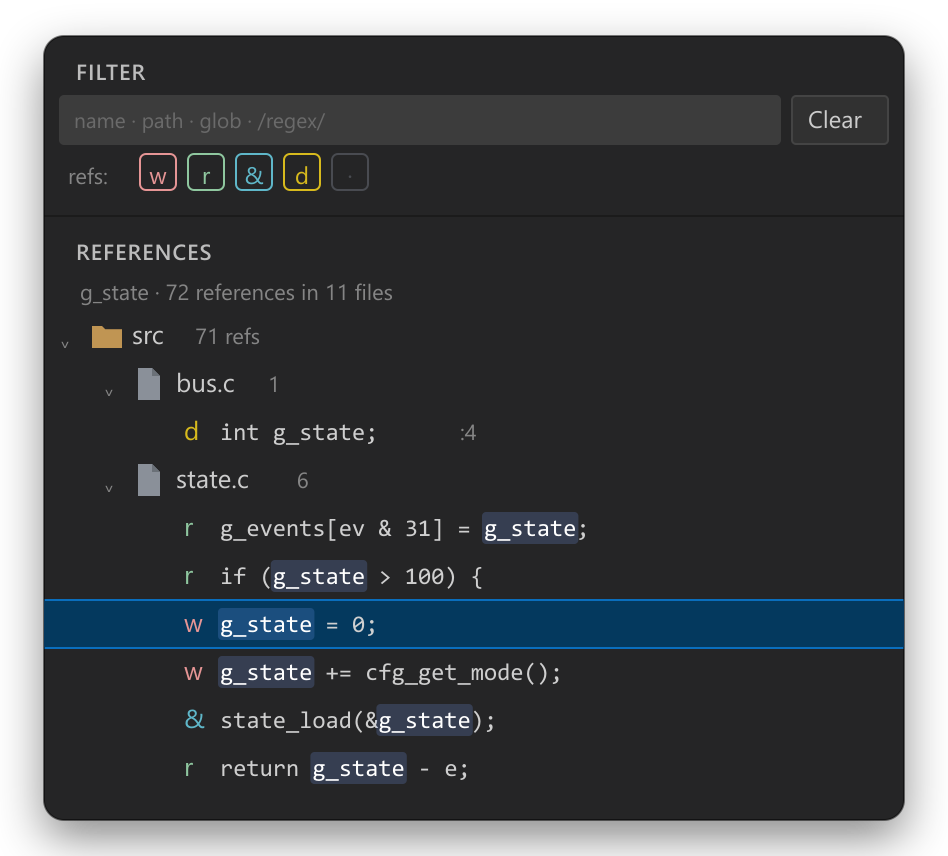
Find references opens a dedicated tree where every occurrence is badged:
Group by folder or flat by file, toggle which kinds show with the w r d · chips, and the
matched symbol is highlighted on each line. Read/write comes from clangd's One filter for everythingA fixed Filter pane at the top searches by function name or path across both views, live:
Matches are also highlighted in the call tree — the part of the function name (or, when the query matches the path, the path shown next to the name) is tinted, so it's clear at a glance why a node is shown. ✅ Requirements
🚀 Getting started
⚙️ Settings
🧠 How it worksFor call hierarchy, references and signatures the extension calls VS Code's built-in provider commands
( ❓ FAQNothing shows up. Make sure your C/C++ provider (clangd or Microsoft C/C++) is installed, active, and has finished indexing — clangd gives the most accurate read/write classification. Read/write looks wrong. Read/write is recovered from clangd's highlight roles; if another provider answers without roles, a syntactic fallback kicks in. Globals/struct fields are the clearest demo. Both callers and callees are shown — can I get only one? Expand just the branch you care about; the other stays collapsed. 🛠️ DevelopPress F5 to launch an Extension Development Host with the bundled 📄 LicenseMIT © Halis Taha Sahin |