Skip to content
| Marketplace
Sign in
Visual Studio Code>Data Science>CSV StatsNew to Visual Studio Code? Get it now.
CSV Stats

CSV Stats

Gabriel Capelli

|
1 install
| (0) | Free
A statistical overview of CSV files inside the editor, a simplified take on Data Wrangler.
Installation
Launch VS Code Quick Open (Ctrl+P), paste the following command, and press enter.
Copied to clipboard
More Info

CSV Stats — VS Code extension

A statistical overview of CSV files, right inside the editor.

Right-click a .csv file in the explorer → Open in CSV Stats.

The interface is in English, numbers included: comma thousands separator and decimal point. The table itself shows the cells exactly as they are written in the file.

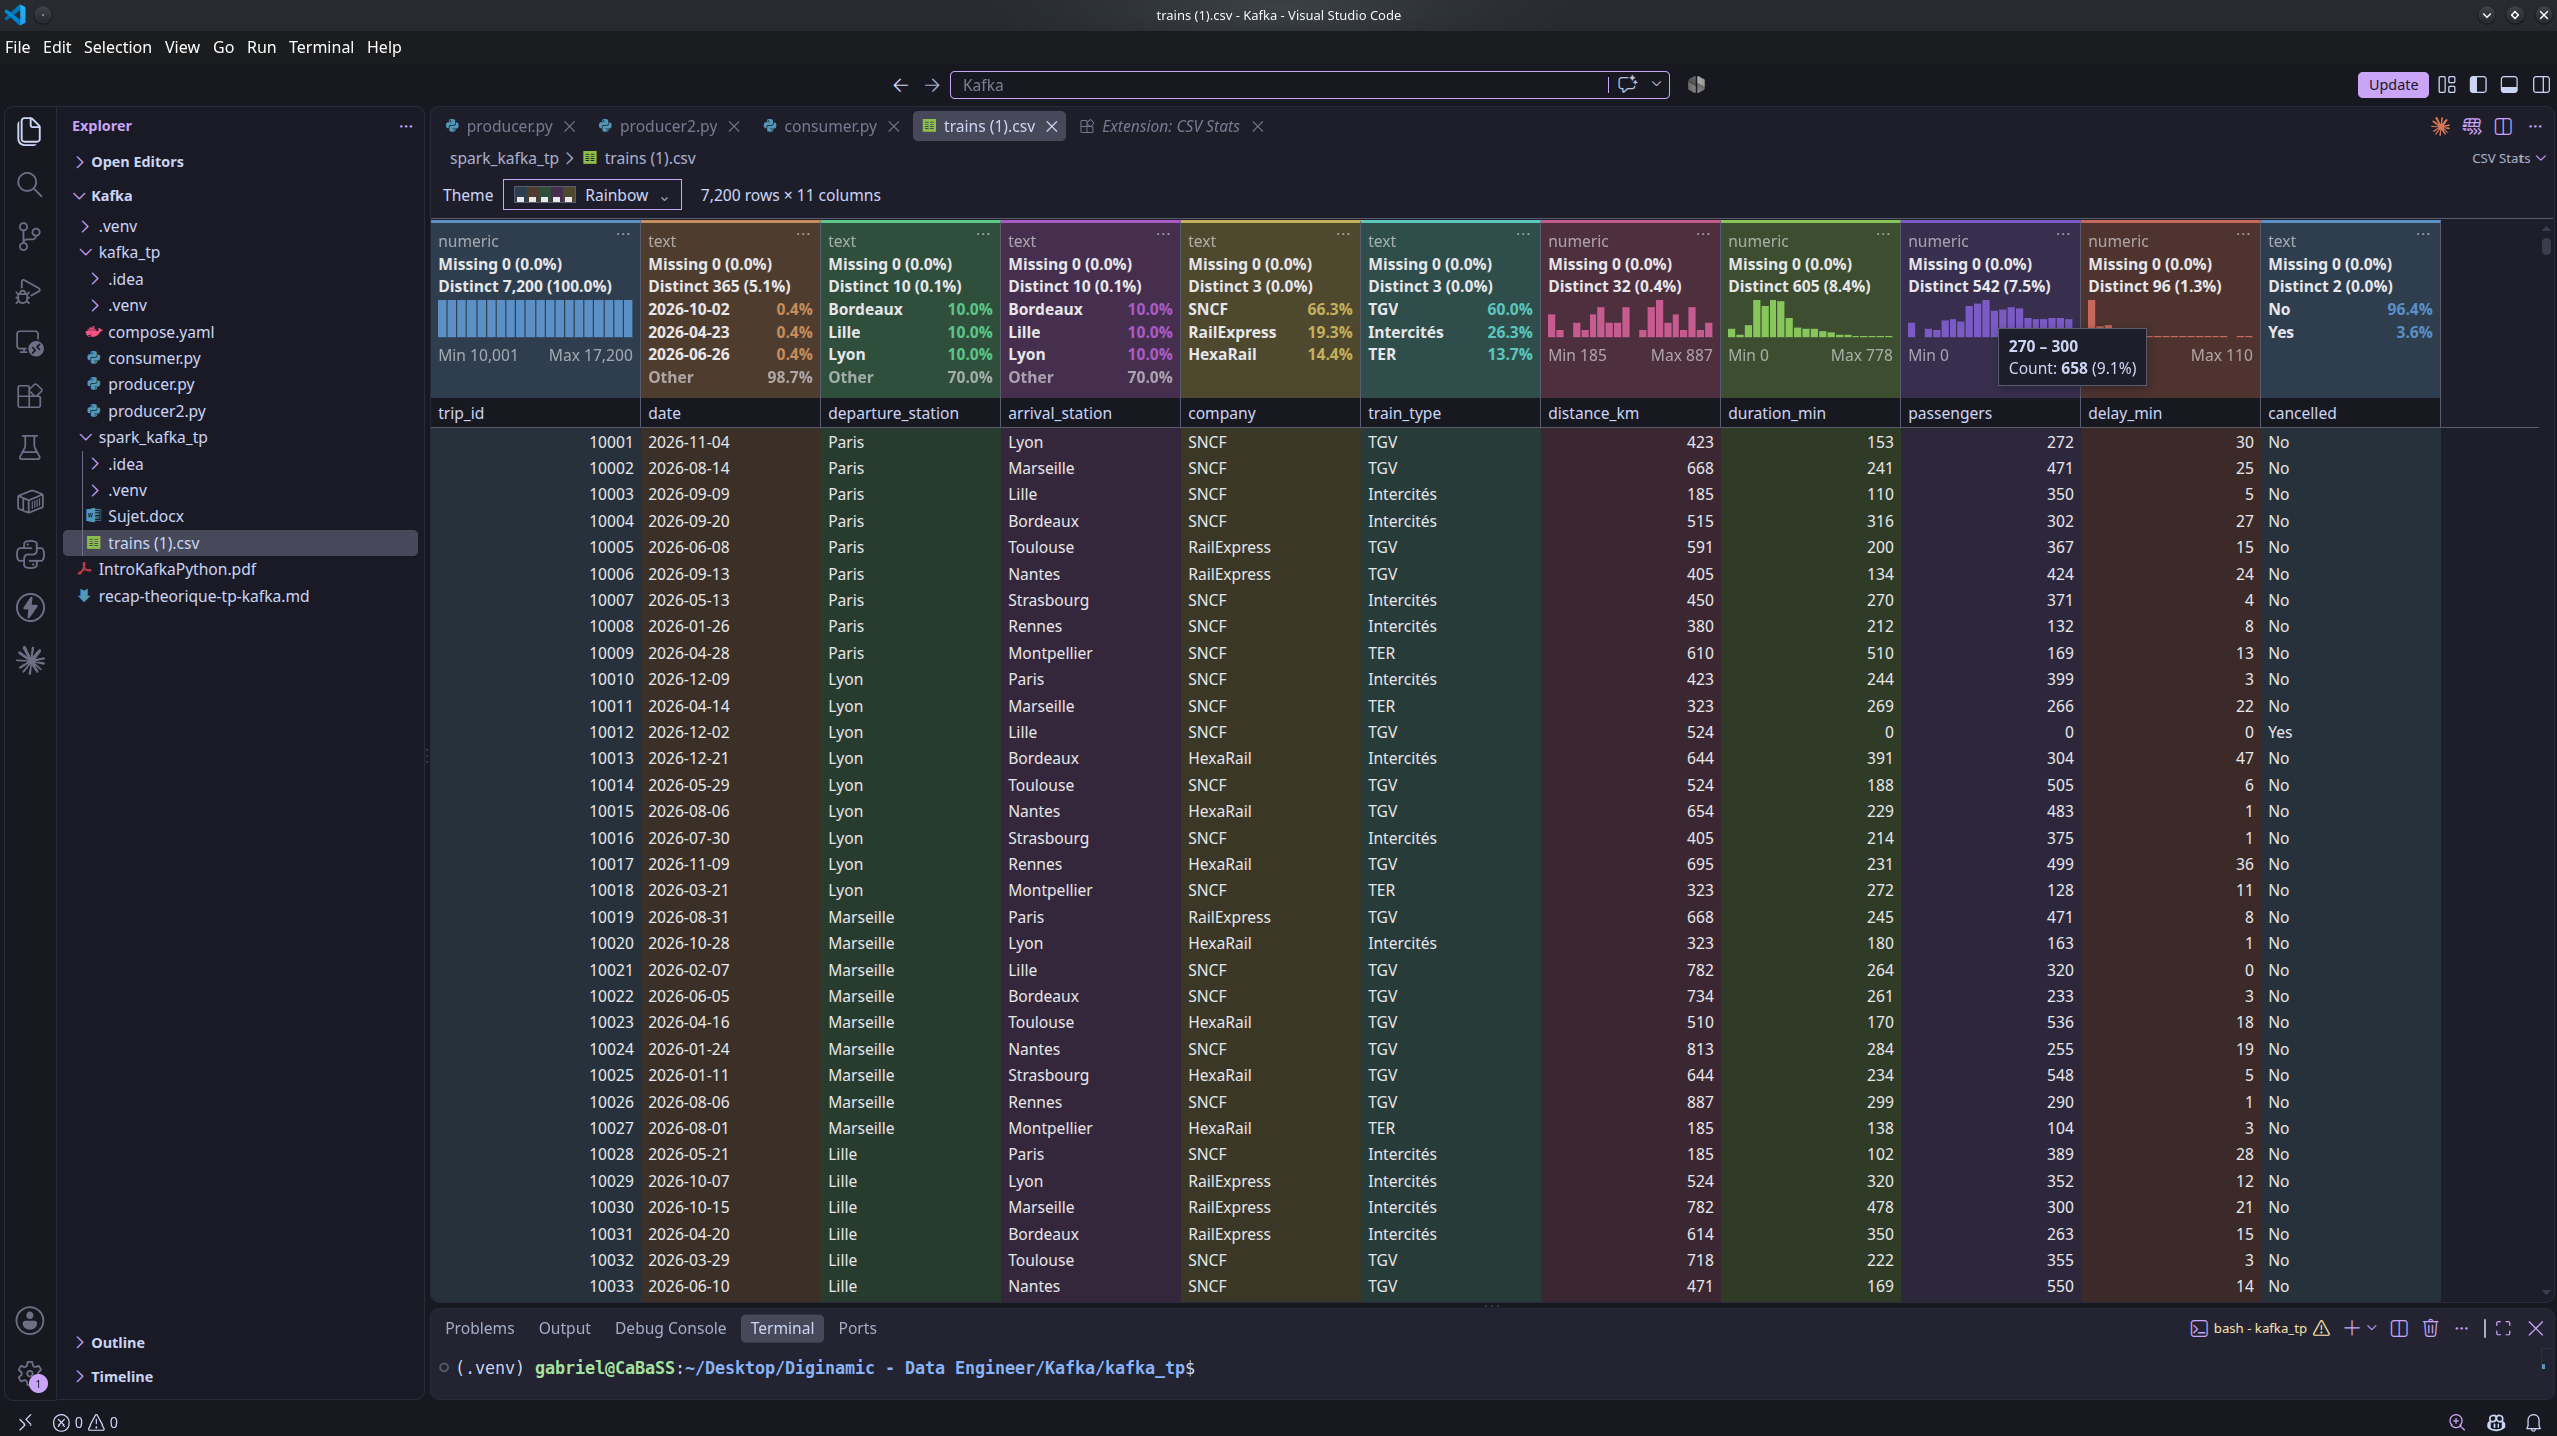
The stats band over a 7,200-row file, Rainbow palette, with a histogram tooltip

Hovering a histogram bar gives that bin's range and count.

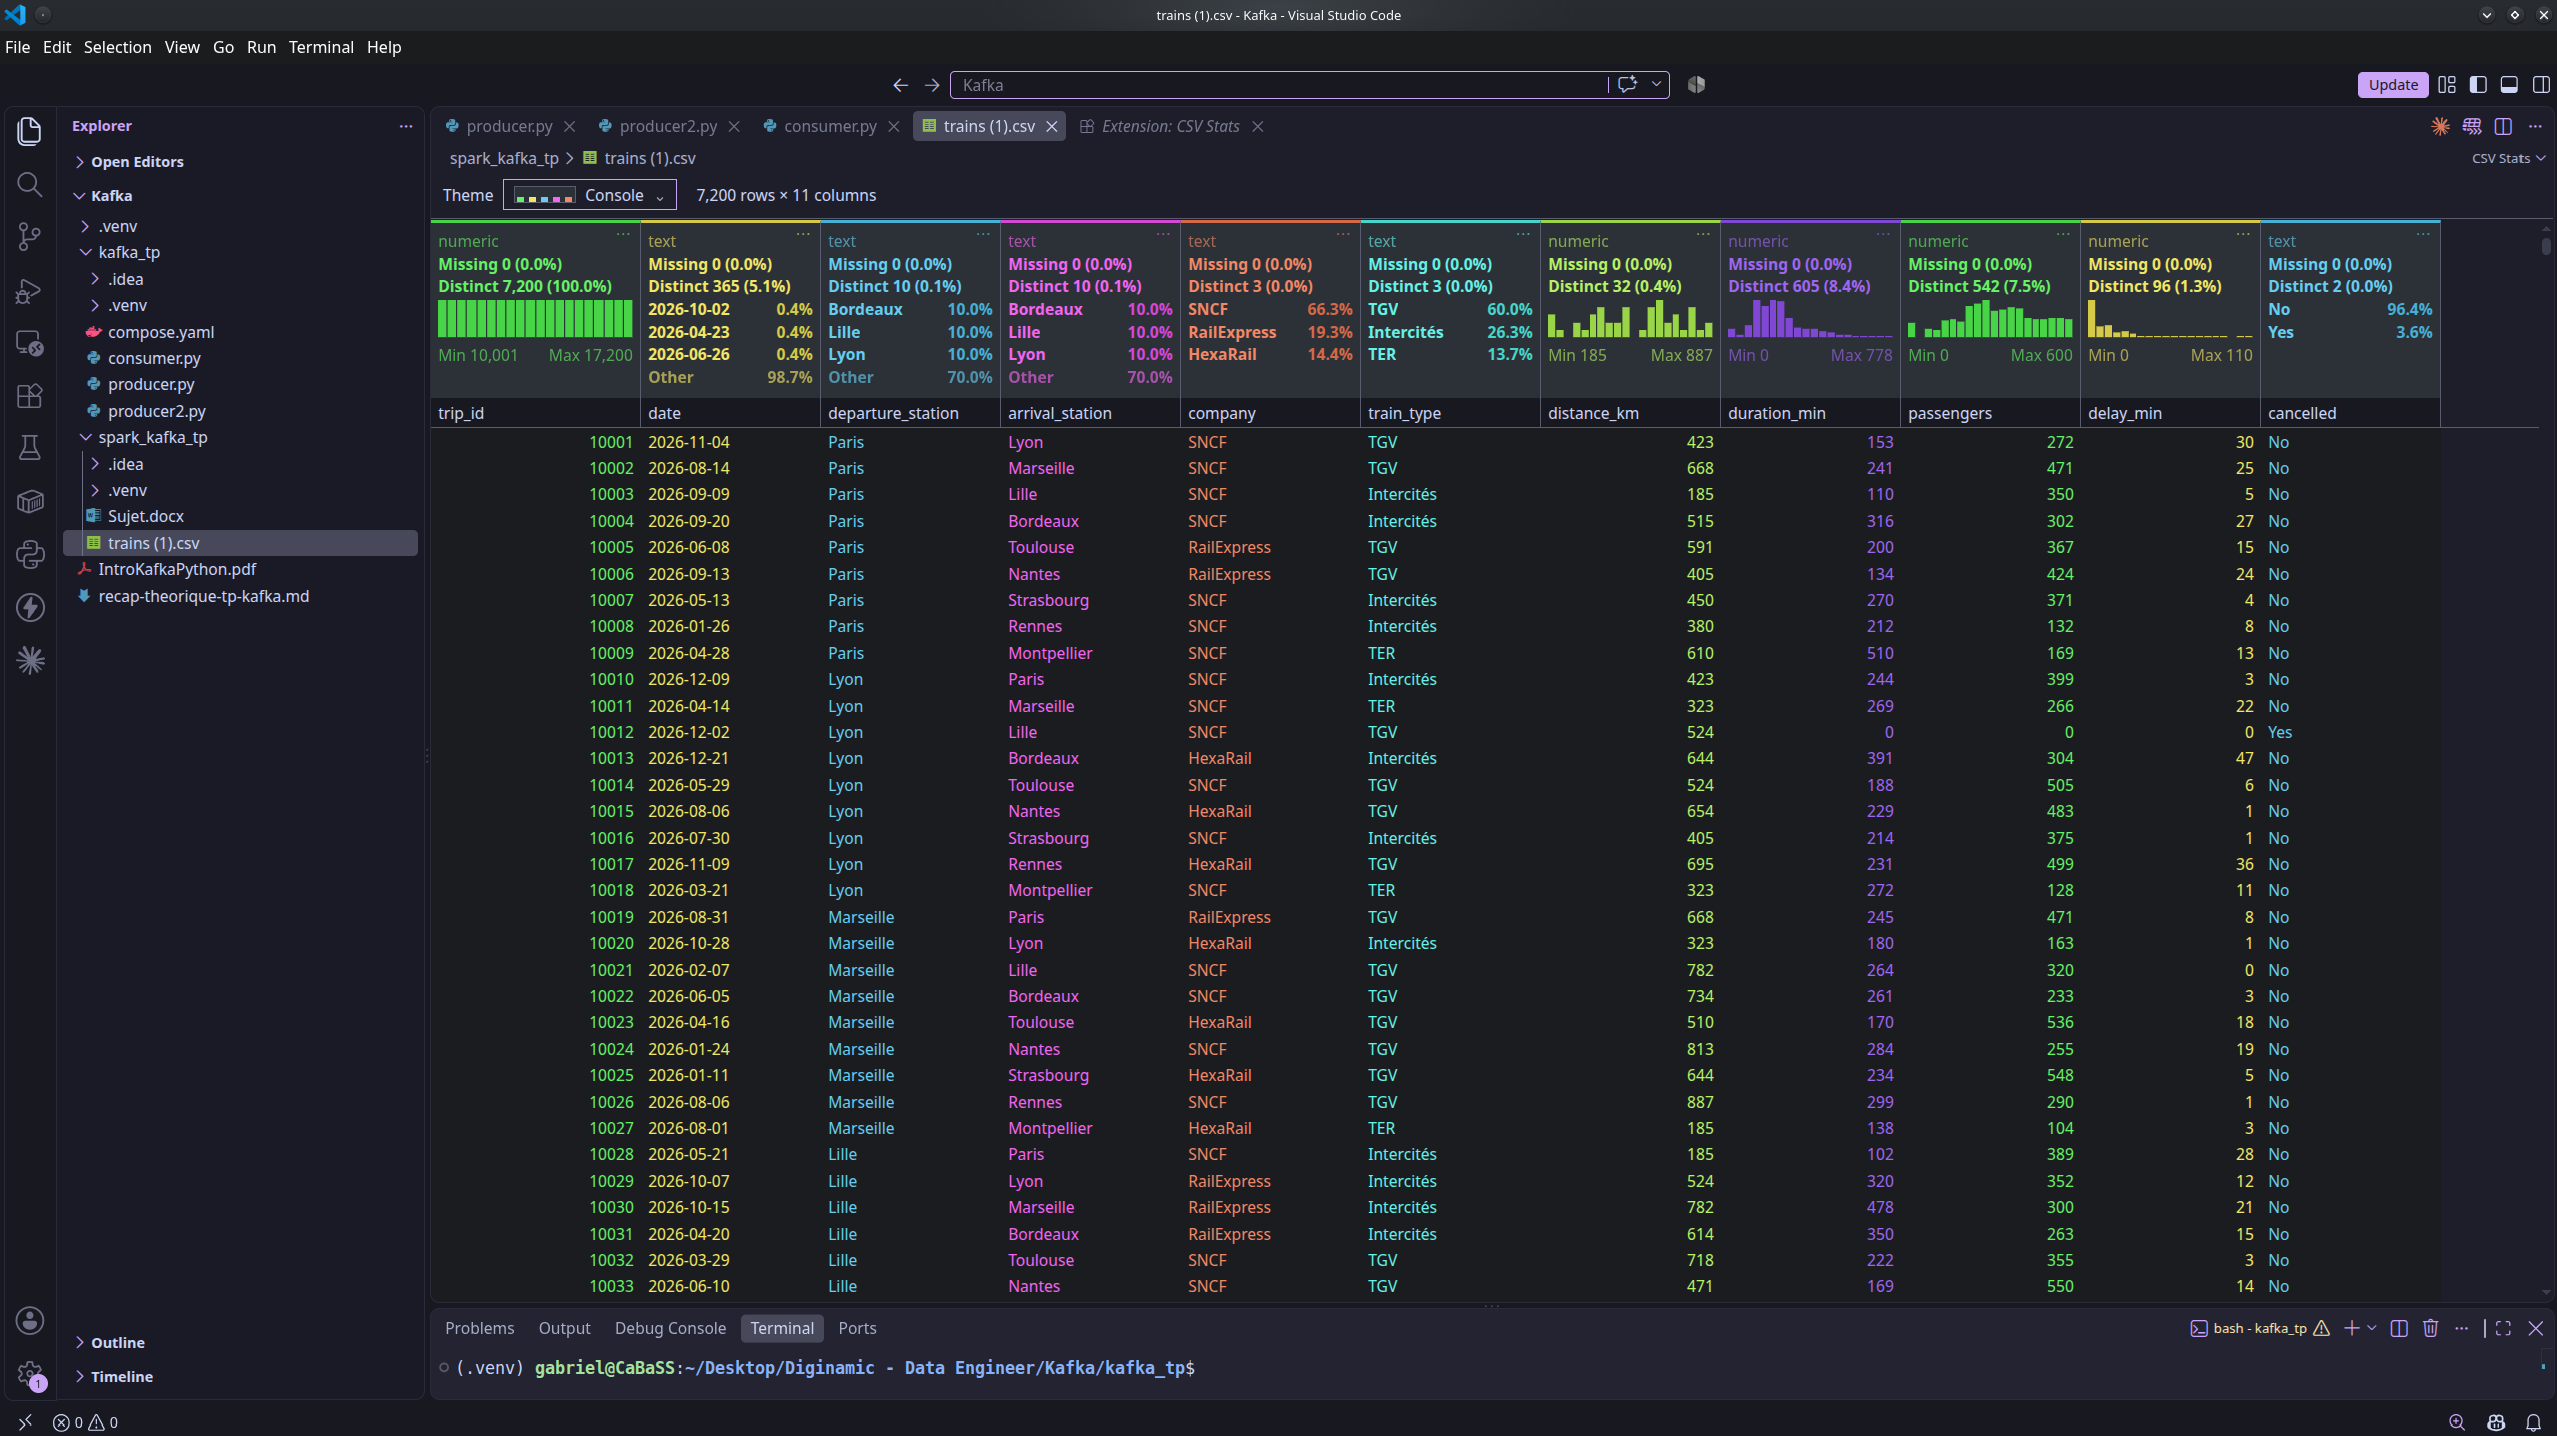
The same file with the Console palette, where each column carries its own ink colour

The Console palette leaves the background alone and colours the text instead.

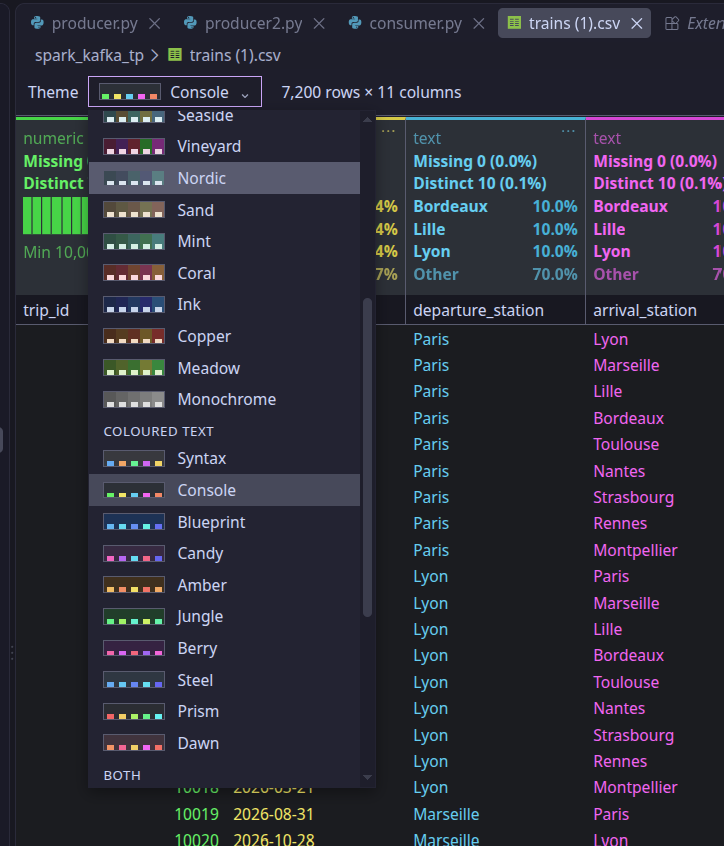
The palette picker, with a preview of each palette

Forty palettes, each previewed by five chips showing background and ink.

What the tab shows

Above every column, a band reports:

  • the detected type — numeric or text;
  • the count and share of missing values;
  • the count and share of distinct values;
  • for a numeric column, a 20-bin histogram, then Min on the left and Max on the right; hovering a bar shows that bin's range and count, and hovering the rest of the band gives the column's full name and its summary;
  • for a text column, the three most frequent values and their share, followed by an Other row carrying the remainder — so the percentages always add up to 100%.

Below that, the data table: click a header to sort, and only the visible rows are rendered, which keeps the display smooth at a hundred thousand rows.

Column menu

Three dots at the top right of each band: sort ascending or descending, a contains-filter, rename, drop the column, flip the detected type, and hide the band.

These are all view actions: the file is never rewritten. Reopening the tab restores the original state. Forcing the type to numeric keeps only the values that read as numbers, without requiring that all of them do — that is the whole point of a manual override.

Palettes

A picker offers forty palettes in three families: coloured background with uniform text (twenty), uniform background with text coloured per column, the way syntax highlighting does (ten), and both at once (ten). Your choice is remembered from one session to the next.

How files are read

  • The delimiter is detected between comma and semicolon by counting occurrences outside quotes over the first lines: what decides is the consistency of the count, not its size.
  • In a semicolon file, the comma is treated as a decimal separator; in a comma file, it is not.
  • A column is numeric only if every one of its present values reads as a number. Spaces, including non-breaking ones, are tolerated as thousands separators.
  • A cell that is empty or made only of spaces counts as missing.
  • A wholly blank line is not a data row: it is skipped, as is the trailing newline.
  • A UTF-8 BOM is stripped. UTF-8 is the expected encoding.
  • Beyond 500,000 rows the table is truncated, and the tab says so.

The file is read and analysed in the extension host rather than in the view, and rows reach the view in batches: the interface stays responsive throughout loading.

Build

From ./vscode-csv-stats-main/:

npm install
npm test       # parsing, statistics and palettes
npm run build  # bundles dist/extension.js and dist/webview.js
npm run package  # produces csv-stats-<version>.vsix

Install

code --install-extension csv-stats-0.2.4.vsix

Or, in VS Code: Extensions view → … → Install from VSIX…

  • Contact us
  • Jobs
  • Privacy
  • Manage cookies
  • Terms of use
  • Trademarks
  • Your Privacy Choices
  • Consumer Health Privacy
© 2026 Microsoft