Gandalf for VS Code
Run Gandalf's quality gates while
you write the code, instead of finding out in CI.
Gandalf is not another linter — it is an aggregator. One scan runs ~50 gates
over your repository (ruff, mypy, bandit, semgrep, gitleaks, trivy,
checkov, kics, codeql, osv, eslint, tsc, clippy, govulncheck,
shellcheck, hadolint, the test and build runners, and a set of LLM judges)
and folds what every one of them said into a single picture: one severity
ladder, one findings pane, one Red/Amber/Green scorecard. Each tool keeps its
own output format, its own severity words and its own idea of a rule id;
gandalf normalizes all of it, so the extension shows you one board to read
instead of a dozen terminals to reconcile.
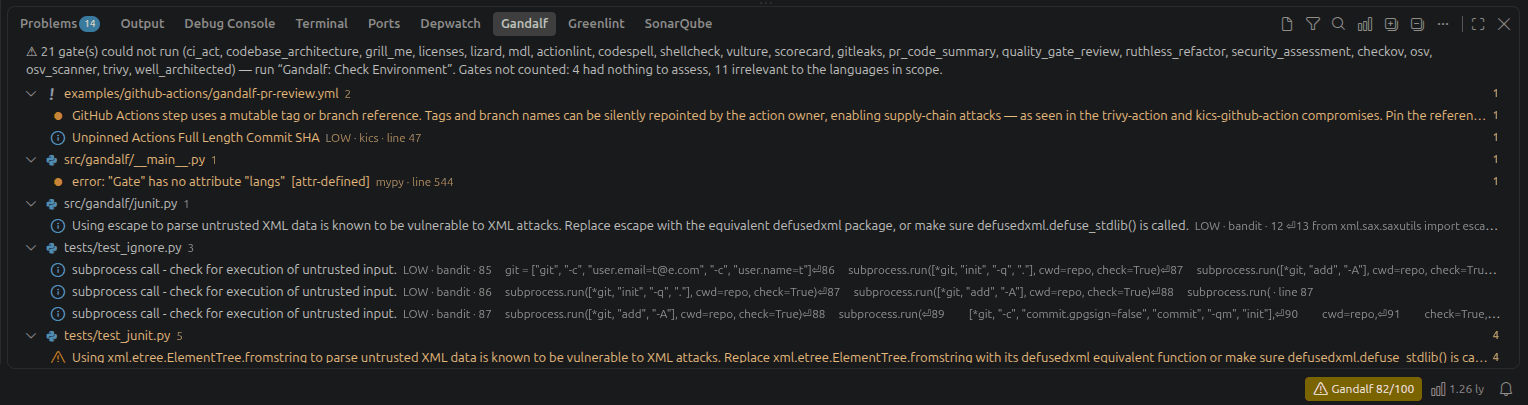
The pane, next to Problems and Terminal. Gates that could not run are named in the message line at the top rather than counted as findings.
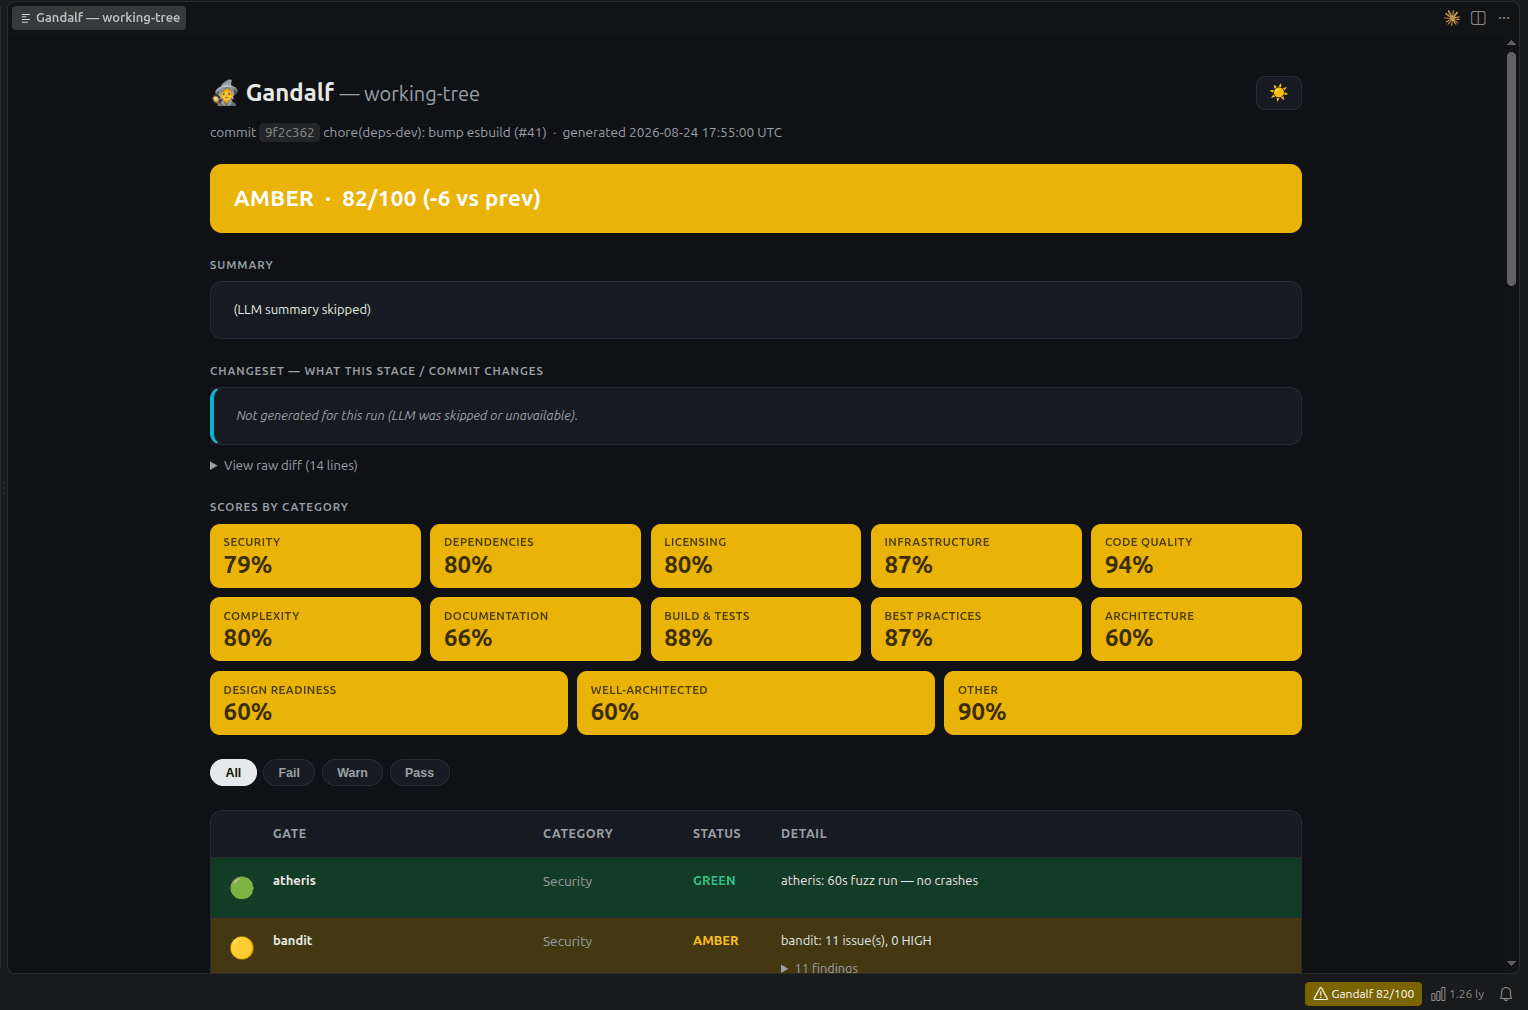
The report — the same reports/*.html the CLI writes, opened in a tab.
- Inline diagnostics — every finding that has a file and a line becomes a
squiggle. The hover explains the problem, which gate found it, its severity
and the rule id (linked to the tool's docs when there is one).
- A findings pane at the bottom — a normal VS Code tree view, so it behaves
like the Problems panel next to it: findings grouped by file, a distinct icon
per reported level, type-ahead filtering, keyboard navigation, an error badge
on the view. Expand all / collapse all, toggle between the current file and the
whole project, and filter by level — all from the title bar. Click a finding to
jump to it.
- The report, rendered exactly as
reports/*.html renders it — the same
verdict banner, category scores, sortable gate table and LLM sections you get
from the CLI, because it is that file, opened in an editor tab.
- Every gate, including the containerized ones. Gates that could not run are
counted separately from findings, so a green board never quietly means "never
checked".
Install
From the Marketplace: open the Extensions view, search for Gandalf —
Quality Gates, press Install. Or, from a terminal:
code --install-extension fabiocicerchia.gandalf-quality-gates
- VS Marketplace
— VS Code and VS Code Insiders.
- Open VSX
— Cursor, Windsurf, VSCodium and the other forks, which don't reach the VS
Marketplace. Same extension, published by the same release.
Then reload the window (Developer: Reload Window) — a Gandalf tab
appears in the bottom panel alongside Problems and Terminal. Gandalf itself is a
separate thing and has to be reachable; see Requirements.
From source
To install the unreleased build instead, from the repository root:
make ext-install # or CODE=cursor, windsurf, codium, code-insiders
That installs npm's dev dependencies if needed, typechecks, runs the tests,
builds the .vsix and installs it. Node 18+ is needed for the build; nothing of
it is needed afterwards. Then reload the window (Developer: Reload Window).
No code command at all? make ext-package builds the .vsix and stops, so
you can install it by hand: Extensions view → ... menu →
Install from VSIX…. (Or run Shell Command: Install 'code' command in
PATH from the Command Palette and use make ext-install.)
To hack on it instead of installing it: npm run watch, open
extensions/vscode/ as the workspace folder, press F5. That launches an
Extension Development Host with the extension loaded from source.
To remove it: Extensions view → Gandalf → Uninstall, or
code --uninstall-extension fabiocicerchia.gandalf-quality-gates.
Requirements
Gandalf itself. It is pure-stdlib Python with no install step, so the extension
finds it in whichever way you already have it, in this order:
gandalf.path — the wrapper make install writes, or a source checkout
(the directory holding src/gandalf); either shape is recognised.- The workspace itself, if you have gandalf's repository open.
gandalf on your PATH.~/.local/share/gandalf — the clone the README's install steps put there.
Nothing found? Gandalf: Check Environment says so, with the fix.
Getting all the gates, not just some
Most gates shell out to a real scanner. Gandalf looks for each tool on PATH
first, then in the gandalf-tools Docker image — so with Docker installed and
the image built, you get the full gate set with zero host installs:
make tools # in a gandalf checkout — or run “Gandalf: Build Scanner Tools Image”
Language toolchains (go, cargo, npm, npx, golangci-lint, govulncheck)
are never containerized — gandalf uses the ones you already develop with. The
kics and codeql gates pull their own images, and the dynamic scanners
(nikto, sqlmap, dalfox) only run with an explicit --target, so they stay
idle in an editor.
Gates that could not run are reported in the view's message line rather than
listed as findings — they are not results, and they should not look like any.
That line names them, so it is also the tool inventory; Gandalf: Check Environment answers the question a scan can't, which is why it produced
nothing at all.
Commands
| Command |
What it does |
Gandalf: Scan Workspace |
Full run over the working tree. |
Gandalf: Scan Current File |
Re-runs the gates scoped to the active file (--path). |
Gandalf: Open Report |
The HTML scorecard, in an editor tab. |
Gandalf: Open Report (regenerate with LLM summary) |
Same, re-run with the LLM sections. |
Gandalf: Check Environment (Doctor) |
Is gandalf, git, docker, the scanner image and the LLM endpoint present. |
Gandalf: Build Scanner Tools Image |
docker build -f tools.Dockerfile -t gandalf-tools . in a terminal. |
Gandalf: Cancel Running Scan |
Kills the current run. |
Gandalf: Filter Findings |
Native quick pick over both axes: reported level and editor severity. |
Gandalf: Show Findings in the Current File / …in the Whole Project |
The pane's scope toggle, in its title bar. |
Gandalf: Show Gate Timings |
Every gate by wall-clock cost, slowest first. Select gates to copy a skip list. |
Gandalf: Show Score History |
The score across recent commits. Pick one to scan it and read its report. |
Gandalf: Export Report… |
Save the HTML scorecard wherever you want it — to attach to a pull request. |
Reading the pane
Findings are grouped by file, worst first. The icon is the level the tool
reported, not the editor severity it maps to, because CRITICAL and HIGH both
squiggle as errors and the difference is the whole point when you are deciding
what to look at first:
| Icon |
Level |
Where it comes from |
🔥 flame |
Critical |
CRITICAL |
⛔ error |
High |
HIGH, ERROR |
⚠️ warning |
Medium |
MEDIUM, MODERATE, WARNING |
ℹ️ info |
Low |
LOW |
○ circle-outline |
Info |
INFO, NOTE |
● circle-filled |
Unrated |
The tool reported no severity at all |
Unrated is a real category, not a gap to paper over: mypy, vulture, the
format gate and the skill-backed judges publish findings with no severity, and
placing them on the ladder would invent precision. They take their colour from
the gate's own outcome, and sort as if they were High (from a red gate) or Medium
(from an amber one) — a failing mypy error has no business sitting below a
cosmetic LOW. A level the tool actually stated wins a tie against an inferred
one.
Two gates fold their severity into the message text rather than a field —
kics and licenses both report [HIGH] … — so a leading bracket holding a
known severity word is read as the level and moved out of the message. A bracket
holding anything else ([B603], mypy's trailing [attr-defined]) is left alone.
Gandalf: Filter Findings filters on both axes at once — reported level
and editor severity, with live counts next to each. They are different
questions ("show me the HIGHs" vs "show me what squiggles as an error"), and a
finding has to match both. Clearing an entire axis means "all of it" rather than
"nothing", so the pane can't be filtered into a corner. When a filter is on, the
view header says filtered, and an empty pane tells you how many rows are hidden
rather than claiming everything is green.
Excluding what the editor already excludes
Whatever files.exclude and search.exclude hide from you — node_modules,
build output, vendored trees — gandalf skips too. Those settings are already the
list of things you don't want to look at, so the extension reads them rather
than asking you to maintain a second copy. Turn it off with
gandalf.useEditorExcludes, and add your own with gandalf.exclude.
The two glob dialects differ, so patterns are translated on the way through: a
leading or trailing ** is dropped (a bare name already means "at any depth" to
gandalf), {a,b} alternation is expanded, and when clauses are skipped since
they ask a question about the workspace rather than naming a path. Everything is
passed as gandalf --exclude, alongside whatever the repository's
.gandalfignore already says.
Saving a file that is itself excluded doesn't start a scan at all — no process,
no gates.
Score history
A single scorecard says where you are; .gandalf-trend.jsonl says whether it is
getting better. Gandalf has always written that file — one line per CLI run,
which is where the report's "(+5 vs prev)" comes from — and nothing has ever
read it back.
Gandalf: Show Score History joins it against git log: recent commits,
newest first, each with its score and the change from the one before, and a
sparkline of the whole series in the title. The scale is the observed range
rather than 0–100, because a repository that lives in the eighties still has
movement worth seeing.
Commits nothing has scored yet are listed as such — "we have never measured
this" is part of a history. Pick any commit and it is scanned (--commit) and
its report opens; that scan does join the trend log, since one entry for one
commit is exactly what the log is for. Editor scans still don't, for the reason
they never did: a scan on every save would swamp it. CLI and CI runs fill it in
the same way they always have.
A commit's scan deliberately does not replace the findings pane. You asked what
that commit looked like, not to be shown it instead of your working tree.
While a scan runs
The status bar shows live progress — $(sync~spin) Gandalf 12/37 — with the
stage and the gate that just finished in its tooltip. A whole-tree scan you asked
for also gets a notification with a real progress bar and a Cancel button; a
one-file scan skips the popup, since it is over in seconds.
None of that is guessed at: gandalf already reports its stages and gate counter
on stderr, and the extension turns that on for a piped run (GANDALF_PROGRESS=1)
and reads it. Stages are equal slices of the bar, and the gate-running stage —
which is nearly all the runtime — fills by gates completed.
Findings arrive as they are found. The pane does not wait for the run to
finish: gandalf emits each gate's result the moment it completes (--stream),
and each one replaces what the previous run said about that gate while the rest
of the board stays up. So a slow scan is readable from the first second instead
of being a blank pane with a spinner. On gandalf's own repository the first rows
land at ~0.3s and the last at ~7s, in a run that takes 14s to report.
Two things deliberately don't stream, because they are properties of a whole
run rather than of any one gate: the verdict and the composite score.
Those appear when the report lands, at which point it replaces the streamed
results wholesale. Diagnostics are published then too — squiggles appearing and
moving gate by gate would be worse than squiggles appearing once. Streamed
findings do respect your baseline, so nothing flashes up that the report will
suppress.
When a full scan takes minutes
It usually does, and mostly for one reason: a full run is thirty-odd real
scanners over the whole tree. Gandalf: Show Gate Timings puts the blame
somewhere specific — every gate by wall-clock cost, slowest first, with the
summed and wall-clock totals in the title (they differ because gates run
concurrently). Select the expensive ones and it copies a ready-to-paste
skip = [...] list. The same top five go to the log after every full scan.
Then, in rough order of payoff:
- Saves never scan the tree — only the file you saved. Whole-tree scans are
on demand, at startup, or on the interval, so the minutes are never in your way.
- Run a smaller gate set while editing. Put the expensive gates in a
skip list in an editor-only config and point gandalf.configPath at it —
CI still runs .gandalf.toml in full. See the profiles below.
- The judge gates are off unless you ask for them. The skill-backed gates
(
grill_me, well_architected, security_assessment, quality_gate_review,
ruthless_refactor, codebase_architecture, compliance) each spend a full
model round trip. With gandalf.scan.llm off — the default — background scans
pass --no-llm, which now skips those gates outright rather than only the
report's summary; they are listed as disabled in the report. Turning
gandalf.scan.llm on brings them back, and then they are the slowest gates in
the run and set its tail. Editor scans also pass GANDALF_LLM_RETRIES=1 so an
endpoint that has gone away costs one backoff rather than three (11s → 0.3s per
call, measured on gandalf's own repository); export the variable yourself to
override it. Gandalf: Check Environment reports the endpoint either way.
- Turn on
gandalf.scan.debug when you want to watch the run rather than
guess at it: every stage, every gate's start and duration, and every command
gandalf shells out to, stamped with the elapsed time, in the Gandalf output
channel (Gandalf: Show Log). It is the only thing that names the gate a
timed-out scan was stuck in — Gandalf: Show Gate Timings and the report can
only describe gates that finished.
- Build the tools image (
make tools). Not for speed — for correctness —
but note that gates whose tool is missing return almost instantly, so a fast
scan on a bare machine mostly means nothing was checked.
- Bound the parallelism with
gandalf.scan.concurrency if the scan is
making the editor sluggish, and give slow gates their own budget with
[gandalf.timeouts] in .gandalf.toml. Gandalf submits gates heaviest-first,
so a low concurrency spends its slots on the gates that need them: at
concurrency: 2 the two heaviest start, and the quick gates fill in behind.
- Let the cache work. A repeat full scan with nothing changed reuses every
gate result; the cost above is the cold path. A scan that hits
gandalf.scan.timeoutSeconds still banks every gate that finished, so the
next one starts where it stopped rather than repeating it — and gandalf is
given a deadline just under that timeout, so it stops itself with time to
write a scorecard rather than being killed holding nothing.
Keeping it cheap
A gandalf run forks ~30 gates, several of which are docker run. Doing that on
every keystroke would be unusable, so the extension never scans while you
type. What it does instead, in layers:
1. Scope, first and foremost. A save triggers a scan of that file
(--path <file>), never the tree. That is the difference between a couple of
seconds and a couple of minutes. The whole project is scanned on demand, at
startup, and — if you ask for it — on a long interval. Per-file results are
merged over the last project run, so the pane always shows the project picture
with the file you just touched refreshed.
2. Don't run what you just ran. Saving an unmodified buffer fires
didSave; the extension hashes the file and skips the scan when the bytes are
identical to the last scan of it.
3. Debounce and coalesce. A burst of saves collapses into one run
(gandalf.scan.debounceMs, default 1.5s).
4. One process, ever. Runs are strictly serialized — there is never a
second gandalf competing for the same CPU and the same Docker daemon. While one
runs, only the newest queued request survives, so a save storm cannot build a
backlog. Invoking a command preempts an automatic run rather than queueing
behind it.
5. Gandalf's own gate cache. Workspace and staged scans pass --cache, so
a gate whose scanned files are unchanged returns its previous result instead of
re-running its tool. File scans deliberately skip it: the cache is keyed on a
hash of the whole scanned file set, so a one-file scan would overwrite the
workspace entries with a one-file hash and turn the next full scan into a total
miss. The cache file is gandalf's own .gandalf-cache.json, which belongs in
.gitignore.
6. Bound the parallelism. gandalf.scan.concurrency caps gates in flight.
Gandalf defaults to your CPU count; on a laptop that is also running a dev
server, 3–4 keeps the machine responsive. gandalf.scan.timeoutSeconds kills a
run that gets stuck.
7. Idle machines stay idle. Periodic sweeps are skipped while the window is
in the background, and skipped entirely if a scan already ran recently.
8. Nothing lands in your repository. Reports go to the extension's storage
directory (--out-dir), not reports/, and the trend log is not appended to
(--no-trend) — a scan on every save would swamp a history that is meant to be
per-commit. Only the newest few reports are kept.
9. The LLM stays off for background scans — the summary and the judge
gates, since --no-llm drops both. Summaries cost a round trip to a model and
each judge gate costs another; ask for one when you want to read it (Gandalf: Open Report (regenerate with LLM summary)), or set gandalf.scan.llm. With the
LLM on, the judge gates cap their retries at one, so an unreachable endpoint
costs a second per scan rather than eleven.
What the extension itself costs
Gandalf's gates dominate any scan, but the extension shouldn't add to it. The
numbers below are from a synthetic tree of 10,000 findings over 2,000 files —
larger than most real repositories, chosen so the costs are visible at all:
|
Before |
Now |
| Filesystem calls while streaming |
10,000 (one per finding) |
2,000 (one per distinct file) |
| Normalizing a streamed run |
50 ms |
28 ms |
| Re-deriving the board per scan |
269 ms |
~0 ms (memoized) |
| Scan output held in memory |
all of stdout |
33% of it |
| Retained per scan |
4.5 MB |
3.7 MB |
The mechanisms, since they constrain how the code may change:
- One path cache per run, not per gate. Placing a finding means asking the
filesystem where its file is; streaming normalizes gate by gate, so a
per-gate cache re-stats paths an earlier gate already resolved. These are
synchronous calls on the extension host's thread, which is the one drawing
your editor.
- The merged board is memoized against a revision every mutation bumps. The
pane, the status bar and the diagnostics each ask for it, several times per
repaint, and a streamed scan repaints often.
- Streamed findings are never buffered. With
--stream the findings arrive
on stdout as JSON; they are parsed as they land and only the scorecard and the
two report paths are kept, rather than holding every finding twice for the
sake of two lines at the end.
- Raw findings are dropped once normalized. The report is kept for its
verdict, gate summaries and durations, not for data that has already been
converted.
- A saved file is read once, not once to check whether it changed and again
to record what was scanned.
If you want to see where a scan's time actually goes, that is the gates:
Gandalf: Show Gate Timings names them after the fact, and
gandalf.scan.debug narrates the run as it happens.
Profiles worth copying
Comfortable default — nothing to configure: a save scans that file, the tree is
scanned on demand and at startup.
Large repository or slow gates — narrow what runs while you work, and sweep
everything twice an hour:
{
  "gandalf.scan.trigger": "onSaveAndInterval",
  "gandalf.scan.intervalMinutes": 30,
  "gandalf.scan.concurrency": 4,
  "gandalf.configPath": ".gandalf.vscode.toml"
}
# .gandalf.vscode.toml — the fast gates only; CI still runs .gandalf.toml in full.
[gandalf]
only = ["ruff", "format", "mypy", "bandit", "gitleaks", "build"]

[gandalf.timeouts]
default = 60
Battery saver — scan only when asked:
{ "gandalf.scan.trigger": "manual", "gandalf.scan.onStartup": false }
Also worth knowing: a .gandalfignore at the repo root keeps tree-scanning
gates (trivy, checkov, kics) out of local state like .env or data/,
and [gandalf.timeouts] in .gandalf.toml gives a slow gate its own budget.
Settings
Search "Gandalf" in the settings UI — every one is described there. The ones
worth knowing about are covered above.
Gate selection (only / skip) lives in .gandalf.toml, not on the command
line — point gandalf.configPath at an editor-specific config to run a
different gate set while you work.
gandalf.scan.debug is the one to reach for when a scan is slow or times out:
it puts gandalf's own elapsed-stamped log — stages, gate starts and durations,
every command — into the Gandalf output channel.
Notes and limits
- Multi-root workspaces: scans target the folder holding the active editor,
and results are kept per folder.
- Results are per session — they live in memory, not on disk. The startup
scan repopulates them.
- The pane and the status bar are native; the only webview is the report
itself, because it is gandalf's own HTML document rendered unchanged.
--path needs a tracked file: a file git doesn't know about is skipped
(silently, in the log) rather than scanned.- Findings without a location — a scorecard check, an architecture judgement
— appear in the pane, not as squiggles. There is nowhere to put them.
Development
npm install
npm run typecheck # tsc --noEmit
npm test          # unit tests (node --test, no framework)
npm run build     # bundle to dist/ with esbuild
npm run watch     # rebuild on change; F5 in VS Code launches an Extension Host
npm run package   # .vsix
The extension talks to gandalf only through its CLI and its JSON report, so it
stays useful against any gandalf checkout. src/parse.ts is the one piece that
has to understand gate output; its key lists mirror gandalf/report.py,
gandalf/sarif.py and gandalf/suppress.py, and it is covered by unit tests
with fixtures taken from real gate output.
One job per module:
| Module |
What it is |
extension.ts |
activate and deactivate: build the session, register, start |
session.ts |
the components, the state they share, and running one scan |
commands.ts |
every contributed command, in one table |
runner.ts |
one gandalf run, end to end; re-exports exec/launcher/argv |
exec.ts |
a child process, and killing its whole group |
launcher.ts |
where gandalf is, and what flags this build takes |
argv.ts |
the command line: scope, output, run, excludes |
parse.ts |
gandalf's report → the normalized Finding |
events.ts · progress.ts |
--stream events and the progress line |
findingsView.ts · diagnostics.ts · status.ts · report.ts |
what the user sees |
store.ts · scheduler.ts · history.ts · exclude.ts · doctor.ts |
the rest |
src/test/vscode-shim.ts is enough of the editor API to run all of that under
node --test — including activate, which is held to the command ids
package.json contributes. It records and returns; it never decides anything,
because a shim with behaviour of its own stops telling you about the code.
Releasing
The extension has no version of its own. release-please-config.json lists
extensions/vscode/package.json (and its lock) as extra files, so the release PR
that bumps version.txt bumps the extension in the same commit, and the tag
means one thing for both surfaces.
Merging that PR cuts a draft release, and release.yml calls
publish-extension.yml in the same run: version from the tag, npm ci,
npm run package (typecheck, tests, bundle, legal files, vsce package), then
publish to the VS Marketplace and to Open VSX, attach the .vsix to the
release. A last job flips the draft to published, which is what creates the tag.
That order is the whole point: this repository has immutable releases, so a
published release's assets are frozen — the .vsix has to be attached while it
is still a draft. If the publish job fails the release stays a draft, which is
the recoverable half of the two outcomes.
Calling the workflow rather than hanging it off on: release is deliberate too:
the release release-please creates carries GITHUB_TOKEN, and GitHub does not
start workflows from GITHUB_TOKEN events. It re-stamps the version from the tag before packaging —
normally a no-op, but workflow_dispatch takes a version too, and a manifest
that disagrees with the tag must never ship.
The workflow is inert until the tokens exist. Each publish step is skipped when
its secret is missing, and the job summary says which registries were skipped
and why, so a run without secrets packages and attaches rather than fails.
Two one-time setup steps only the repository owner can do:
|
VS Marketplace |
Open VSX |
| Account |
Azure DevOps organisation |
GitHub, via open-vsx.org |
| Namespace |
publisher fabiocicerchia, created at marketplace.visualstudio.com/manage |
namespace fabiocicerchia, ovsx create-namespace |
| Token |
PAT scoped All accessible organizations + Marketplace → Manage |
access token from the Open VSX profile page |
| Secret |
VSCE_PAT |
OVSX_PAT |
The PAT's organisation scope is the one that catches people out: a PAT limited
to a single Azure DevOps organisation authenticates and then fails to publish.
make ext-publish does the same thing from a laptop when CI is not an option.
It needs the same environment variables and it publishes whatever is in the
working tree, which is why it is the escape hatch rather than the route.
Marketplace versions are immutable — a version can be superseded, never
replaced — so the workflow rejects anything that is not x.y.z before it starts
rather than half way through.
Three files exist only so that chain runs unattended, all of them gitignored and
copied in by npm run package: LICENSE and NOTICE, because Apache-2.0 §4
wants them shipped with anything we distribute; and CHANGELOG.md, because the
Marketplace renders one as a tab and there is one changelog — release-please's,
at the repository root. A second one beside it would only ever be out of date.
Marketplace listing copy comes from package.json (displayName,
description, categories, keywords, icon, galleryBanner) and this
README, rendered as the extension's page. Relative links in it break there, so
keep them absolute.
License
Apache-2.0, same as gandalf.

