depwatch for VS Code
Dependency drift (libyears) × viability, in the editor. Same engine as the CLI,
same numbers, same quadrant.
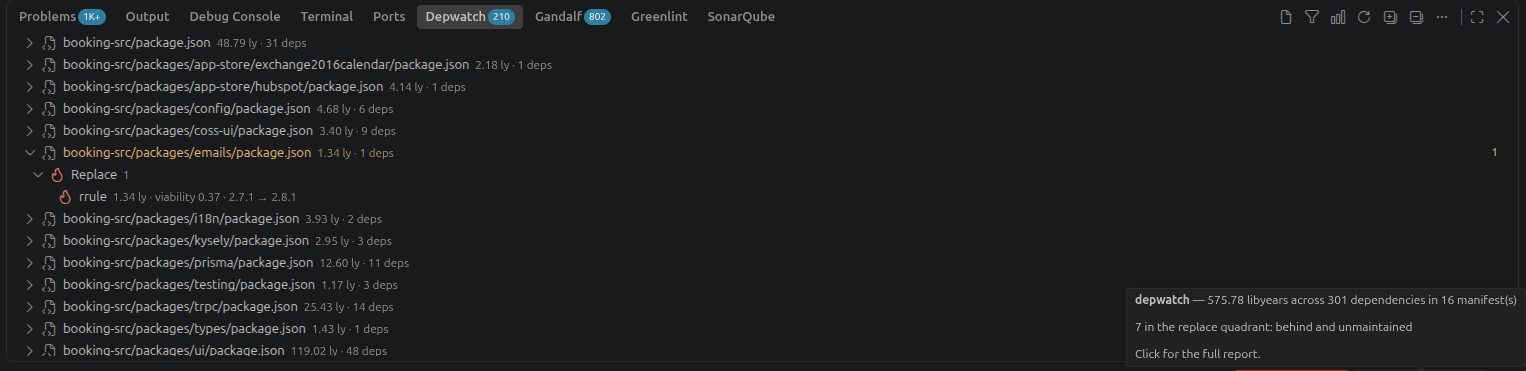
The findings pane: every manifest in the workspace, worst first, grouped by
quadrant — here 575 libyears across 301 dependencies in 16 manifests, with the
one dependency that is both behind and unmaintained expanded.
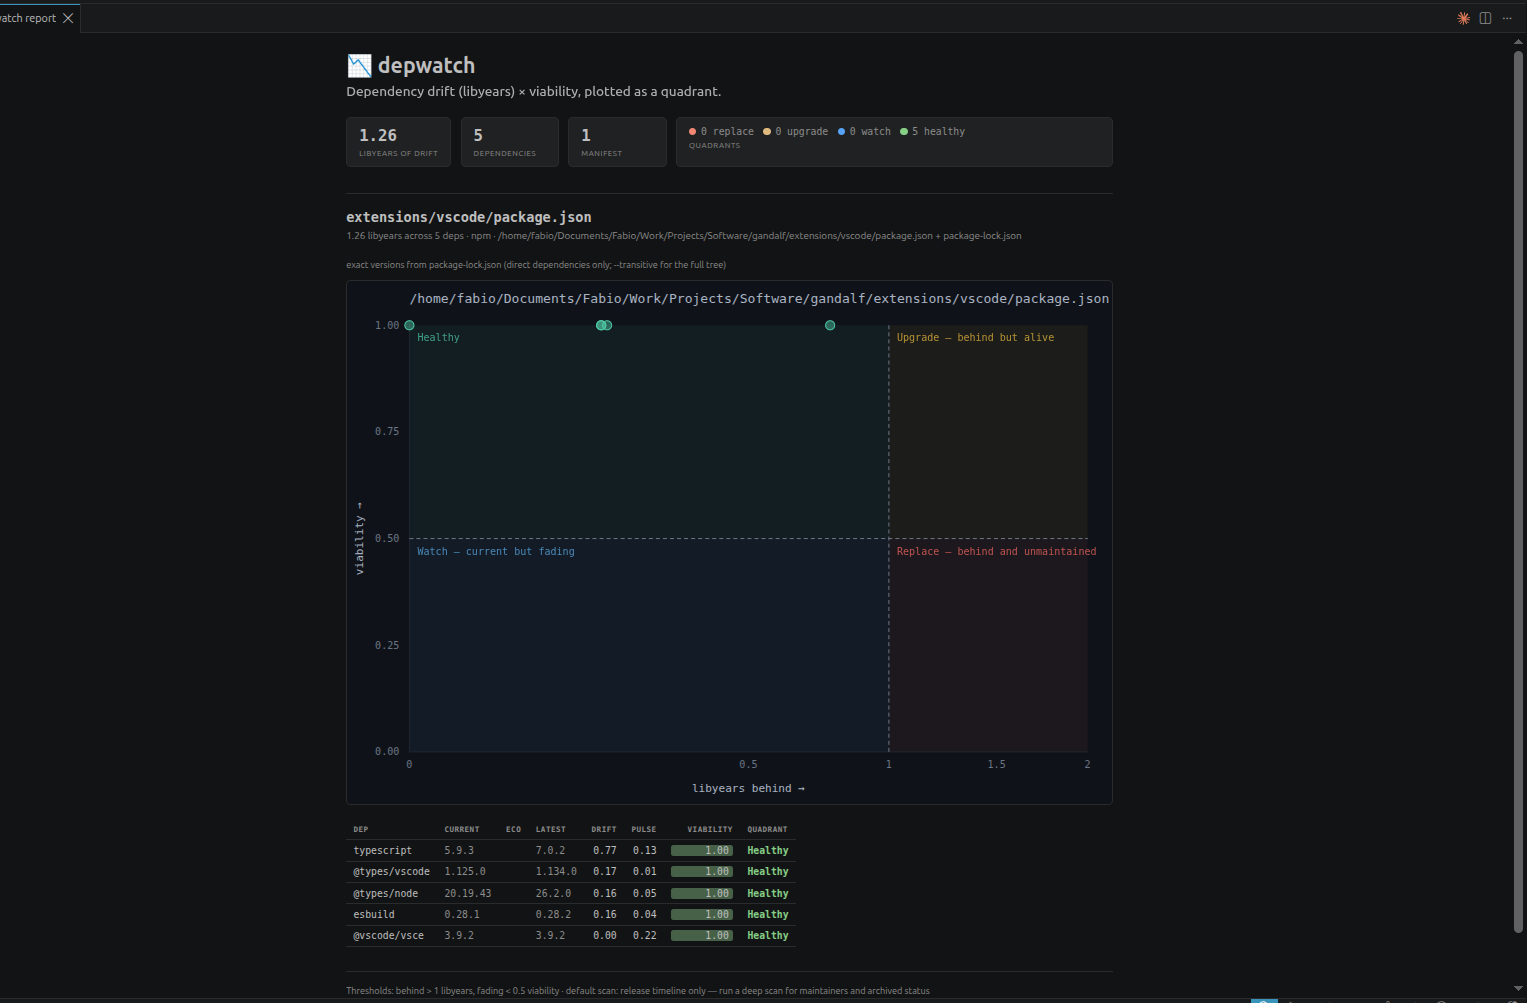
The report: the totals, the quadrant, and the table behind it.
- Squiggles on the manifest. Each dependency is underlined with its
quadrant, and the hover says why: how far behind, when the last release was,
how many maintainers, whether the repository is archived.
- A findings pane, in the bottom panel. Grouped by quadrant, worst first,
scoped to the manifest the current file belongs to or the whole project,
filterable by quadrant, and ending in the bottom line: how much drift, spread
over how many dependencies, and how many of them are work.
- The report, as a tab: the totals, the quadrant chart and the table
depwatch check prints. Click a row to jump to that dependency.
- The gates from
depwatch check --ci — --max-libyears, --max-replace —
evaluated live, so the budget that fails the build fails in the editor first.
- Trend, from the manifest's own git history.
- Deep scan, on demand: maintainer count, funding, archived status and last
commit.
Everything except the report is native VS Code UI: the tree view, the Problems
panel, hovers, the status bar. The report is a webview, themed entirely from
your colour theme.
Install
From the VS Code Marketplace — search depwatch in the Extensions view
(Ctrl/Cmd+Shift+X) and press Install, or from a
terminal:
code --install-extension fabiocicerchia.depwatch-vscode
VSCodium and Cursor read Open VSX rather than the Marketplace, under the same
id — codium --install-extension fabiocicerchia.depwatch-vscode.
The CLI form needs code on your PATH. If it is not found — common on macOS —
open the Command Palette and run Shell Command: Install 'code' command in
PATH. Every release also attaches the .vsix to its GitHub
release, for the Extensions
view's ... menu → Install from VSIX….
From source
make ext-install, from the repository root: it builds, packages a VSIX and
installs it. Reload the VS Code window afterwards.
Trying it without installing
Open extensions/vscode in VS Code and press F5. That builds and
launches an Extension Development Host with depwatch loaded, and leaves your
normal editor untouched.
First run
The extension activates on a workspace containing a manifest it recognises. You
should see a depwatch tab in the bottom panel, total drift in the status
bar, and a scan starting on its own. depwatch: Scan the workspace forces one.
Supported languages
The same 16 ecosystems the CLI reads — the extension shares the engine, so a
file depwatch check understands is a file it annotates.
| Language / stack |
Registry |
Recognised files |
| JavaScript / TypeScript |
npm |
package.json, package-lock.json, yarn.lock, pnpm-lock.yaml, bun.lock |
| Python |
PyPI |
requirements*.txt, pyproject.toml (Poetry & PEP 621), poetry.lock, uv.lock |
| conda environments |
Anaconda.org (conda-forge by default) |
environment.yml, conda-lock.yml |
| Rust |
crates.io |
Cargo.toml, Cargo.lock |
| PHP |
Packagist |
composer.json, composer.lock |
| Ruby |
RubyGems |
Gemfile.lock |
| Go |
Go modules |
go.mod, go.sum |
| Java / Kotlin |
Maven Central |
pom.xml, build.gradle(.kts), gradle.lockfile |
| C# / .NET |
NuGet |
packages.config, *.csproj, packages.lock.json |
| Dart / Flutter |
pub.dev |
pubspec.yaml, pubspec.lock |
| Elixir / Erlang |
Hex |
mix.exs, mix.lock |
| Swift / Objective-C |
CocoaPods |
Podfile.lock |
| Terraform / OpenTofu |
Terraform Registry |
.terraform.lock.hcl, *.tf |
| Helm |
the chart repo's own index.yaml |
Chart.yaml, Chart.lock |
| GitHub Actions |
GitHub |
.github/workflows/*.yml, action.yml |
| Docker |
Docker Hub |
Dockerfile, Containerfile — pulse and viability only |
CycloneDX SBOMs (bom.json, *.cdx.json) are read too, scored per component
ecosystem.
Docker is the one entry scored on a single axis: a tag has an honest publish
date but no orderable version series, so drift shows as — and only pulse and
viability are reported.
Discovery is narrower than support, deliberately: depwatch.manifests
defaults to package.json, requirements*.txt, Cargo.toml, composer.json,
Gemfile.lock and the SBOM names, because globbing sixteen ecosystems across
every workspace costs more than most repositories get back. Add what your
project uses — ["**/package.json", "**/go.mod", "**/pom.xml"] — and the rest
follows on its own. Those same five names are what the extension auto-activates
on, so in a workspace with none of them run any depwatch: command once to wake
it up.
Commands
| Command |
What it does |
depwatch: Scan the workspace |
Every manifest, up to depwatch.maxManifests |
depwatch: Scan the active manifest |
Just this one, ignoring the cached result |
depwatch: Deep scan |
Adds maintainers, funding, archived, last commit |
depwatch: Open the report |
The quadrant chart and the table, in a tab |
depwatch: Show drift over git history |
Trend, sampled from git log |
depwatch: Check the CI gates |
The same verdict --ci gives |
depwatch: Export the report as HTML |
A standalone file, for a browser or a PR |
depwatch: Export the quadrant chart as SVG |
The chart on its own |
depwatch: Filter findings by quadrant |
Show only replace / upgrade / watch / healthy / no data |
depwatch: Expand all findings |
The other half of the collapse-all button |
depwatch: Accept current findings |
Writes a baseline; only what gets worse shows afterwards |
depwatch: Clear the baseline |
Shows every finding again |
depwatch: Cancel the running scan |
Stops a scan issuing further requests |
depwatch: Show the log |
Opens the depwatch output channel |
depwatch: Clear the registry cache |
Forces the next scan to refetch |
depwatch: Set the GitHub token |
Stored in the OS keychain, for deep scans |
The findings pane
The title bar carries, in order: the scope toggle (current file ⇄ whole
project), the quadrant filter, expand all, the report, and a rescan — plus VS
Code's own collapse-all.
Filtering opens a multi-select list of the five quadrants with a count
beside each, so you can narrow to replace on a Monday and see everything again
on a Friday. It is a lens on today's list, not a setting: it resets when the
window reloads, and while one is active the view's subtitle says
filtered: replace so a narrowed pane never passes for the whole picture.
The tab carries a count, the way PROBLEMS 268 does: dependencies outside
the healthy quadrant, hover for the breakdown. It counts the whole workspace and
ignores both the scope toggle and the filter — a number that changed every time
you clicked a different file would be noise rather than something you can keep
half an eye on. depwatch.badge switches it to every watched dependency
(total) or turns it off.
The last row is the total for whatever is in scope — say
20.76 libyears · 5 of 6 deps to address, broken down as
1 replace · 2 upgrade · 2 watch · 1 no data. "To address" is everything
outside the healthy quadrant. Dependencies the registry would not answer for are
reported separately and deliberately left out of that count: unknown is not a
to-do, and counting it would turn a flaky registry into a growing backlog. The
total ignores the filter — it is the bottom line, not a view of the list.
What gets scanned
Two settings, plus the editor's own:
depwatch.manifests — the include list. Globs, so narrowing to part of a
monorepo is ["apps/*/package.json"] rather than an exclusion arms race. Lock
files are found beside a manifest, so list the manifests, not the locks.depwatch.exclude — extra globs to skip, on top of the editor's.files.exclude and search.exclude — whatever you have already hidden
from the explorer and from search is skipped too, unless you turn
depwatch.useEditorExcludes off.
That last one is not automatic, which is worth knowing: workspace.findFiles
applies files.exclude only when an extension passes no exclude of its own,
and never applies search.exclude. So an extension with a hardcoded exclude
list silently overrides yours. depwatch merges instead.
depwatch.maxManifests (25) is the backstop: a monorepo with 300 package.json
files is a scan nobody asked for.
If something you expected is missing, the depwatch output channel logs how
many manifests were found and how many globs were excluded.
Accepting what is already there
A repository that has been running for years opens the pane at 88 libyears and
fifty-odd dependencies to address. All of it is true and none of it is news, and
a list that never empties is a list people stop reading.
depwatch: Accept current findings writes .depwatch-baseline.json — commit
it, and the team shares one answer to "how much drift do we already live with".
From then on the pane shows what got worse, and the last row still says how many
findings are hidden (… · 47 accepted) so a baselined pane never reads as a
clean bill of health.
Two things count as worse, and both bring a dependency back:
- more drift than was accepted — a new release landed and you are further
behind than when you signed off;
- a worse quadrant at the same drift — the maintainer walked away since you
accepted it. That is the change this tool exists to notice, and it is the one
a plain "ignore these versions" list would miss.
Writing or clearing a baseline never costs a rescan: the reports are already in
hand, and accepting them is a filter over what they say.
Long scans
A scan you ask for shows a cancellable progress notification naming the manifest
and its position (apps/api/v2/package.json — 24/65), and findings appear in
the pane as the registries answer rather than all at the end. Cancelling — from
the notification or depwatch: Cancel the running scan — stops further
requests being issued; ones already in flight are left to finish, since their
answers are worth caching either way. Whatever was found stays.
Background scans (startup, save, the six-hour timer) report into the pane's own
progress bar instead, and are not cancellable — there is nothing to wait for.
When it scans, and what it costs
Scanning means asking five public registries about every dependency you have,
so the extension is built to do it rarely and remember the answers:
| Trigger |
Default |
| Workspace opens |
on — usually served entirely from the cache |
| Manifest or lock file saved |
on, debounced 1.5s |
| While typing |
never |
| Periodic re-check |
every 6h, and only while the window has focus |
Four things keep the cost down, in the order they get a chance to:
- The file stamps. Before anything is read, the manifest and its lock are
stat'd — mtime and size, or the editor's document version when the file is
open. Unchanged means the previous parse is reused. Reading and
JSON.parseing
a 1 MB lock file is ~10ms of blocking work on the extension host thread, and
a real monorepo lock is several times that; two stat calls are 0.004ms. The
six-hourly re-check takes this path every time — it exists to re-ask the
registries, not to re-read a file that has not moved.
- The dependency signature. If the deps and their versions are unchanged
since the last scan, the previous report is reused and nothing runs at all.
Editing the
scripts block of a package.json costs one parse.
- The TTL cache — memory in front of disk, under the extension's global
storage. A published release is a historical fact, so a version list is good
for 12 hours (
depwatch.cache.registryTtlHours) and deep metadata for 72.
A second window, or tomorrow's session, starts warm. Failures are cached for
ten minutes in memory only, so a package that 404s is asked about once rather
than once per dependency. When a refetch fails, the stale entry is served —
offline degrades to yesterday's report, not to a blank one.
- Concurrency limiting: six requests in flight (
depwatch.concurrency),
one manifest at a time.
Memory is bounded by depwatch.cache.maxInMemory (200 packages). A busy
package's version list is around 130 KB once parsed — react and typescript have
shipped roughly 950 releases each — so an unbounded cache would grow with the
size of your workspace: 400 packages measured at 54 MB, 3000 would be far worse.
Past the cap the least recently used are dropped and re-read from disk in about
a millisecond, so what the extension holds stays flat however big the monorepo.
UI updates are coalesced. A workspace scan finishes one manifest at a time,
and each result used to make every consumer redo its whole job — with 25
manifests that was 25 tree rebuilds and 25 × 25 diagnostic republishes, each one
a file read. Changes are now announced once per 150ms burst and carry which
files moved, so only those are republished. Re-indexing a manifest you are
typing in is debounced too: editing a version number does not rebuild a line
table per keystroke.
If you want it quieter still: set depwatch.scan.refreshMinutes to 0 to turn
the timer off entirely, and depwatch.scan.onSave to false to make scanning
fully manual. If you want it sharper, lower registryTtlHours.
The --deep tier is off by default because it is two extra requests per package
and GitHub rate-limits hard without a token. Run depwatch: Set the GitHub token once, then use the deep scan command when you want the full picture.
Settings
All under depwatch. — see the Settings UI for the full list, which covers
discovery (manifests, exclude, useEditorExcludes, maxManifests), the analysis
(deep, transitive, useLockFile, concurrency), the thresholds that draw
the quadrants (thresholds.staleLibyears, thresholds.riskyViability), the
gates (gates.maxLibyears, gates.maxReplace), the baseline (baseline.path),
scheduling (scan.*), caching
(cache.*), per-quadrant diagnostic severity (diagnostics.*) and what the tab
counts (badge).
Severity defaults: replace warns, upgrade and watch inform, healthy and
unscorable dependencies say nothing.
Behind a proxy
Registry requests go through Node's global fetch in the extension host. If
your network needs a proxy, set http_proxy / https_proxy in the environment
VS Code is launched from; the http.proxySupport setting does not cover
fetch.
Licence
Apache 2.0, same as depwatch.

