
Headroom StatsA fancy, live dashboard + status-bar widget for Headroom token savings — every saving Headroom tracks, in a graphical UI. Installation Launch VS Code Quick Open ( Ctrl+P), paste the following command, and press enter.Copied to clipboard |

Headroom Stats — VS Code Extension
Companion to the
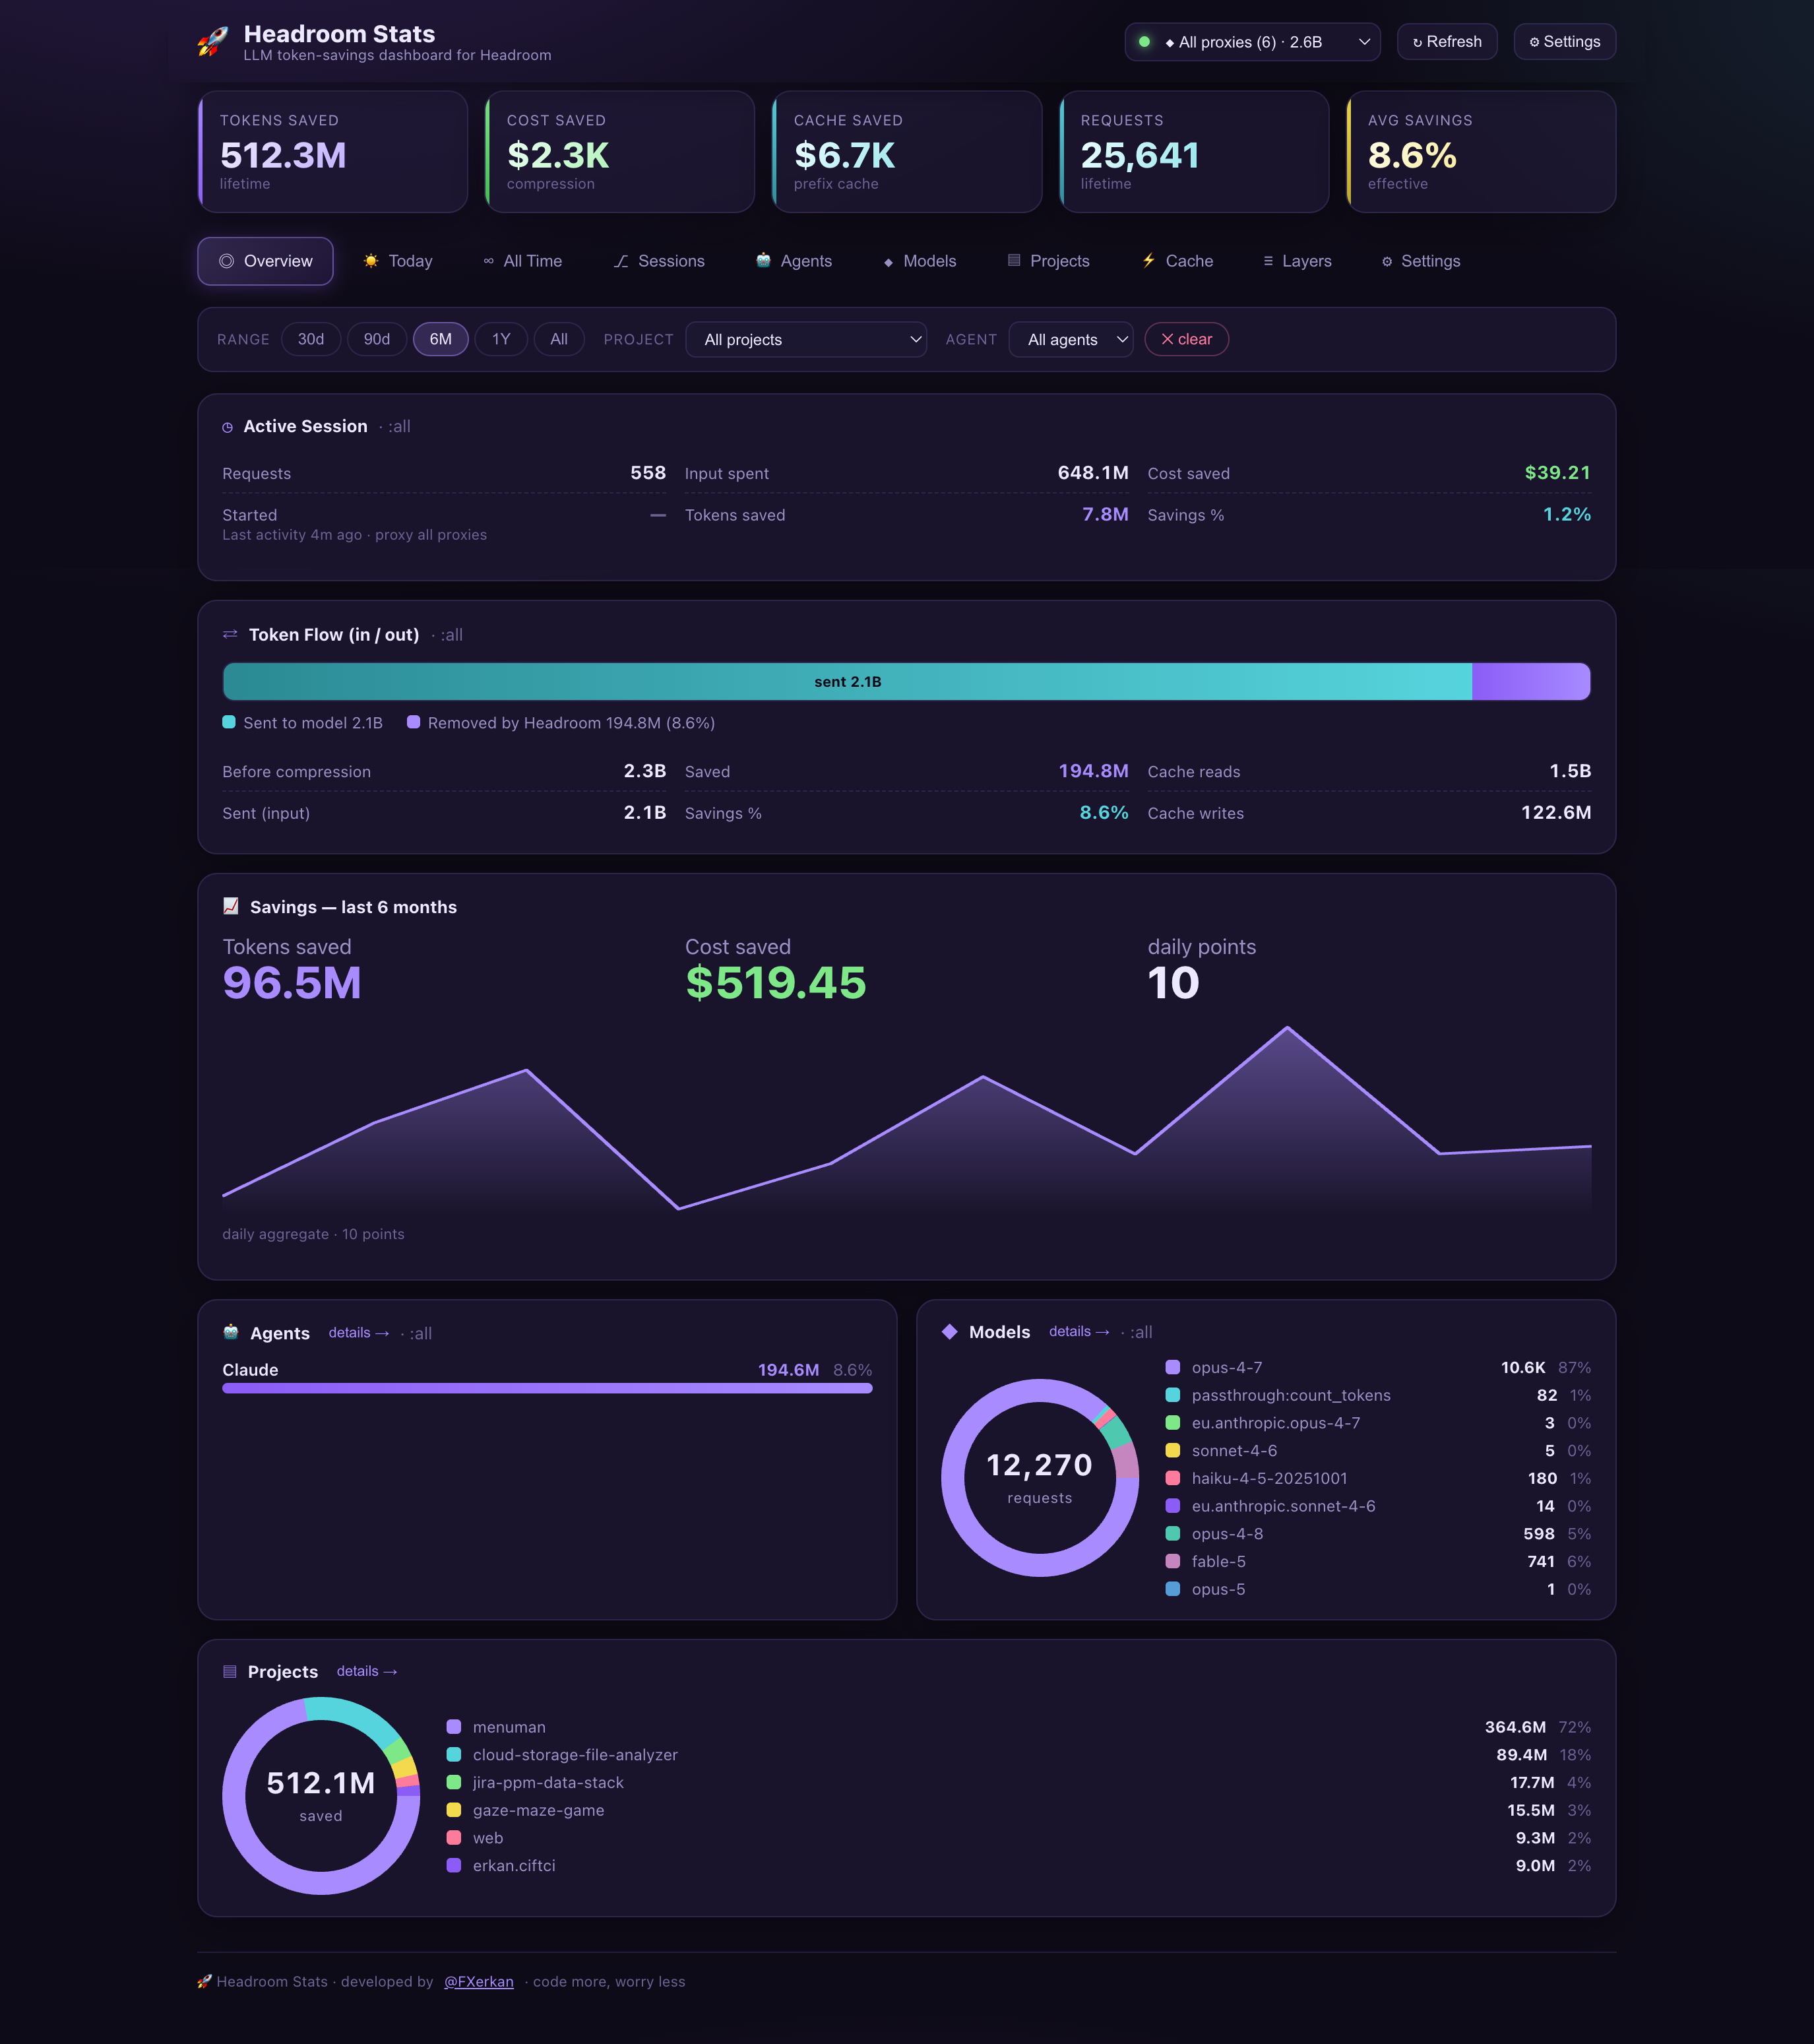
Overview — active session, token flow, savings trend, and top agents / models / projects at a glance (shown in cumulative All proxies mode):
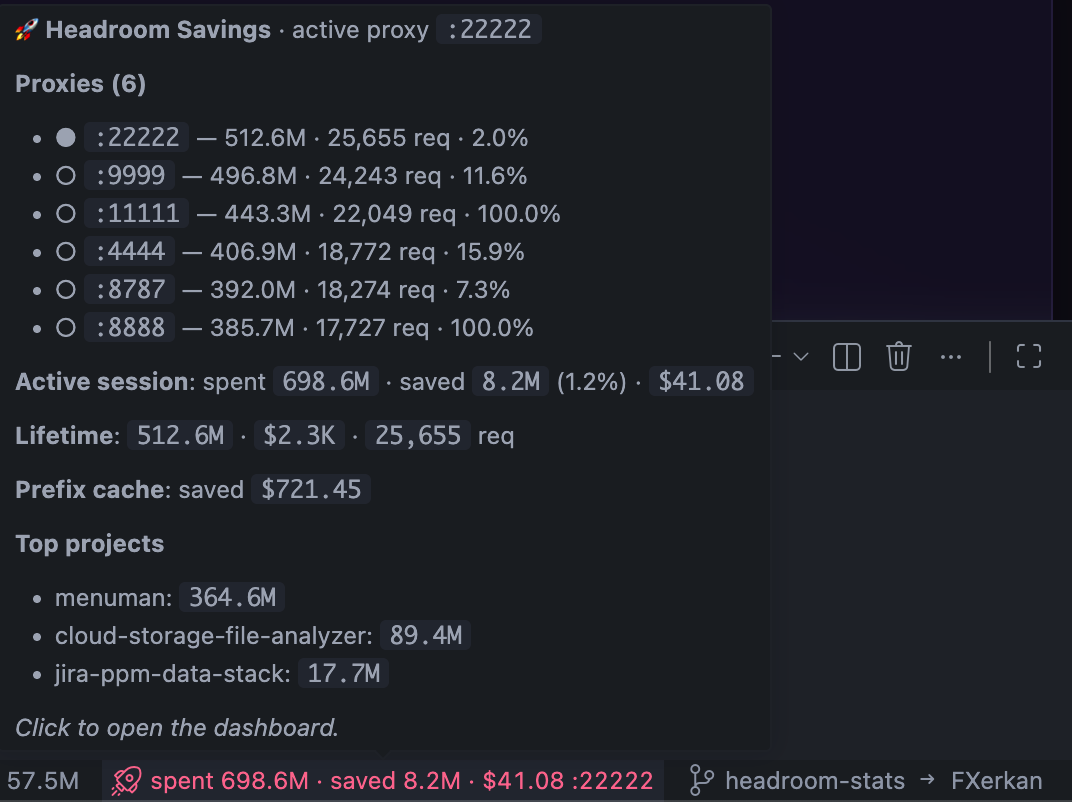
Status Bar Widget — spent, tokens saved cost, savings %, project breakdown, active sessions Features📊 Live dashboard (
|
| Tab | Shows |
|---|---|
| Overview | Everything at a glance — active session,token flow (before → sent + saved, cache reads/writes), savings trend, and top agents / models / projects, each with a details → jump. Filter by date range (7/30/90/All), project (dropdown or click a row) and agent |
| Today | Today's tokens/cost saved, live session KPIs, subscription-window utilization rings (5-hour / 7-day), recent savings trend |
| All Time | Lifetime totals, compression-vs-cache donut, compression detail, savings-over-time area chart |
| Sessions | Current session, recent intervals, per-request log (model, project, before/after, latency) |
| Agents | Per-agent usage — requests, before/after tokens, savings %, models, share bars |
| Models | Requests-by-model donut + per-model detail (saved, sent, reduction %, cache writes) |
| Projects | Token-share donut + full per-project table (requests, saved, cost, savings %, last active) |
| Cache | Prefix-cache stats — reads/writes, hit rates, $ saved, observed TTL mix, compression-vs-cache net |
| Layers | Savings by layer (proxy compression / RTK-CLI filtering / lean context), RTK detail, by-strategy |
| Settings | Edit every option in-place (connection, status bar, hover popup, tabs) — live toggles/inputs that write straight to your VS Code settings |
Data model: lifetime totals, the active session, the full history (thousands of points) and per-project breakdown come from the shared on-disk store (proxy_savings.json), so savings are always fully visible regardless of which proxy you pick. Live agents / models / cache / layers / subscription windows come from the selected proxy's /stats. (Session-level filtering isn't offered because Headroom keeps only the current session's detail, not a per-session archive.)
Note on Branches / Workflows: Headroom's
/statsAPI tracks savings by project, model, agent, and layer — but not by git branch or workflow. So instead of empty "Branches"/"Workflows" tabs, this extension ships the two data-rich Headroom-native tabs Cache and Layers. If you'd like literal Branches/Workflows tabs (populated from Claude Code's own session logs), that's a straightforward addition — open an issue.
🚀 Status-bar widget
A compact, always-visible widget (default: spent 2.8M · saved 19.0K · $0.10) that:
- Refreshes on an interval (default 10s)
- Color-codes by this session's savings % (green / yellow / red, thresholds configurable)
- Shows a rich hover popup (session, lifetime, top projects, cache — all configurable)
- Click → opens the dashboard
Everything about it is user-configurable in Settings (Headroom: Open Settings, or the ⚙ button in the dashboard).
Multiple proxies
Run several claude-hr --port <N> sessions and each one shows up as a separate proxy. The extension:
- Discovers every running proxy via
~/.headroom/.beacon_lock_*. - Shows a proxy switcher at the top of the dashboard (e.g.
6 proxies→:8787 · :8888 · :9999 …), each pill labelled with its tokens saved and savings %. Click to switch which proxy the whole dashboard reflects. - Marks the active proxy in the status-bar hover popup, which lists all proxies with per-proxy totals.
- Remembers your selected proxy (per workspace); if it goes away, it falls back to the most-active one.
Data source — no CLI required
The extension is standalone. It does not need the headroom-stats CLI (or any of the claude-hr / hr-proxy scripts) installed. It reads Headroom directly:
http://localhost:<port>/stats— the live Headroom proxy (rich, real-time).~/.headroom/proxy_savings.json— disk fallback when no proxy is up (lifetime + session + projects + history stay visible).
What it does need is Headroom itself running at least once, so there is data to show — either a live proxy on a port, or the saved proxy_savings.json on disk. With neither, the dashboard shows an empty state explaining how to start one.
No proxy running? Start Headroom (hr-proxy start, or just run claude-hr), then click Refresh.
Settings
| Setting | Default | What it does |
|---|---|---|
headroomStats.port |
8787 |
Primary proxy port to query |
headroomStats.autoDiscoverPorts |
true |
Probe other proxies via beacon locks |
headroomStats.refreshSeconds |
10 |
Status bar + dashboard refresh interval |
headroomStats.statusBar.enabled |
true |
Show the widget |
headroomStats.statusBar.alignment |
right |
left / right |
headroomStats.statusBar.icon |
rocket |
Codicon name (e.g.zap, flame, graph) |
headroomStats.statusBar.metrics |
["sessionSpent","sessionSaved","sessionCost"] |
Which values, in order |
headroomStats.statusBar.colorMode |
percent |
none or color by savings % |
headroomStats.statusBar.goodThreshold |
15 |
≥ → green |
headroomStats.statusBar.warnThreshold |
5 |
≥ → yellow, below → red |
headroomStats.hover.sections |
["session","lifetime","projects","cache"] |
Hover popup sections |
headroomStats.dashboard.tabs |
all 8 | Which tabs to show, in order |
headroomStats.dashboard.defaultTab |
today |
Tab selected on open |
Status-bar metric options: sessionSpent, sessionSaved, sessionCost, sessionPercent, lifetimeSaved, lifetimeCost, cacheSaved, requests, todaySaved, todayCost.
Develop / run locally
cd vscode-extension
npm install
npm run compile          # or: npm run watch
Then press F5 in VS Code (Run → Start Debugging) to launch an Extension Development Host with the extension loaded. The status-bar widget appears immediately; run Headroom: Open Savings Dashboard from the command palette.
To preview the dashboard UI in a plain browser (for tweaking styles or capturing screenshots) — no VS Code needed:
npm run preview # builds from your live proxies + disk, serves it, and opens your browser
This starts a small local server on http://localhost:5599 (override with PREVIEW_PORT) and opens it automatically. It is not a Headroom proxy port — don't open localhost:8787 (that's the proxy itself). Press Ctrl-C to stop.
Install from a .vsix
npx @vscode/vsce package --no-dependencies    # → headroom-stats-<version>.vsix
code --install-extension headroom-stats-<version>.vsix
Or in VS Code: Extensions → ⋯ → Install from VSIX…
🚀 Headroom Stats · developed by @FXerkan · code more, worry less