TaintFlow+
TaintFlow+
AI-Powered Security Verification & Repository Intelligence
💡 Quick Configuration Guide: For the complete step-by-step setup, Ollama local model configurations, cloud API key guides, and UI screenshots, please refer to the main README.md file located at the root of your workspace directory.
Overview
TaintFlow+ is a state-of-the-art, real-time security verification platform designed specifically to validate AI-generated code directly within your IDE.
TaintFlow+ acts as your automated security sentinel, scanning your workspace in real time using a multi-layered verification engine:
- Static Analysis Engine: Fast, pattern-based scanning for 14+ languages.
- Local LLM Integration (Ollama): Offline, private verification utilizing local models like
deepseek-coder or gemma3.
- Cloud AI Orchestration: Seamless high-intelligence verification using API providers such as Google Gemini and Groq.
- Hybrid Security Rules Engine: Combined semantic analysis and taint-tracking heuristics.
Key Features
- Real-Time Vulnerability Detection: Automatic verification runs as you open, edit, paste, or save code.
- AI-Powered Verification: Dual-mode engine uses local LLMs or cloud providers to perform deep security triage.
- Graphify Repository Intelligence Map: Generates a conceptual dependency and service architecture map of your codebase.
- Neural Flow Visualization: Renders an interactive webview visualization of files, databases, APIs, and their relationships.
- Security Flow Analysis: Interactive paths showing exactly how taint flows from sources to vulnerable sinks.
- Vulnerability Highlighting: Highlights vulnerable code paths directly in the editor using VS Code diagnostics.
- Quick Fix Support: Offers inline fixes powered by LLMs to replace vulnerable code with secure patterns instantly.
- Cross-IDE Platform Support: Runs uniformly in VS Code, Cursor, and Antigravity.
- Local-First Architecture: Zero data leaves your machine unless you explicitly choose to enable cloud API providers.
- Flexible Cloud Verification: Fallback orchestrator with circuit-breaker protection to shift between Gemini, Groq, and Ollama.
Installation
- Open the Extensions View in VS Code (
Ctrl+Shift+X or Cmd+Shift+X).
- Search for TaintFlow+.
- Click Install.
- (Optional) Install Ollama for 100% private, local-first code verification.
ollama run deepseek-coder:1.3b
Configuration
TaintFlow+ is highly customizable. Configure settings via VS Code settings (Ctrl+, or Cmd+,):
| Setting Key |
Type |
Default |
Description |
taintflow.autoVerify |
boolean |
true |
Enable/disable auto-verification on save, open, and paste. |
taintflow.enableNotificationToasts |
boolean |
true |
Show notification toasts in the bottom right when risks are found. |
taintflow.mode |
string |
"auto" |
Select engine mode: auto (hybrid API first + local fallback), api (cloud only), or local (Ollama only). |
taintflow.localModel |
string |
"auto" |
Select the local LLM model name to use with Ollama. Set to 'auto' to automatically detect the best available coder, llama, or gemma model. |
taintflow.providers |
object |
{"anthropic": true, "google": true, "groq": true} |
Enable or disable individual AI analysis providers. |
taintflow.google.apiKey |
string |
"" |
Google Gemini API Key (fallback if not stored securely via configure command). |
taintflow.groq.apiKey |
string |
"" |
Groq API Key (fallback). |
taintflow.anthropic.apiKey |
string |
"" |
Anthropic API Key (fallback). |
Note: For security, it is recommended to configure API keys using the secure TaintFlow+: Configure... commands, which write directly to the OS Keychain.
Interface Overview
TaintFlow+ integrates three primary control surfaces directly into the IDE, each serving a distinct purpose in your security workflow. Here is a breakdown of each, as annotated in the screenshot below:
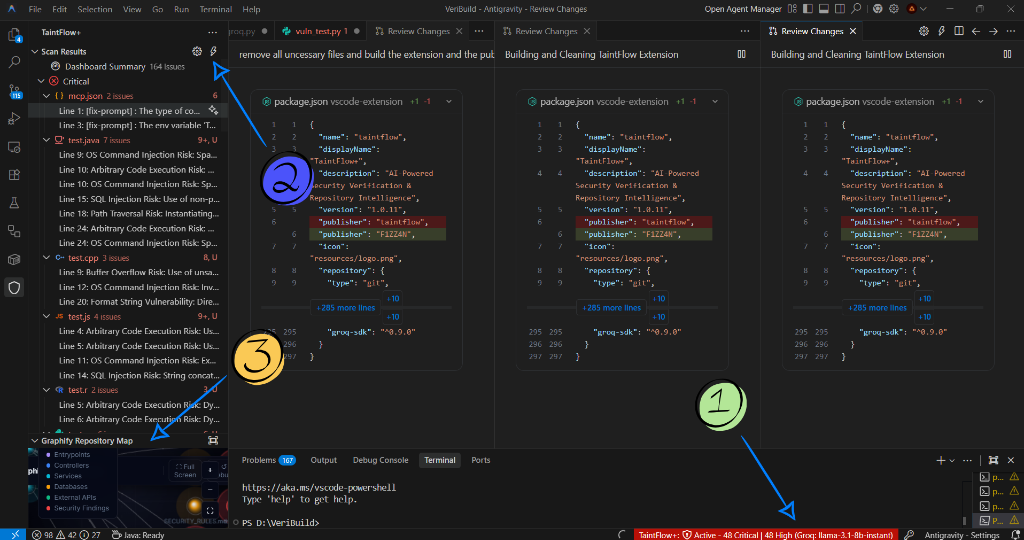
Location: Bottom of the editor window (VS Code status bar)
The TaintFlow+ status bar item is always visible at the bottom of your editor. It provides a real-time, at-a-glance security summary of your active workspace.
What it shows:
- Active status — whether the engine is running or paused.
- Live vulnerability counts — total number of Critical and High findings detected across your open files.
- Active AI model — the currently active provider and model (e.g.,
Groq: llama-3.1-8b-instant).
Example display:
TaintFlow+: ⚡ Active — 48 Critical | 48 High (Groq: llama-3.1-8b-instant)
How to use:
- Click the status bar item to instantly open and focus the TaintFlow+ sidebar panel, giving you the full breakdown of all detected vulnerabilities grouped by severity.
Location: Top-right of the Scan Results sidebar panel header
Two icon buttons sit in the header of the Scan Results view, providing fast access to the extension's two most important global actions.
⚙️ Gear Icon — Settings Dashboard
- Opens the TaintFlow+ Settings Dashboard in a dedicated webview panel.
- Use this to:
- Configure and save your API keys (Google Gemini, Groq, Anthropic/Claude).
- Select your LLM execution mode (
auto, api, or local).
- Set your preferred local Ollama model.
- Toggle Auto-Verify and notification toasts on or off.
⚡ Zap Icon — Copy All Fix Prompts
- Copies every fix prompt for all detected vulnerabilities to your clipboard in a single action.
- Each prompt contains the vulnerable code snippet, the issue description, and a structured instruction to generate a secure replacement.
- Workflow: Click ⚡ → paste the output into an AI assistant (e.g., ChatGPT, Antigravity, Claude) → receive patched, secure code for all findings at once.
③ Graphify Repository Map — Full Screen & Context Export
Location: Bottom panel of the TaintFlow+ sidebar, labeled "Graphify Repository Map"
The Graphify Repository Map renders an interactive, neural-network-style visualization of your entire project's architecture — mapping file dependencies, services, databases, and entry points as a live node graph.
To expand to Full Screen:
- Locate the Graphify Repository Map panel at the bottom of the TaintFlow+ sidebar.
- Click the ⛶ Full Screen button (expand icon) in the panel header.
- The map opens in a dedicated editor tab at full resolution, giving you a large canvas to explore your repository topology.
Controls available in Full Screen:
| Button |
Action |
| 📋 Copy Context |
Generates a structured, AI-optimized summary of your entire project (architecture, frameworks, entry points, APIs) and copies it to your clipboard. Paste directly into any AI assistant for instant project context. |
| 📋 Copy Repo Map |
Copies the complete, raw JSON representation of the repository index to your clipboard. Contains every file node, dependency edge, service, database, and API mapping in full detail. |
| ↺ Rebuild |
Re-indexes your entire workspace and refreshes the graph with the latest file structure and dependency changes. |
| 🔍 Search |
Filter and highlight specific nodes in the graph by filename or path. |
| + / − / ⛶ |
Zoom in, zoom out, and fit-to-screen camera controls. |
Clicking a node in the graph opens the corresponding file directly in your editor and shows an Inspect Panel with type, language, line count, and connection details.
Commands
Access the Command Palette (Ctrl+Shift+P / Cmd+Shift+P) and search for:
TaintFlow+: Run Security Scan — Manually scan the active document.TaintFlow+: Configure Google API Key — Securely store your Gemini API key.TaintFlow+: Configure Groq API Key — Securely store your Groq API key.TaintFlow+: Configure Anthropic API Key — Securely store your Anthropic API key.Graphify: Rebuild Repository Index — Re-scan workspace architecture.Graphify: Open Full Screen Map — Open the Graphify webview in a full-screen tab.
License
This project is licensed under the MIT License - see the LICENSE file for details.
Copyright (c) 2026 Mohamed Faizaan
