Skip to content
| Marketplace
Sign in
Visual Studio Code>Programming Languages>EsperEPLNew to Visual Studio Code? Get it now.
EsperEPL

EsperEPL

EsperTech

|
1,814 installs
| (0) | Free
EsperTech Esper EPL
Installation
Launch VS Code Quick Open (Ctrl+P), paste the following command, and press enter.
Copied to clipboard
More Info

EsperTech Esper EPL Extension README

This extension is for use with EsperTech Esper. Esper provides Complex Event Processing (CEP), Streaming Analytics and Streaming SQL. For more information on Esper please navigate to Esper Home Page. The Esper license is GPLv2. The VSCode extension license is below.

License

This Visual Studio Code extension is licensed under Terms. The language server is a separate Java program that is licensed as described under Running the Language Server.

Features

This extension provides the following features:

  • Syntax highlighting, see Syntax Highlighting.
  • Diagnostics (requires Language Server), see Diagnostics.
  • Running scenarios (requires Language Server), see Running Scenarios.
  • Debugging EPL (requires Language Server which also hosts the debug adapter), see Debug EPL.

Requirements

For diagnostics and running scenarios you must start the language server. The language server is a Java program that communicates with VSCode. Please following the instructions at Running the Language Server.

Extension Settings

This extension contributes the following settings:

  • esperepl.languageServerPort: The port number of the Language Server. Defaults to 5008.
  • esperepl.debugAdapterPort: The port number of the Debug Adapter. Defaults to 5009.
  • esperepl.scenarioRunStartTimestamp: The default absolute start time for running scenarios. Use format 'yyyy-MM-dd HH:mm:ss.SSS'. Defaults to '1970-01-01 00:00:00.000'.

Known Issues

  • The language server logs java.io.IOException: The specified network name is no longer available. when VSCode closes.

Release Notes

0.0.1 released Aug. 28, 2020

Initial release:

0.1.0 released Jan. 27, 2021
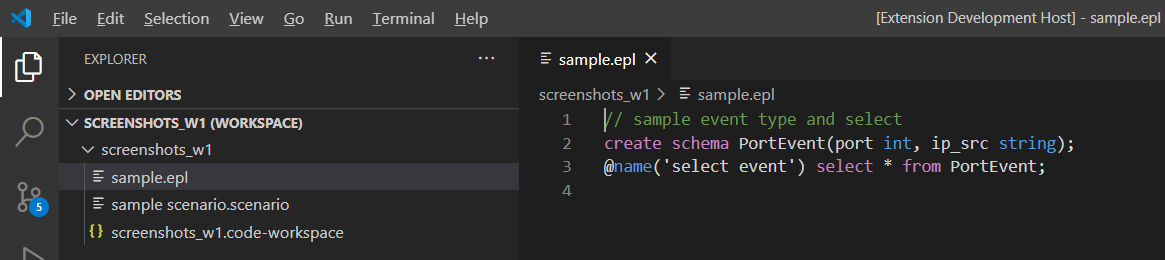
  • Added EPL debugger.
  • Diagnostics now considers all EPL files of the project and provides all EPL compilation errors for all project EPL files.
  • Scenario-run view now only displays the scenario files.

Usage

Syntax Highlighting

All files with the .epl extension are syntax-highlighted. There is no need to run the language server for syntax highlighting. Here is a sample screenshot:

Diagnostics

All files with the .epl extension are compiled automatically by the language server and the Esper EPL compiler (requires a running language server, see below). The editor underlines incorrect EPL and displays the messages when hovering.

The language server compiles all EPL files in the workspace folder(s) and adds all EPL files in the workspace to the EPL compiler path. The compilation errors appear in the PROBLEMS panel (
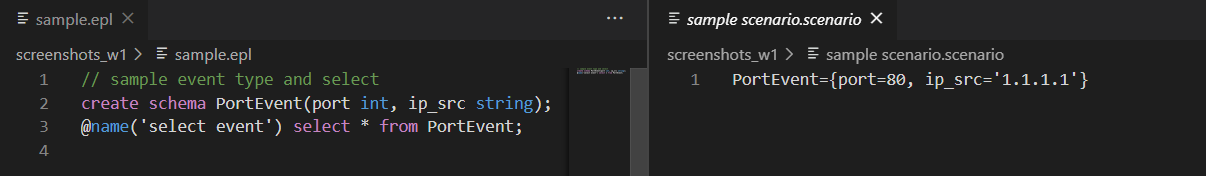
Ctrl+Shift+M) with a list of all current errors.

Running Scenarios

You may add scenario files that have the .scenario extension to your workspace. For more information on scenarios please see Scenario Interpreter. This screenshot shows an EPL file on the left side and a scenario file on the right side:

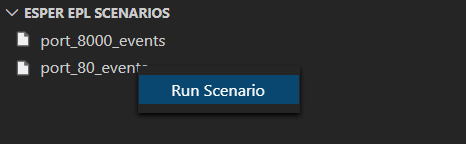
The explorer menu contains the Esper EPL Scenarios view. This view displays all scenario files of the workspace.

You can right-click on a scenario and choose Run Scenario to run the scenario and display EPL output (requires a running language server, see below). Click on the round Refresh button to refresh the view considering all workspace scenario files. Click on a scenario to open the file in the editor.

After running a scenario with right-click and Run Scenario, the output appears in an editor column. The output is organized per EPL statement by tabs. This is an example output:

The language server automatically deploys all EPL files in the workspace when running the scenario.

Debugging EPL

The extension allows you to debug EPL. Here's a list of supported debugging features:

  • Launch
  • Breakpoints
  • Step In/Out/Over/Resume
  • Variables
  • Call Stacks
  • Debug Console

The debugger requires a scenario file that provides the event and time input. The debugger is not suitable to debugging a Java application that embeds EPL.

Debugging EPL - Install

The EPL debugger requires that the Language Server is running, since the language server also hosts the debug adapter.

Optionally, for the debugger to work with Java files, we recommend installing the Java Extension Pack, which bundles the Language Support for Java(TM) by Red Hat. Note that the Language Support for Java(TM) by Red Hat requires Java 11 and higher.

Debugging EPL - Configure And Launch

You may open a scenario file and use the F5 key or choose Run -> Start Debugging from the menu. Choose "Esper EPL Debugger". The debugger automatically generates a launch configuration that stops on-entry.

If you would like to create a launch configuration, click on the Debug view (Ctrl+Shift+D). Make sure an EPL or scenario file is currently open (not a Java file) and click the "create a launch.json" link. The launch.json file is always located in a .vscode folder. You can create multiple debug configurations for your project and select the desired one to run in the dropdown at the top of the Debug view.

A sample launch.json file is shown below:

{
    "version": "0.2.0",
    "configurations": [
        {
            "type": "esperepldebugger",
            "request": "launch",
            "name": "launch",
            "scenario": "${workspaceFolder}/port_80_events.scenario",
            "stopOnEntry": true
        }
    ]
}

The launch configuration has:

  • The "type" must always be "esperepldebugger" for using the EPL debugger.
  • The "request" must always be "launch"` for launching (attach is not supported).
  • The "name" is a required string and is the name of the debug configuration, by default "launch".
  • The "scenario" is a required string and is the name of the scenario file. Specify ${workspaceFolder}/${command:AskForScenarioFileName} to prompt for a scenario file name when launching.
  • The "stopOnEntry" is an optional boolean-type value that controls whether the debugger stops right after the runtime initialization at the step where the debugger sets the runtime start time.

Launching the debugger requires that all EPL files within the project compile error-free. The debugger deploys all EPL files within the folder to the runtime.

The debugger produces an output file in the markdown format (Ctrl-Shift-V to view). This file lives in the VSCode storage area. A link to the file can be found among the debugger output in the debug console. When the debugger is stopped, the Call Stack (left, part of Debug View, (Ctrl+Shift+D)) under Output also links to the output file. The path of the output file is: /path/to/globalstorage/espertech.esperepl/esperepldebugger/<version>/<scenariofilename>__<launchname>.md.

The Debug Console (Ctrl-Shift-Y) shows debugger messages.

Debugging EPL - Breakpoints

You can set breakpoints on:

  • EPL
  • Scenario events and time advancing
  • Trace file entries
  • Esper Java code
  • Your application Java code.

You can set above breakpoints before launching or after launching when the debugger is stopped.

Debugging EPL - Breakpoints on EPL

You can open an EPL file and set breakpoints on individual EPL statements.

The debugger stops when the runtime processes an event or time for the EPL statement(s) that have a breakpoint.

You can only set a breakpoint on the whole EPL statement. It is not possible to set a breakpoint on specific parts of the EPL statement, i.e. it is not possible to set a breakpoint on a specific subquery, stream or pattern expression, for example. You can use the trace breakpoints for this purpose.

The debugger validates breakpoints upon launching, or if launched already the debugger validates breakpoints immediately. EPL breakpoints cannot be set on create-schema, create-variable, create-table or create-window and all other create-object EPL.

Debugging EPL - Breakpoints on Scenario

You can open a Scenario file and set breakpoints on individual Scenario items.

The debugger stops when the runtime processes an event or time for the scenario item(s) that have a breakpoint. The allows you to set a breakpoint on a specific event and on time advancing.

Debugging EPL - Breakpoints on Trace

The debugger, before launching, deploys the EPL and executes the scenario and produces a trace file in in text format. This file lives in the VSCode storage area. A link to the file can be found among the debugger output in the debug console. When the debugger is stopped, the Call Stack (left, part of Debug View) under Trace also links to the trace file. The path of the trace file is: /path/to/globalstorage/espertech.esperepl/esperepldebugger/<version>/<scenariofilename>__<launchname>.epltrace.

The trace file contains the procedural execution trace of all workspace EPL when feeding events and time according to the scenario. Within the trace file you can find all steps with nested steps indented. After launching with stop-on-entry (true by default), you can navigate to the trace file and set additional breakpoints.

The debugger stops when the runtime processes a trace step that has a breakpoint. The allows you to set a breakpoint on specific processing steps.

A trace file breakpoint causes the debugger to stop when it reaches that specific point of processing. The debugger stops only once for each trace file breakpoint.

Debugging EPL - Breakpoints on Java Code

If you know specific Java classes that you want to set a breakpoint on, you may look up the class using symbol lookup (Ctrl-T). The language server finds Java code inside jar files in two places:

  • Jar files that are added to the project workspace
  • Jar files that are added to the sourcejars directory of the language server.

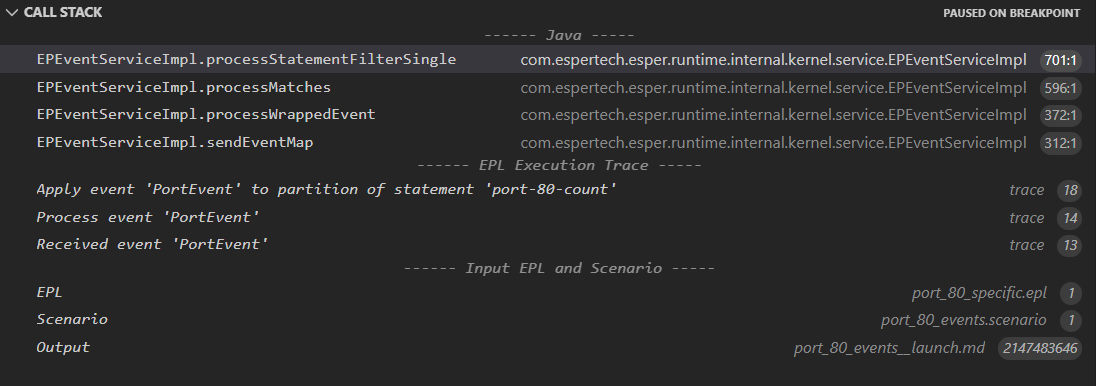
Upon launching the debugger validates and activates breakpoints when Java classes with breakpoints are loaded.

Debugging EPL - Call Stack

Upon stopping the Debug view (Ctrl+Shift+D) has the Call Stack.

The Call Stack has three sections:

  1. Java section under the label ------ Java -----
  2. Trace section under the label ------ EPL Execution Trace -----
  3. EPL and Scenario under the label ------ Input EPL and Scenario -----

The Java section contains the JVM execution stack of Java classes. You can click on each class to open the class code and to and see the variables in scope.

The Trace section contains the stack as processing steps in the trace file (see above). You can click on each trace step to position to the trace file and to see the trace information in scope.

The EPL and Scenario section contains up to three entries:

  1. EPL entry
  2. Scenario entry
  3. Output entry

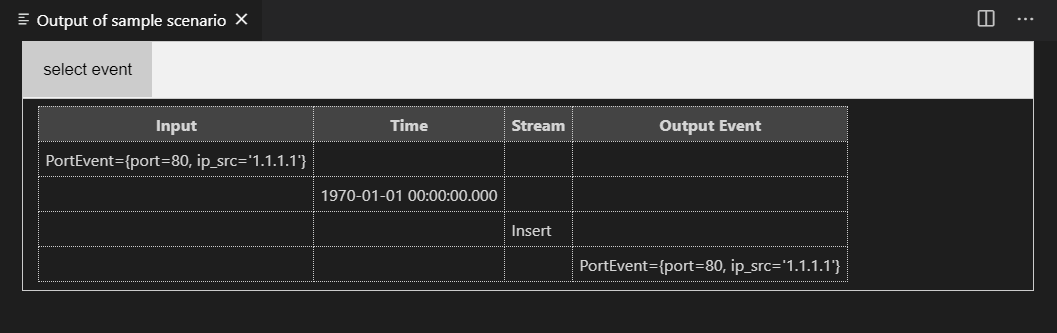
The EPL entry only appears when the current stack is specific to a given EPL statement. You can click on this entry to position to the EPL file (empty variable scope). If the current stack is not specific to any EPL statement, such as for example when the runtime evaluates which EPL statements must process a given event or a given time, the EPL entry does not appear.

The Scenario entry only appears when the current stack is specific to a given scenario item. You can click on this entry to position to the Scenario file (empty variable scope). If the current stack is not specific to a scenario item, such as for example when the runtime sets the start time, the Scenario entry does not appear.

The Output entry is a link to the output file that the debugger appends to when the runtime delivers output to listeners. You can click on this entry to open to the Output file (empty variable scope).

Debugging EPL - Example (1) - Aggregation Functions

This example walks you through debugging EPL that has aggregation functions. First create an empty folder and create an EPL file and a scenarion file.

Create an EPL file by name "portcount.epl" and enter:

create schema PortEvent(port int);

@name('count-per-port') select port, count(*) from PortEvent group by port;

Create a Scenario file by name "portcount_test.scenario" and enter:

PortEvent={port=80}
PortEvent={port=81}
PortEvent={port=80}

With the scenario file open, press F5 to launch the debugger. The debugger by default sets "stopOnEntry" : true thereby the debugger stops on-entry, which is when the runtime set the start timestamp.

In the debug view under Call Stack click on Received Time ... under ------ EPL Execution Trace -----. This will bring up the trace file. Alternatively go to Debug Console (Ctrl-Shift-Y) and look for Trace file path is ... and ctrl-click on the file to open.

The trace file should be similar to:

Received time '1970-01-01T00:00:00.000-05:00' (initialization)
  Process time to '1970-01-01T00:00:00.000-05:00'
    Evaluate schedule '1970-01-01T00:00:00.000-05:00'
Deploy 2 statements
  Started statement named 'stmt-0'
  Started statement named 'count-per-port'
Received event 'PortEvent' (portcount_test.scenario:1, PortEvent={port=80})
  Process event 'PortEvent'
    Determine statement interest in event
    Apply event 'PortEvent' to partition of statement 'count-per-port'
      Process event for from-clause
        Process unbuffered non-join insert+remove events for output
          Process fully-aggregated grouped
            Compute group key objects for insert stream
              Evaluate identifier 'port'
            Enter values into grouped aggregations (1/0 aggregations)
              Add value to aggregation 0 expression : count(*)
            Evaluate select-clause (insert stream)
              Evaluate identifier 'port'
              Evaluate aggregation count(*)
  Indicate results for statement 'count-per-port'
Received event 'PortEvent' (portcount_test.scenario:2, PortEvent={port=81})
(...more...)

Set a breakpoint, for instance, on Add value to aggregation 0 expression : count(*). Press Continue or F5. The debugger stops at the point where Java code applies the new count.

Debugging EPL - Example (2) - Intermediate Stream and Table Example

The folder that contains this example is part of the language server under languageserver/examples/workspaces/example_two. In VSCode open the example_two folder. Go to the Debug view (Ctrl+Shift+D). Press the green play button that has the launch text. In the Call Stack find Received Time and click on that to open the trace file. In the trace file, find Process event 'PortUserStream'. Set a breakpoint and continue (F5). This brings you to the entry point where that specific PortUserStream event gets processed. You can inspect the eventBean event among the Variable values to see event details.

Running the Language Server

The language server is part of Esper Enterprise Edition and is free to use. It is licensed under the terms of Esper Enterprise Edition.

The language server also contains the debug adapter. By running the language server the server exposes a port that speaks the Language Server Protocol and a second port that speaks the Debug Adapter Protocol.

You can download Esper Enterprise Edition which includes the language server (a Java server-side program) at Download. You must provide a company or university email address when registering for the download.

After unpacking the distribution, the commands to run the language server are:

Linux Windows
cd languageserver/bin
./esperlanguageserver.sh run
cd languageserver\bin
esperlanguageserver.bat run

The default settings for the language server are below. You may change language server settings by passing command line parameters.

Setting Value
Language Server Port 5008
Language Server Host 0.0.0.0
Debug Adapter Port 5009
Debug Adapter Host 0.0.0.0
JMX Port 1098
Esper Configuration File languageserver/conf/esper-default.xml
Language Server Logging languageserver/conf/log4j.xml

The language server can run as a daemon and the bin folder provides startup and shutdown scripts. The JMX port is used for managing the running process.

A language server that starts successfully produces output similar to below:

INFO  [LanguageServerBootstrap] Starting Esper Language Server and Debug Adapter
INFO  [SocketServerLauncherLS] Starting Language Server at server socket /0.0.0.0:5008
INFO  [SocketServerLauncherDAP] Starting Debug Adapter Protocol at server socket /0.0.0.0:5009

The VSCode extension communicates with the language server and for debugging with the debug adapter. Under the Output view among the dropdown channels there is a Esper EPL Output channel. When the communication to the language server is successful the channel displays:

Activating Esper EPL extension. The language server port is 5008.
Esper EPL language client is ready to use

If the connection to the language server fails, the extension displays the following message in Output channel Esper EPL Language Server:

Connection to server is erroring. Shutting down server.
  • Contact us
  • Jobs
  • Privacy
  • Manage cookies
  • Terms of use
  • Trademarks
© 2025 Microsoft