Stata Viewer
Open Stata .dta files inside Visual Studio Code and inspect them as a table, without leaving your editor.
Why this extension exists
Working with .dta files usually means switching to Stata just to inspect variables, check labels, filter rows, or do a quick one-variable tabulation.
This extension is for that narrower job:
- open the dataset,
- understand its structure,
- inspect rows,
- filter and sort quickly,
- review labels and value labels,
- get a fast tabulation or summary for one variable.
It does not try to replace Stata. It is meant for quick inspection, light exploration, and data review inside VS Code.
What it does today
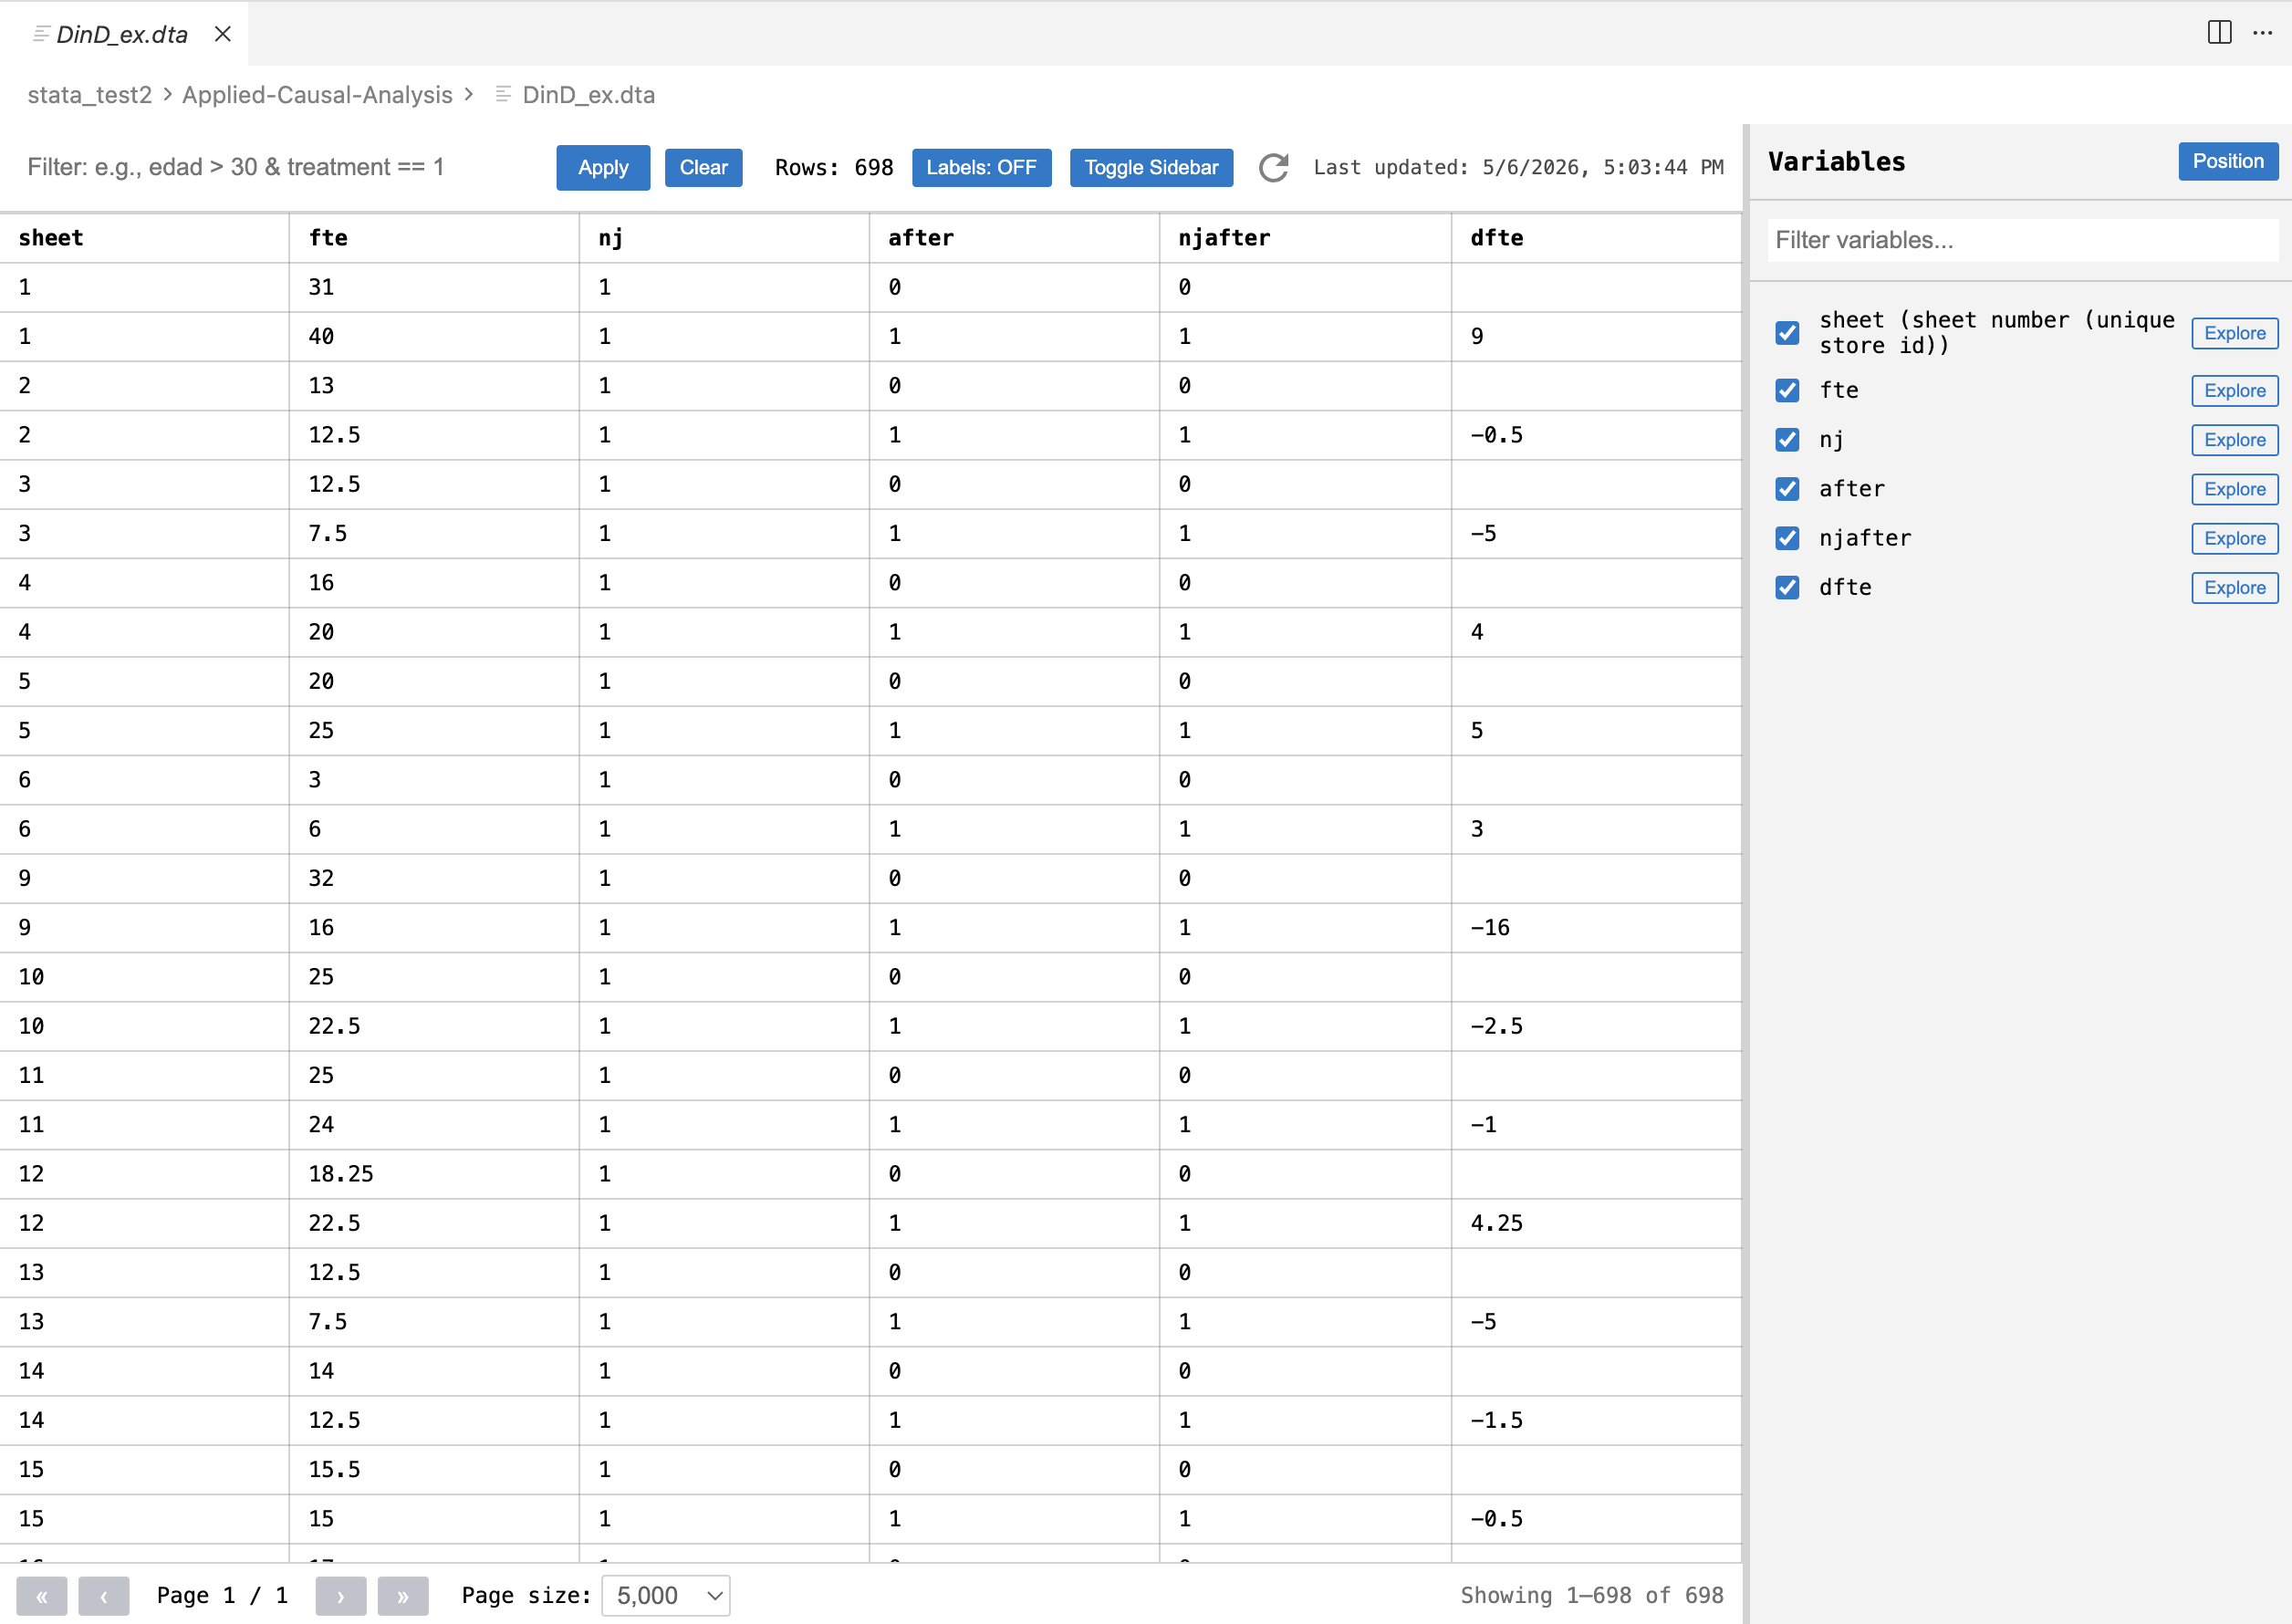
- Opens
.dta files in a custom read-only table view.
- Loads rows with progress feedback.
- Uses pagination for large datasets.
- Filters rows with Stata-like boolean expressions.
- Sorts by one or multiple columns.
- Shows variable labels and value labels.
- Lets you hide or show columns from the sidebar.
- Includes a variable explorer with one-variable tabulation and summary stats.
- Refreshes when the underlying file changes.
What it does not do
- It is not a data editor.
- It does not write changes back to the
.dta file.
- It is not meant to replace Stata for estimation, scripting, or full data management workflows.
Install
- Install the extension from the Visual Studio Marketplace.
- Open any
.dta file in VS Code.
- VS Code will open it with the Stata Data Viewer custom editor.
How to use it
Table view
- Click a
.dta file to open it.
- Use the top bar to filter rows.
- Click column headers to sort.
- Use the sidebar to search variables and hide or show columns.
- Toggle labels if you want to see variable labels more clearly.
Filtering
The filter box accepts boolean expressions over variables.
Examples:
edad > 30treatment == 1edad > 30 & treatment == 1sexo == "M"ingreso >= 500000
If the expression is invalid, the viewer shows the error instead of silently failing.
Sorting
- Single click sorts ascending.
- Click again to sort descending.
- Additional sorting can be combined across multiple columns.
Variable explorer
For each variable, the explorer can show:
- frequency tables for categorical or labeled variables,
- summary statistics for numeric variables,
- optional filtering scoped to the tabulation,
- the option to combine that tabulation filter with the current general table filter.
Good use cases
- Reviewing a dataset in a research repo without opening Stata.
- Checking whether a generated
.dta file looks correct.
- Inspecting labels, encoded variables, and value-label mappings.
- Doing quick QA over exported data.
- Exploring a file while writing code, documentation, or analysis scripts in VS Code.
- Large files are supported, but parse time still depends on file size and available memory.
- The viewer is optimized for inspection, so it paginates rows instead of rendering everything at once.